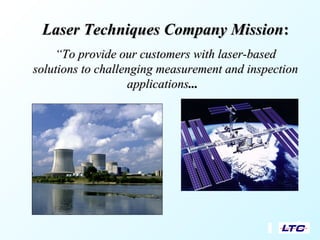
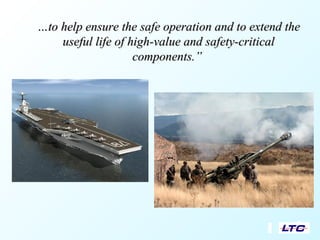
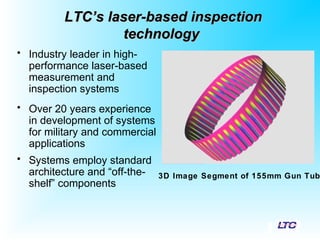
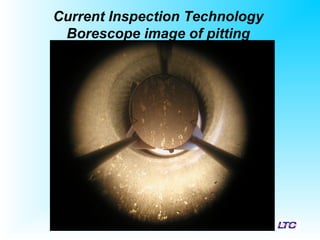
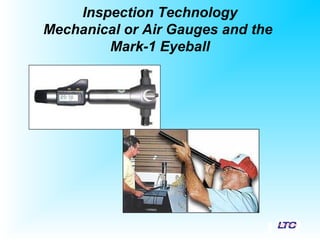
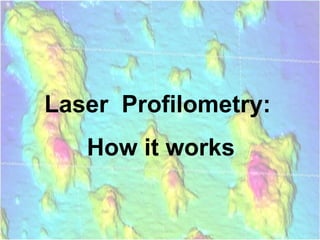
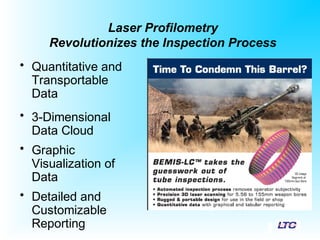
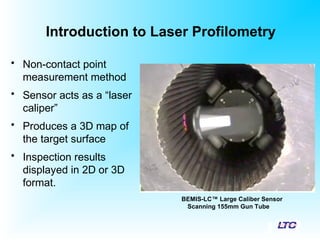
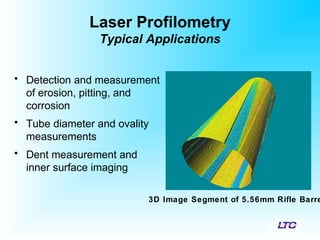
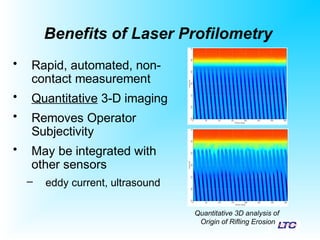
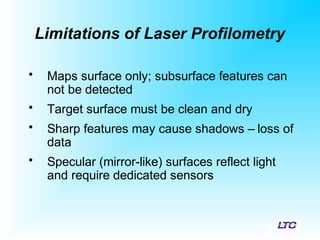
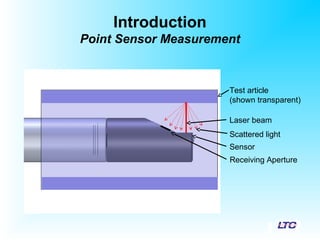
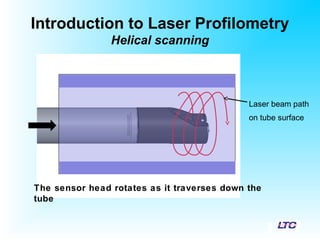
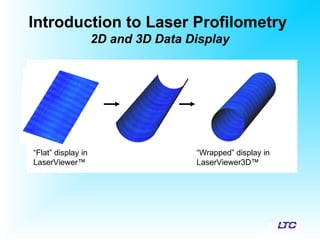
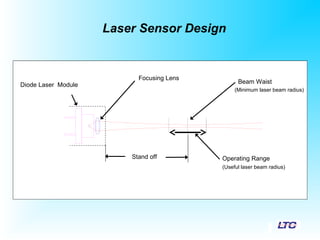
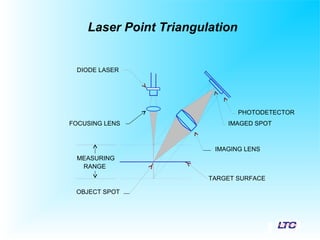
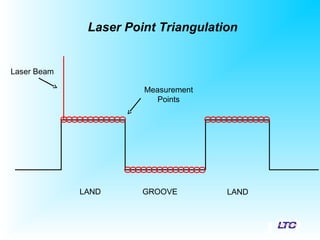
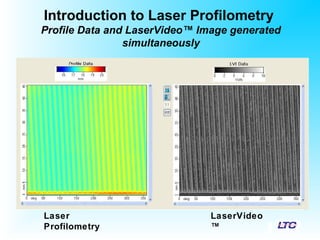
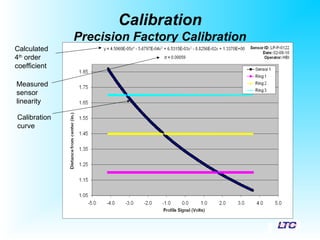
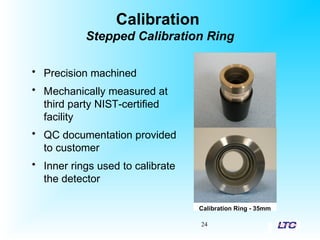
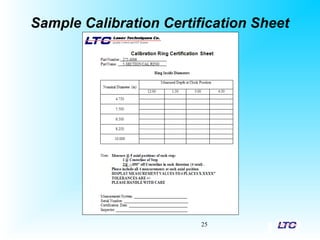
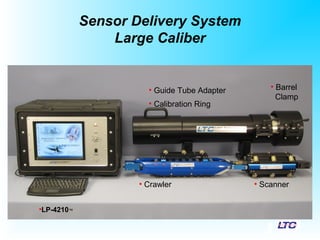
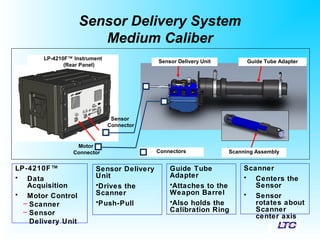
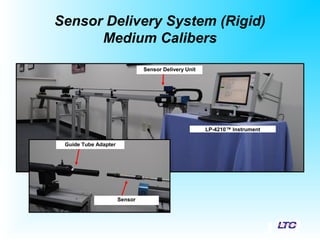
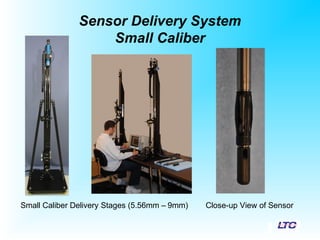
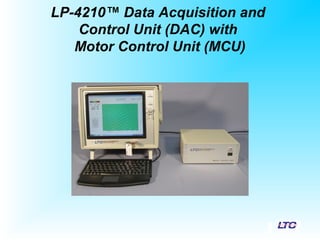
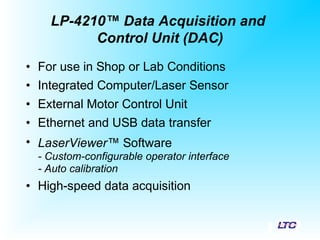
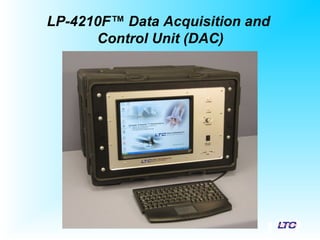
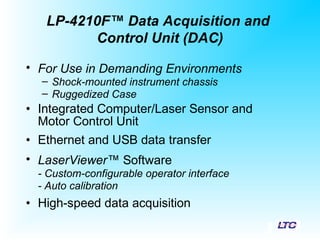
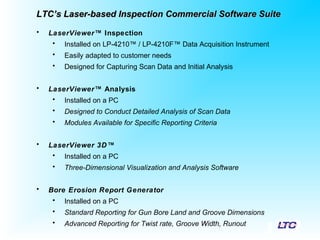
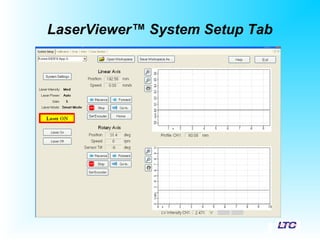
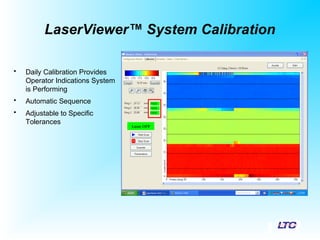
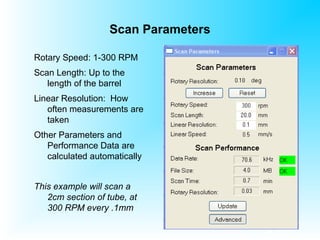
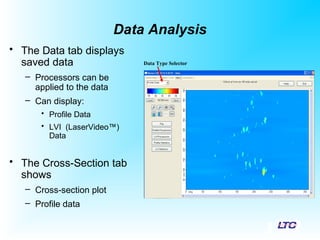
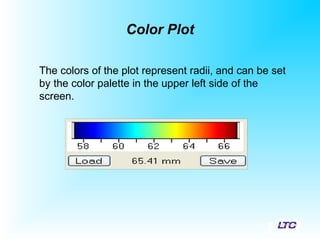
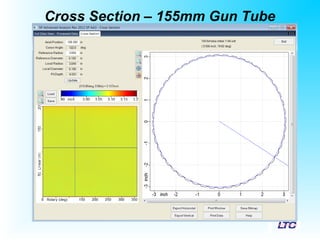
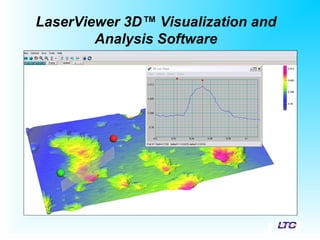
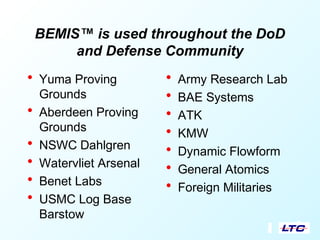
Laser Profilometry
Revolutionizing Gun Tube Inspections
BEMIS™ - Bore Erosion Measurement and
Inspection System
Laser-based Inspections
for 5.56mm to 155mm Weapon Bores
DefenseSystems GroupDefenseSystems Group
Mr. DanielBonnizzio, DirectorMr. DanielBonnizzio, Director
Laser Techniques Company MissionLaser Techniques Company Mission::
““To provide our customers with laser-basedTo provide our customers with laser-based
solutions to challenging measurement and inspectionsolutions to challenging measurement and inspection
applicationsapplications......
……to help ensure the safe operation and to extend theto help ensure the safe operation and to extend the
useful life of high-value and safety-criticaluseful life of high-value and safety-critical
components.”components.”
LTC’s laser-based inspectionLTC’s laser-based inspection
technologytechnology
• Industry leader in high-
performance laser-based
measurement and
inspection systems
• Over 20 years experience
in development of systems
for military and commercial
applications
• Systems employ standard
architecture and “off-the-
shelf” components
3D Image Segment of 155mm Gun Tub
Current Inspection Technology
Borescope image of pitting
Inspection Technology
Mechanical or Air Gauges and the
Mark-1 Eyeball
Laser Profilometry:
How it works
Laser Profilometry
Revolutionizes the Inspection Process
• Quantitative and
Transportable
Data
• 3-Dimensional
Data Cloud
• Graphic
Visualization of
Data
• Detailed and
Customizable
Reporting
Introduction to Laser Profilometry
• Non-contact point
measurement method
• Sensor acts as a “laser
caliper”
• Produces a 3D map of
the target surface
• Inspection results
displayed in 2D or 3D
format.
BEMIS-LC™ Large Caliber Sensor
Scanning 155mm Gun Tube
Laser Profilometry
Typical Applications
• Detection and measurement
of erosion, pitting, and
corrosion
• Tube diameter and ovality
measurements
• Dent measurement and
inner surface imaging
3D Image Segment of 5.56mm Rifle Barre
Benefits of Laser Profilometry
• Rapid, automated, non-
contact measurement
• Quantitative 3-D imaging
• Removes Operator
Subjectivity
• May be integrated with
other sensors
– eddy current, ultrasound
Quantitative 3D analysis of
Origin of Rifling Erosion
Limitations of Laser Profilometry
• Maps surface only; subsurface features can
not be detected
• Target surface must be clean and dry
• Sharp features may cause shadows – loss of
data
• Specular (mirror-like) surfaces reflect light
and require dedicated sensors
Introduction to Lasers
• LTC primarily uses diode lasers
• Diode laser features
– Small package size
– Low power draw
– Long lifetimes
– Available wavelengths: 400 nm – over 1000 nm
– Available laser power: 3 mW – over 30 mW
• For LP applications, LTC typically uses 650-
670 nm lasers, with maximum output <5 mW
SmartLaserTM
• This system is equipped with SmartLaserTM
laser safety mode.
• When the sensor does not detect a surface in
its measuring range, the laser pulses at a low
average power at a rate of 10 Hz until a
surface is detected.
• The SmartLaser™ mode is automatically set
to the ON position by the software.
Introduction
Point Sensor Measurement
Laser beam
Test article
(shown transparent)
Scattered light
Sensor
Receiving Aperture
Introduction to Laser Profilometry
Helical scanning
Laser beam path
on tube surface
The sensor head rotates as it traverses down the
tube
Introduction to Laser Profilometry
2D and 3D Data Display
“Flat” display in
LaserViewer™
“Wrapped” display in
LaserViewer3D™
Laser Sensor Design
Operating RangeStand off
Diode Laser Module
Focusing Lens
Beam Waist
(Minimum laser beam radius)
(Useful laser beam radius)
IMAGED SPOT
IMAGING LENS
TARGET SURFACE
OBJECT SPOT
MEASURING
RANGE
FOCUSING LENS
DIODE LASER
PHOTODETECTOR
Laser Point Triangulation
LAND GROOVE LAND
Laser Point Triangulation
Laser Beam
Measurement
Points
Introduction to Laser Profilometry
Profile Data and LaserVideo™ Image generated
simultaneously
LaserVideo
™
Laser
Profilometry
Calibration
• Factory-calibrated over the full sensor range
using a precision stage
• Sensor calibration verified with a precision
ring by the user on a daily basis
• Auto-calibration allows the user to adjust
calibration for optimal accuracy
Calibration
Precision Factory Calibration
Calculated
4th
order
coefficient
Measured
sensor
linearity
Calibration
curve
Calibration
Stepped Calibration Ring
24
• Precision machined
• Mechanically measured at
third party NIST-certified
facility
• QC documentation provided
to customer
• Inner rings used to calibrate
the detector
Calibration Ring - 35mm
Sample Calibration Certification Sheet
25
Sensor Delivery System
Large Caliber
•LP-4210™
• Crawler • Scanner
• Guide Tube Adapter
• Calibration Ring
• Barrel
Clamp
Sensor Delivery System
Medium Caliber
LP-4210F™
• Data
Acquisition
• Motor Control
– Scanner
– Sensor
Delivery Unit
Sensor Delivery
Unit
•Drives the
Scanner
•Push-Pull
Scanner
• Centers the
Sensor
• Sensor
rotates about
Scanner
center axis
Guide Tube
Adapter
•Attaches to the
Weapon Barrel
•Also holds the
Calibration Ring
Connectors
LP-4210F™ Instrument
(Rear Panel)
Sensor
Connector
Motor
Connector
Sensor Delivery Unit
Scanning Assembly
Guide Tube Adapter
Sensor Delivery System (Rigid)
Medium Calibers
LP-4210™ Instrument
Sensor Delivery Unit
Sensor
Guide Tube Adapter
Sensor Delivery System
Small Caliber
Small Caliber Delivery Stages (5.56mm – 9mm) Close-up View of Sensor
LP-4210™ Data Acquisition and
Control Unit (DAC) with
Motor Control Unit (MCU)
• For use in Shop or Lab Conditions
• Integrated Computer/Laser Sensor
• External Motor Control Unit
• Ethernet and USB data transfer
• LaserViewer™ Software
- Custom-configurable operator interface
- Auto calibration
• High-speed data acquisition
LP-4210™ Data Acquisition and
Control Unit (DAC)
LP-4210F™ Data Acquisition and
Control Unit (DAC)
• For Use in Demanding Environments
– Shock-mounted instrument chassis
– Ruggedized Case
• Integrated Computer/Laser Sensor and
Motor Control Unit
• Ethernet and USB data transfer
• LaserViewer™ Software
- Custom-configurable operator interface
- Auto calibration
• High-speed data acquisition
LP-4210F™ Data Acquisition and
Control Unit (DAC)
• LaserViewer™ Inspection
• Installed on LP-4210™ / LP-4210F™ Data Acquisition Instrument
• Easily adapted to customer needs
• Designed for Capturing Scan Data and Initial Analysis
• LaserViewer™ Analysis
• Installed on a PC
• Designed to Conduct Detailed Analysis of Scan Data
• Modules Available for Specific Reporting Criteria
• LaserViewer 3D™
• Installed on a PC
• Three-Dimensional Visualization and Analysis Software
• Bore Erosion Report Generator
• Installed on a PC
• Standard Reporting for Gun Bore Land and Groove Dimensions
• Advanced Reporting for Twist rate, Groove Width, Runout
LTC’s Laser-based Inspection Commercial Software SuiteLTC’s Laser-based Inspection Commercial Software Suite
LaserViewer™ System Setup Tab
LaserViewer™ System Calibration
• Daily Calibration Provides
Operator Indications System
is Performing
• Automatic Sequence
• Adjustable to Specific
Tolerances
Scan Parameters
Rotary Speed: 1-300 RPM
Scan Length: Up to the
length of the barrel
Linear Resolution: How
often measurements are
taken
Other Parameters and
Performance Data are
calculated automatically
This example will scan a
2cm section of tube, at
300 RPM every .1mm
Saving Data
• Save functions allow the user to
save scan data after it has been
processed.
• When saving processed data,
only the processed subset is
saved.
• Processed data files are smaller
than unprocessed files.
• Processed data files are
required for generating reports
(if available).
Data Analysis
• The Data tab displays
saved data
– Processors can be
applied to the data
– Can display:
• Profile Data
• LVI (LaserVideo™)
Data
• The Cross-Section tab
shows
– Cross-section plot
– Profile data
Data Type Selector
Color Plot
The colors of the plot represent radii, and can be set
by the color palette in the upper left side of the
screen.
Applying Processors to a Scan Data File
Rotate Data Processor
Rotating the data allows the user to change the location of unique
features in order to compare scans at different rotary orientations.
Initial Data Rotate Data applied
Remove Centering Offset Processor
• In rotary systems, the data may show a sinusoidal offset along the
rotary axis, with the maximum and minimum separated by 180
degrees. This is caused by centering offset.
• The Remove Centering Offset processor adjusts the data centering
on a line-by-line basis.
• Useful for correcting variable centering errors throughout the scan.
Remove Centering Offset
applied
Initial Data
Viewing Data
• Area/Diameter Statistics
– Statistics on a particular region of data on the Data
tab may be calculated from the Statistics window.
• Data Values and Making Point-to-Point
Measurements
• Cross-Sectional Auxiliary Windows
• Display Annotations
• Change the Color Palette
Processed Data – 155mm Gun Tube
Cross Section – 155mm Gun Tube
• The Cross Section tab displays a scaled two-dimensional
cross-section of the scan data.
LaserViewer 3D™ Visualization and
Analysis Software
Bore Analysis Report Generator
Report Generator - Tabular Summary
Report Generator - Graphical Summary
BEMIS™ is used throughout the DoD
and Defense Community
• Yuma Proving
Grounds
• Aberdeen Proving
Grounds
• NSWC Dahlgren
• Watervliet Arsenal
• Benet Labs
• USMC Log Base
Barstow
• Army Research Lab
• BAE Systems
• ATK
• KMW
• Dynamic Flowform
• General Atomics
• Foreign Militaries
Questions?

LTC Laser Profilometry

  • 1.
    Laser Profilometry Revolutionizing GunTube Inspections BEMIS™ - Bore Erosion Measurement and Inspection System Laser-based Inspections for 5.56mm to 155mm Weapon Bores DefenseSystems GroupDefenseSystems Group Mr. DanielBonnizzio, DirectorMr. DanielBonnizzio, Director
  • 2.
    Laser Techniques CompanyMissionLaser Techniques Company Mission:: ““To provide our customers with laser-basedTo provide our customers with laser-based solutions to challenging measurement and inspectionsolutions to challenging measurement and inspection applicationsapplications......
  • 3.
    ……to help ensurethe safe operation and to extend theto help ensure the safe operation and to extend the useful life of high-value and safety-criticaluseful life of high-value and safety-critical components.”components.”
  • 4.
    LTC’s laser-based inspectionLTC’slaser-based inspection technologytechnology • Industry leader in high- performance laser-based measurement and inspection systems • Over 20 years experience in development of systems for military and commercial applications • Systems employ standard architecture and “off-the- shelf” components 3D Image Segment of 155mm Gun Tub
  • 5.
  • 6.
    Inspection Technology Mechanical orAir Gauges and the Mark-1 Eyeball
  • 7.
  • 8.
    Laser Profilometry Revolutionizes theInspection Process • Quantitative and Transportable Data • 3-Dimensional Data Cloud • Graphic Visualization of Data • Detailed and Customizable Reporting
  • 9.
    Introduction to LaserProfilometry • Non-contact point measurement method • Sensor acts as a “laser caliper” • Produces a 3D map of the target surface • Inspection results displayed in 2D or 3D format. BEMIS-LC™ Large Caliber Sensor Scanning 155mm Gun Tube
  • 10.
    Laser Profilometry Typical Applications •Detection and measurement of erosion, pitting, and corrosion • Tube diameter and ovality measurements • Dent measurement and inner surface imaging 3D Image Segment of 5.56mm Rifle Barre
  • 11.
    Benefits of LaserProfilometry • Rapid, automated, non- contact measurement • Quantitative 3-D imaging • Removes Operator Subjectivity • May be integrated with other sensors – eddy current, ultrasound Quantitative 3D analysis of Origin of Rifling Erosion
  • 12.
    Limitations of LaserProfilometry • Maps surface only; subsurface features can not be detected • Target surface must be clean and dry • Sharp features may cause shadows – loss of data • Specular (mirror-like) surfaces reflect light and require dedicated sensors
  • 13.
    Introduction to Lasers •LTC primarily uses diode lasers • Diode laser features – Small package size – Low power draw – Long lifetimes – Available wavelengths: 400 nm – over 1000 nm – Available laser power: 3 mW – over 30 mW • For LP applications, LTC typically uses 650- 670 nm lasers, with maximum output <5 mW
  • 14.
    SmartLaserTM • This systemis equipped with SmartLaserTM laser safety mode. • When the sensor does not detect a surface in its measuring range, the laser pulses at a low average power at a rate of 10 Hz until a surface is detected. • The SmartLaser™ mode is automatically set to the ON position by the software.
  • 15.
    Introduction Point Sensor Measurement Laserbeam Test article (shown transparent) Scattered light Sensor Receiving Aperture
  • 16.
    Introduction to LaserProfilometry Helical scanning Laser beam path on tube surface The sensor head rotates as it traverses down the tube
  • 17.
    Introduction to LaserProfilometry 2D and 3D Data Display “Flat” display in LaserViewer™ “Wrapped” display in LaserViewer3D™
  • 18.
    Laser Sensor Design OperatingRangeStand off Diode Laser Module Focusing Lens Beam Waist (Minimum laser beam radius) (Useful laser beam radius)
  • 19.
    IMAGED SPOT IMAGING LENS TARGETSURFACE OBJECT SPOT MEASURING RANGE FOCUSING LENS DIODE LASER PHOTODETECTOR Laser Point Triangulation
  • 20.
    LAND GROOVE LAND LaserPoint Triangulation Laser Beam Measurement Points
  • 21.
    Introduction to LaserProfilometry Profile Data and LaserVideo™ Image generated simultaneously LaserVideo ™ Laser Profilometry
  • 22.
    Calibration • Factory-calibrated overthe full sensor range using a precision stage • Sensor calibration verified with a precision ring by the user on a daily basis • Auto-calibration allows the user to adjust calibration for optimal accuracy
  • 23.
  • 24.
    Calibration Stepped Calibration Ring 24 •Precision machined • Mechanically measured at third party NIST-certified facility • QC documentation provided to customer • Inner rings used to calibrate the detector Calibration Ring - 35mm
  • 25.
  • 26.
    Sensor Delivery System LargeCaliber •LP-4210™ • Crawler • Scanner • Guide Tube Adapter • Calibration Ring • Barrel Clamp
  • 27.
    Sensor Delivery System MediumCaliber LP-4210F™ • Data Acquisition • Motor Control – Scanner – Sensor Delivery Unit Sensor Delivery Unit •Drives the Scanner •Push-Pull Scanner • Centers the Sensor • Sensor rotates about Scanner center axis Guide Tube Adapter •Attaches to the Weapon Barrel •Also holds the Calibration Ring Connectors LP-4210F™ Instrument (Rear Panel) Sensor Connector Motor Connector Sensor Delivery Unit Scanning Assembly Guide Tube Adapter
  • 28.
    Sensor Delivery System(Rigid) Medium Calibers LP-4210™ Instrument Sensor Delivery Unit Sensor Guide Tube Adapter
  • 29.
    Sensor Delivery System SmallCaliber Small Caliber Delivery Stages (5.56mm – 9mm) Close-up View of Sensor
  • 30.
    LP-4210™ Data Acquisitionand Control Unit (DAC) with Motor Control Unit (MCU)
  • 31.
    • For usein Shop or Lab Conditions • Integrated Computer/Laser Sensor • External Motor Control Unit • Ethernet and USB data transfer • LaserViewer™ Software - Custom-configurable operator interface - Auto calibration • High-speed data acquisition LP-4210™ Data Acquisition and Control Unit (DAC)
  • 32.
    LP-4210F™ Data Acquisitionand Control Unit (DAC)
  • 33.
    • For Usein Demanding Environments – Shock-mounted instrument chassis – Ruggedized Case • Integrated Computer/Laser Sensor and Motor Control Unit • Ethernet and USB data transfer • LaserViewer™ Software - Custom-configurable operator interface - Auto calibration • High-speed data acquisition LP-4210F™ Data Acquisition and Control Unit (DAC)
  • 34.
    • LaserViewer™ Inspection •Installed on LP-4210™ / LP-4210F™ Data Acquisition Instrument • Easily adapted to customer needs • Designed for Capturing Scan Data and Initial Analysis • LaserViewer™ Analysis • Installed on a PC • Designed to Conduct Detailed Analysis of Scan Data • Modules Available for Specific Reporting Criteria • LaserViewer 3D™ • Installed on a PC • Three-Dimensional Visualization and Analysis Software • Bore Erosion Report Generator • Installed on a PC • Standard Reporting for Gun Bore Land and Groove Dimensions • Advanced Reporting for Twist rate, Groove Width, Runout LTC’s Laser-based Inspection Commercial Software SuiteLTC’s Laser-based Inspection Commercial Software Suite
  • 35.
  • 36.
    LaserViewer™ System Calibration •Daily Calibration Provides Operator Indications System is Performing • Automatic Sequence • Adjustable to Specific Tolerances
  • 37.
    Scan Parameters Rotary Speed:1-300 RPM Scan Length: Up to the length of the barrel Linear Resolution: How often measurements are taken Other Parameters and Performance Data are calculated automatically This example will scan a 2cm section of tube, at 300 RPM every .1mm
  • 38.
    Saving Data • Savefunctions allow the user to save scan data after it has been processed. • When saving processed data, only the processed subset is saved. • Processed data files are smaller than unprocessed files. • Processed data files are required for generating reports (if available).
  • 39.
    Data Analysis • TheData tab displays saved data – Processors can be applied to the data – Can display: • Profile Data • LVI (LaserVideo™) Data • The Cross-Section tab shows – Cross-section plot – Profile data Data Type Selector
  • 40.
    Color Plot The colorsof the plot represent radii, and can be set by the color palette in the upper left side of the screen.
  • 41.
    Applying Processors toa Scan Data File
  • 42.
    Rotate Data Processor Rotatingthe data allows the user to change the location of unique features in order to compare scans at different rotary orientations. Initial Data Rotate Data applied
  • 43.
    Remove Centering OffsetProcessor • In rotary systems, the data may show a sinusoidal offset along the rotary axis, with the maximum and minimum separated by 180 degrees. This is caused by centering offset. • The Remove Centering Offset processor adjusts the data centering on a line-by-line basis. • Useful for correcting variable centering errors throughout the scan. Remove Centering Offset applied Initial Data
  • 44.
    Viewing Data • Area/DiameterStatistics – Statistics on a particular region of data on the Data tab may be calculated from the Statistics window. • Data Values and Making Point-to-Point Measurements • Cross-Sectional Auxiliary Windows • Display Annotations • Change the Color Palette
  • 45.
    Processed Data –155mm Gun Tube
  • 46.
    Cross Section –155mm Gun Tube • The Cross Section tab displays a scaled two-dimensional cross-section of the scan data.
  • 47.
    LaserViewer 3D™ Visualizationand Analysis Software
  • 48.
  • 49.
    Report Generator -Tabular Summary
  • 50.
    Report Generator -Graphical Summary
  • 51.
    BEMIS™ is usedthroughout the DoD and Defense Community • Yuma Proving Grounds • Aberdeen Proving Grounds • NSWC Dahlgren • Watervliet Arsenal • Benet Labs • USMC Log Base Barstow • Army Research Lab • BAE Systems • ATK • KMW • Dynamic Flowform • General Atomics • Foreign Militaries
  • 52.

Editor's Notes

  • #10 See manual p. 8 (Introduction) and LTC website (www.laser-ndt.com) for more information
  • #11 See LTC website (www.laser-ndt.com) for application examples
  • #12 See manual pp. 8-14 (Introduction) and LTC website (www.laser-ndt.com) for more information
  • #13 See manual pp. 8-14 (Introduction) and LTC website (www.laser-ndt.com) for more information
  • #14 (not in manual)
  • #19 (not in manual)