Download to read offline


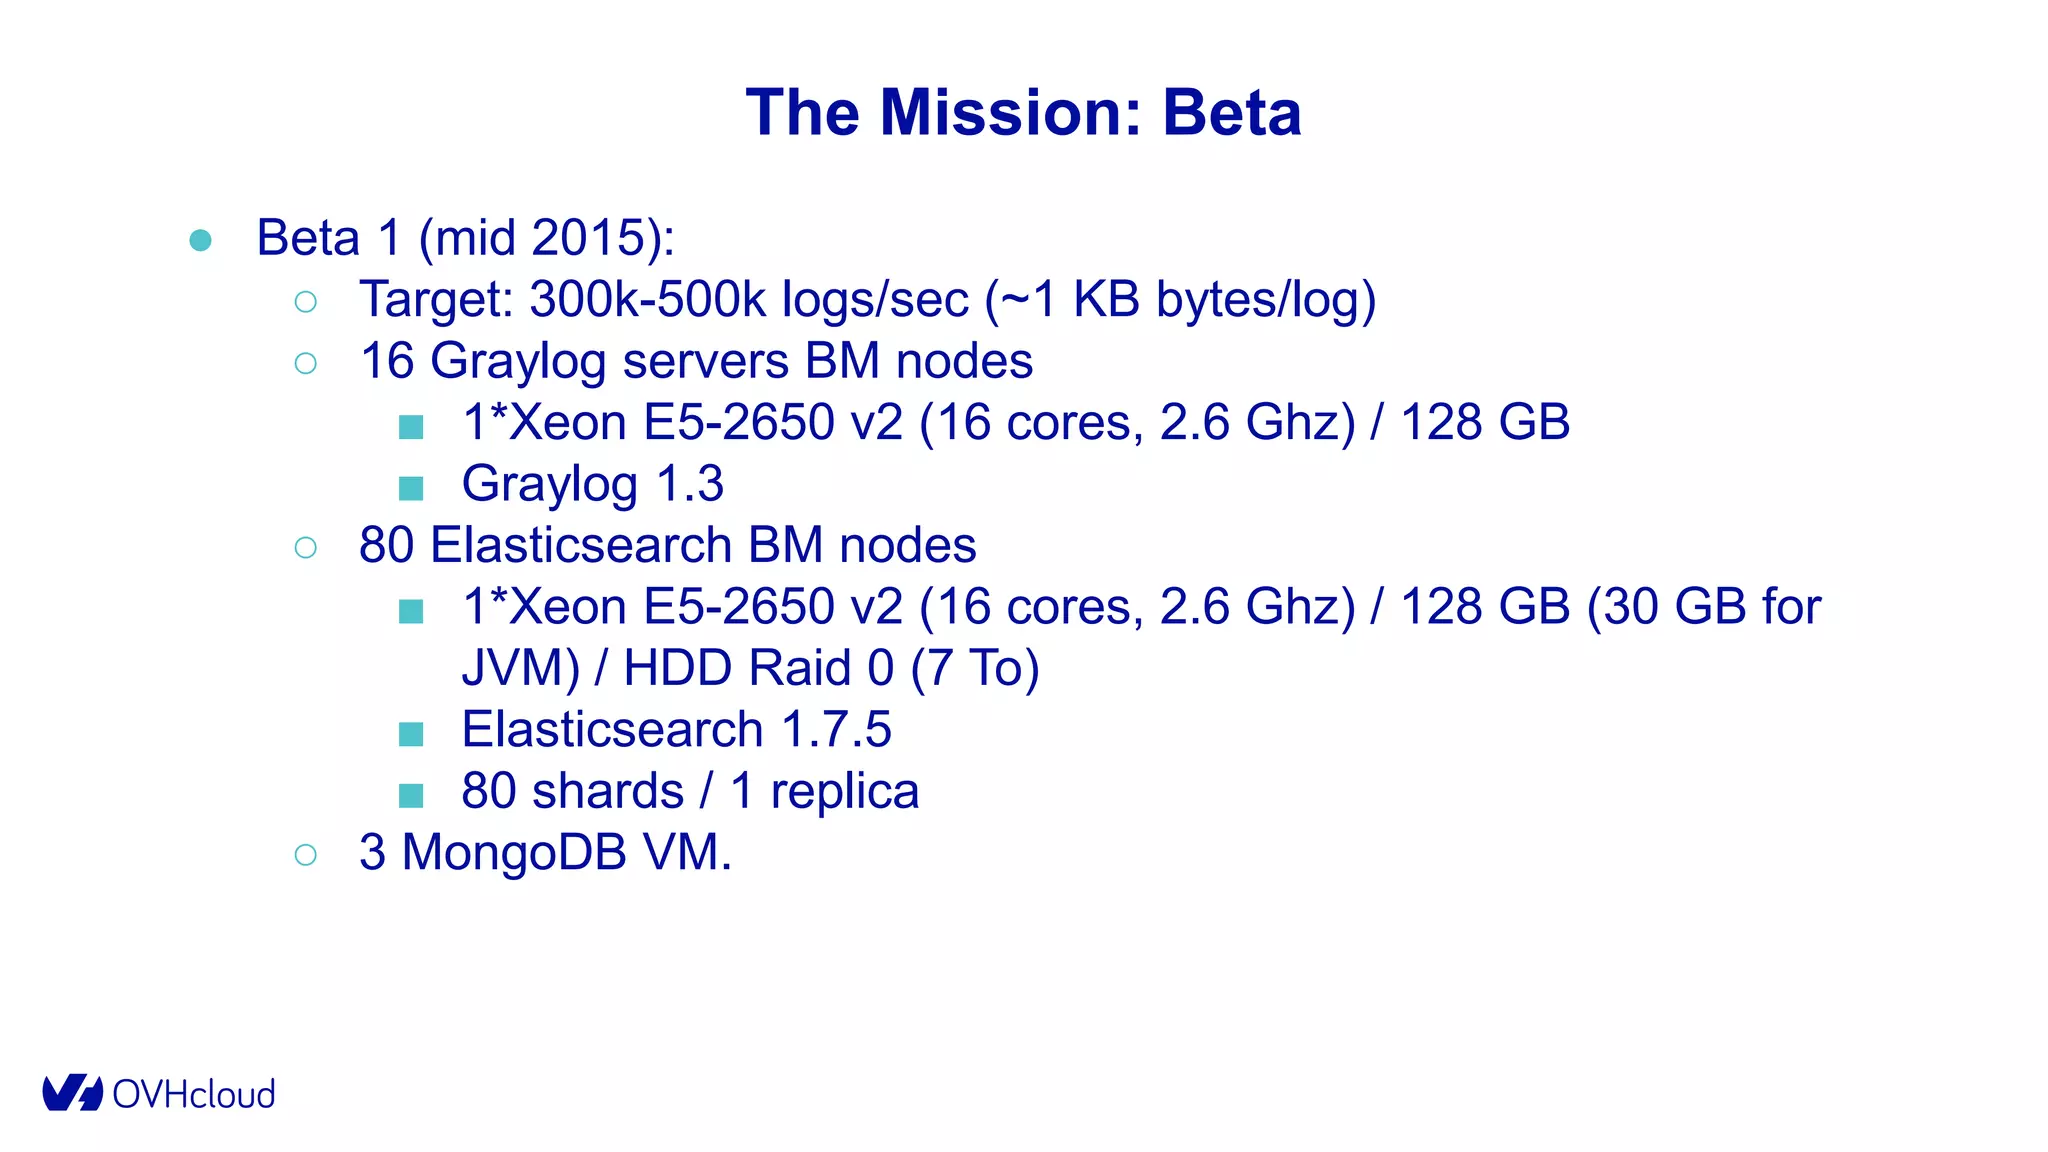


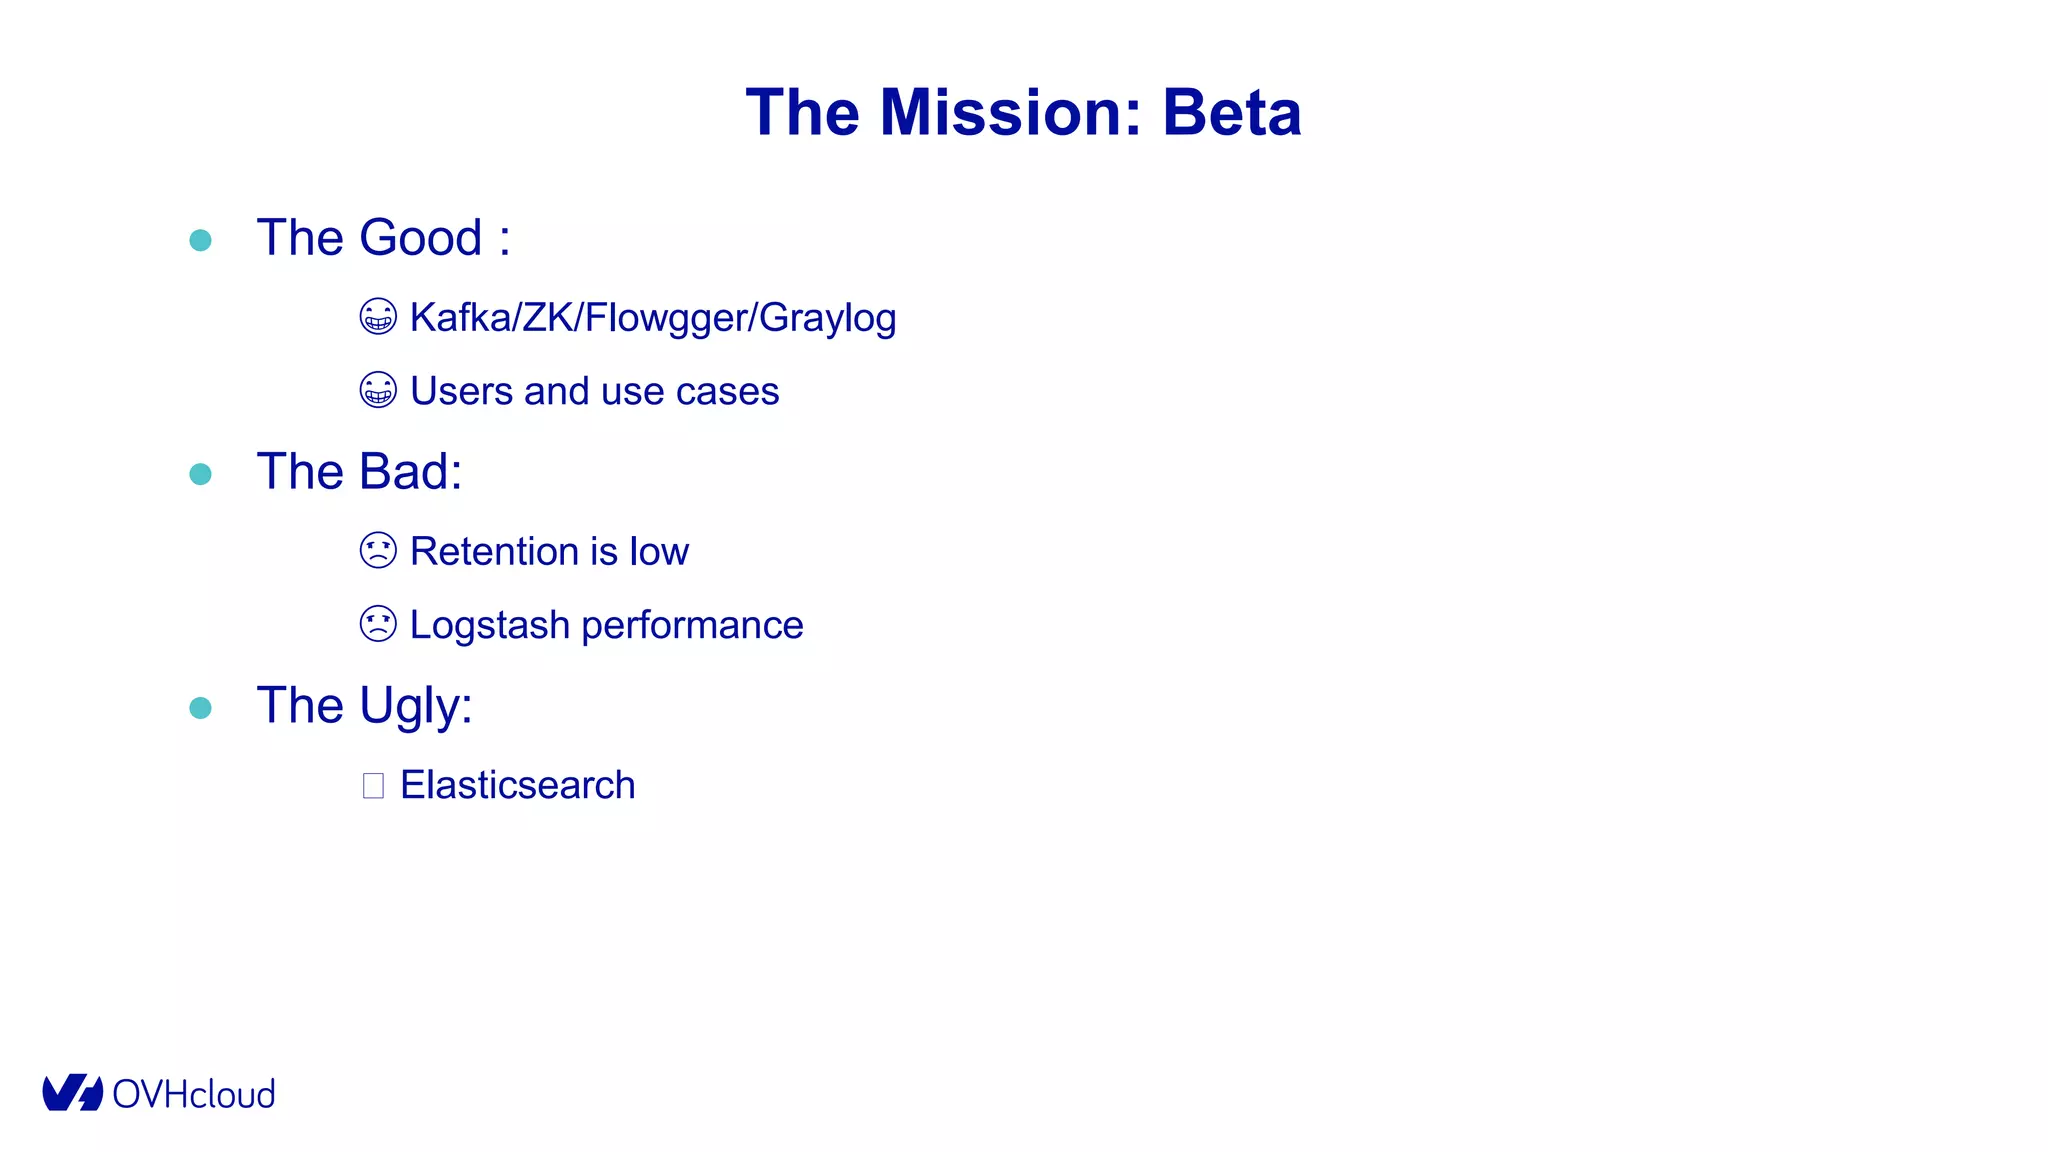

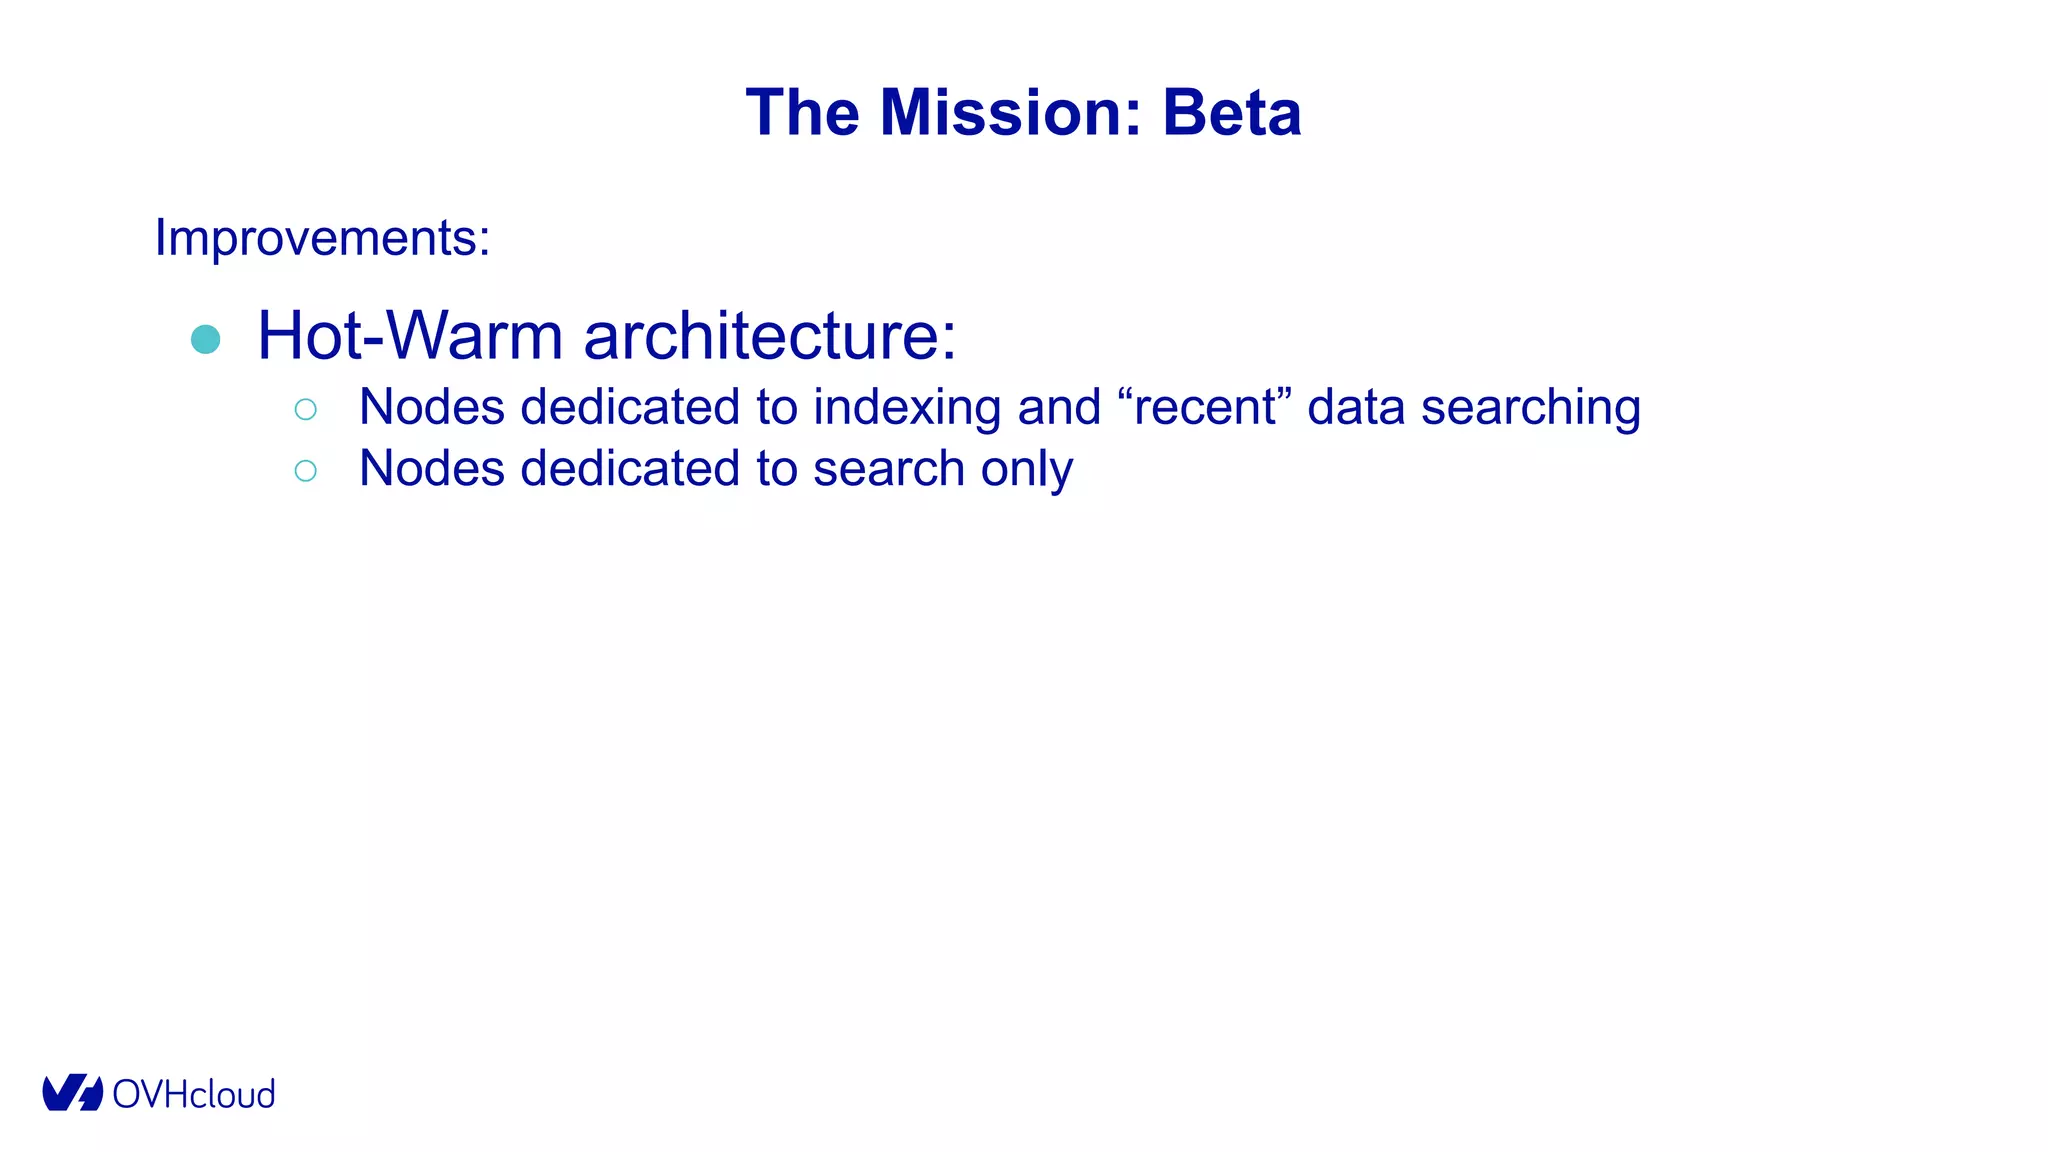


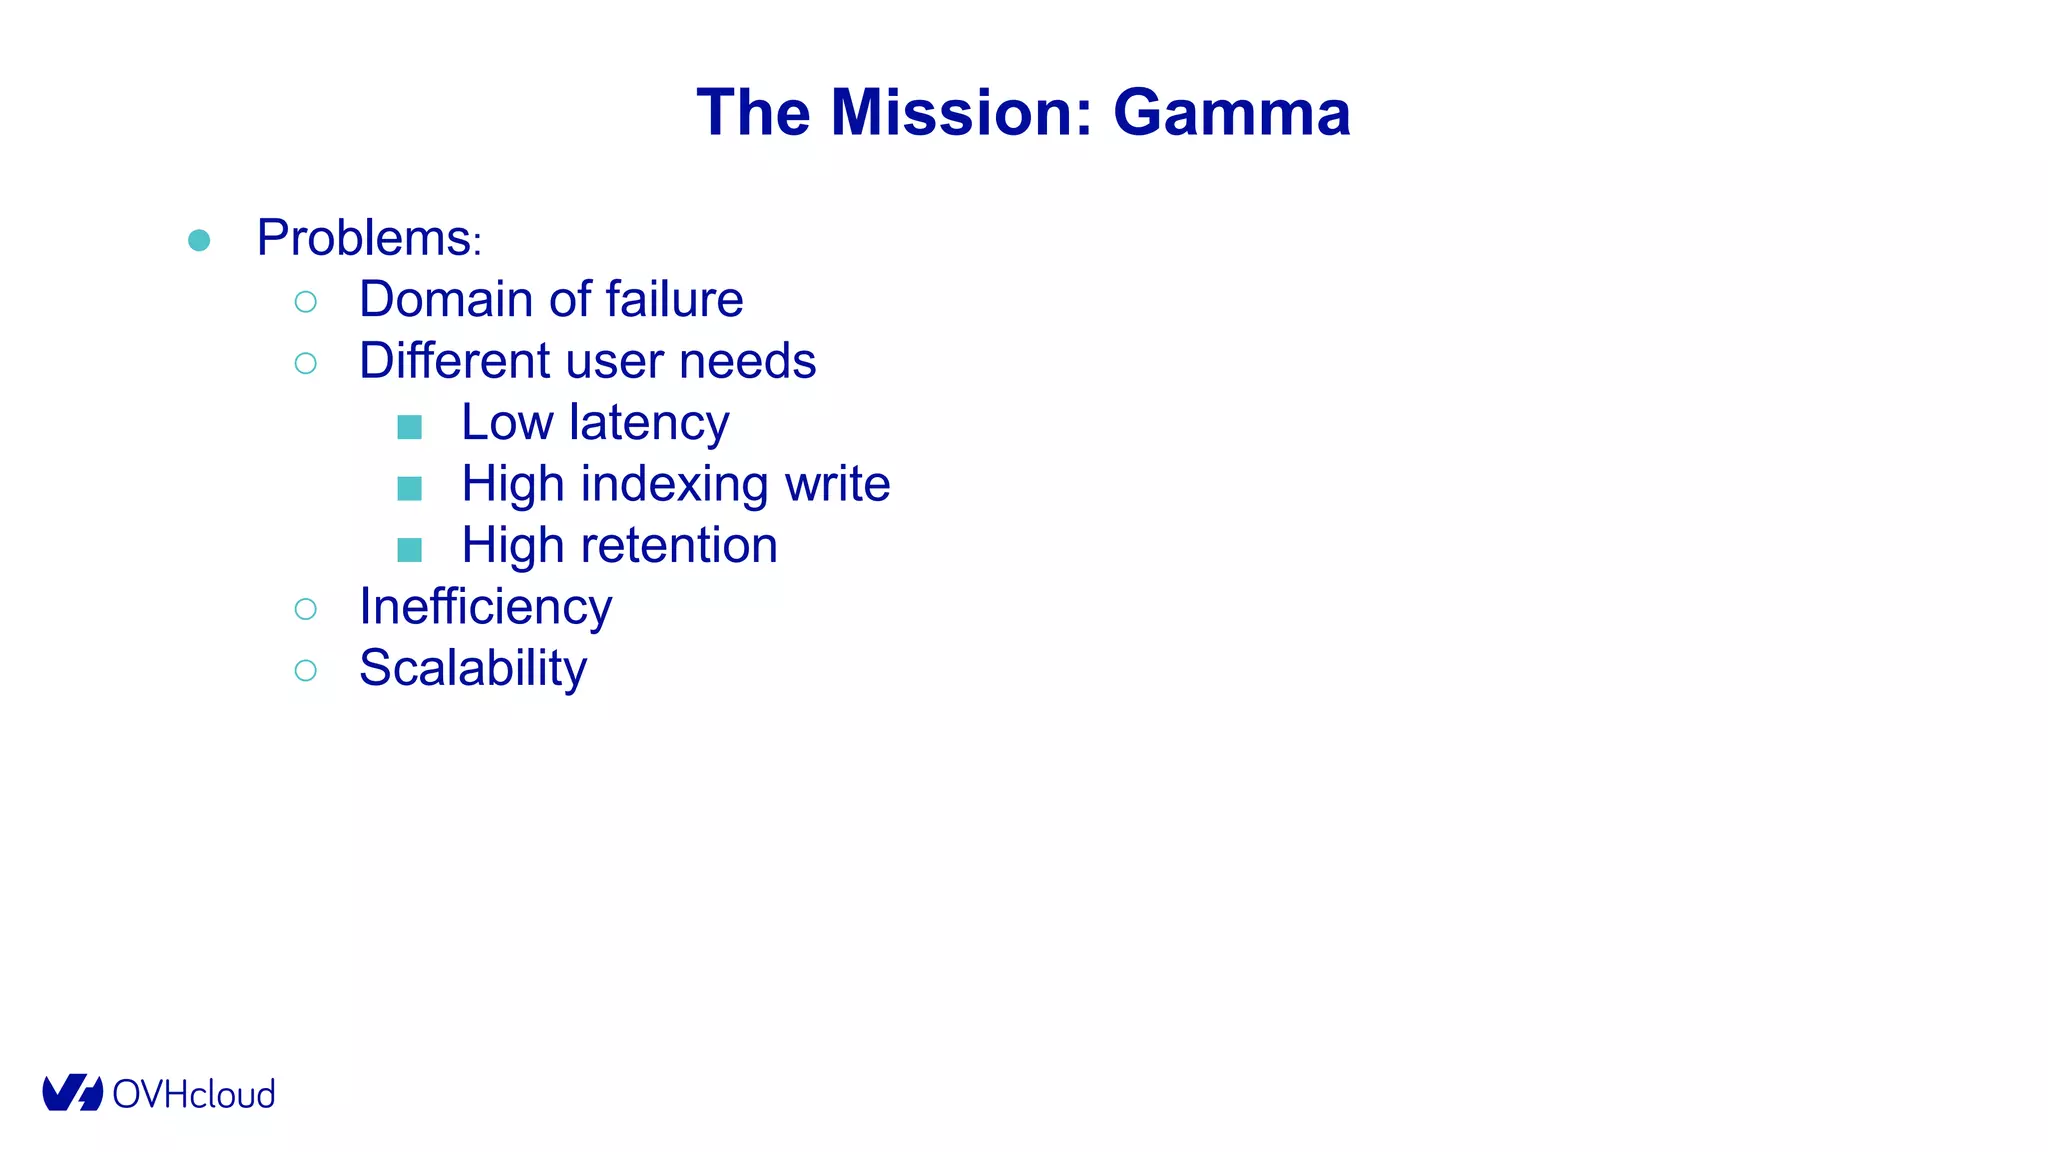
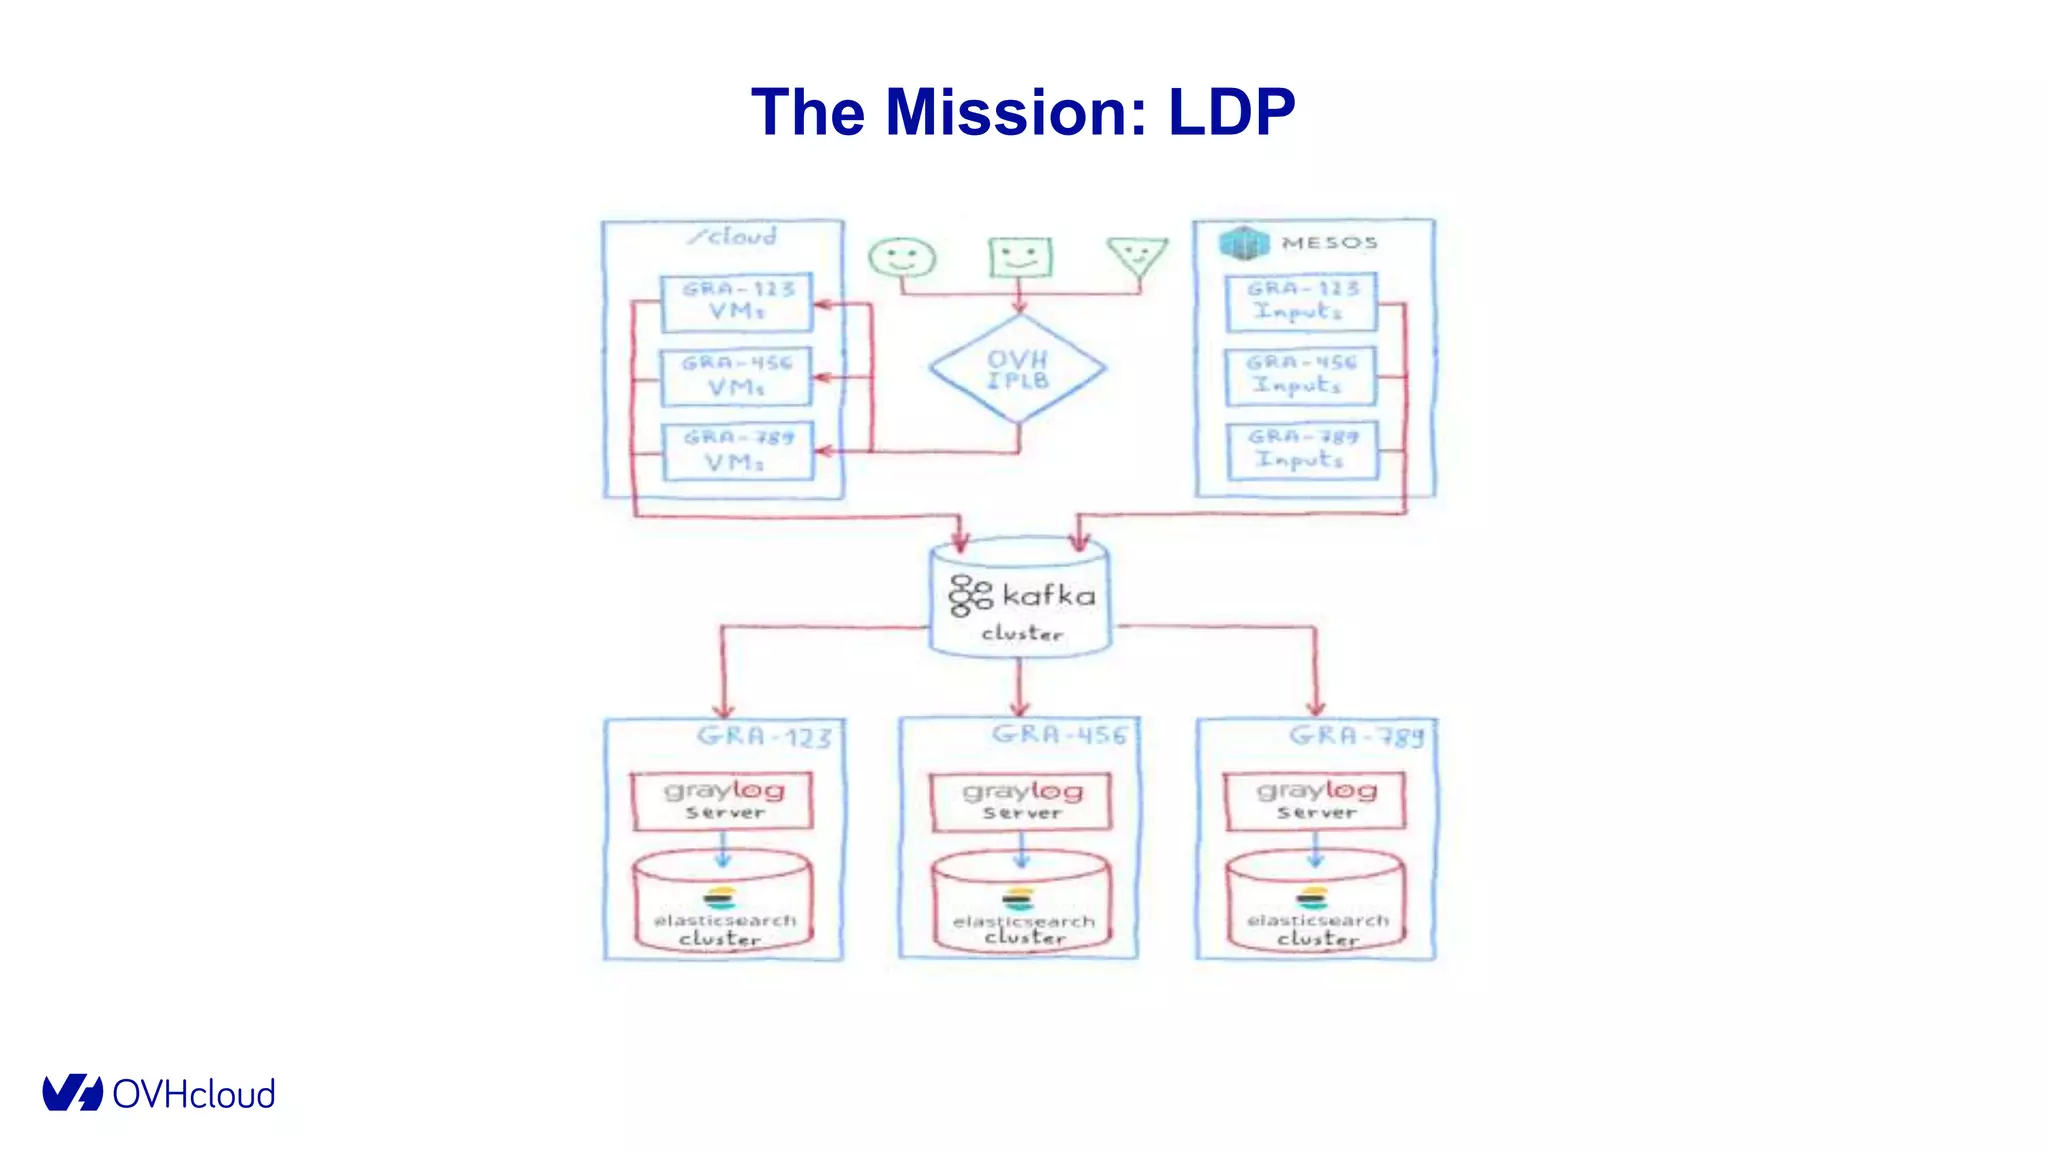

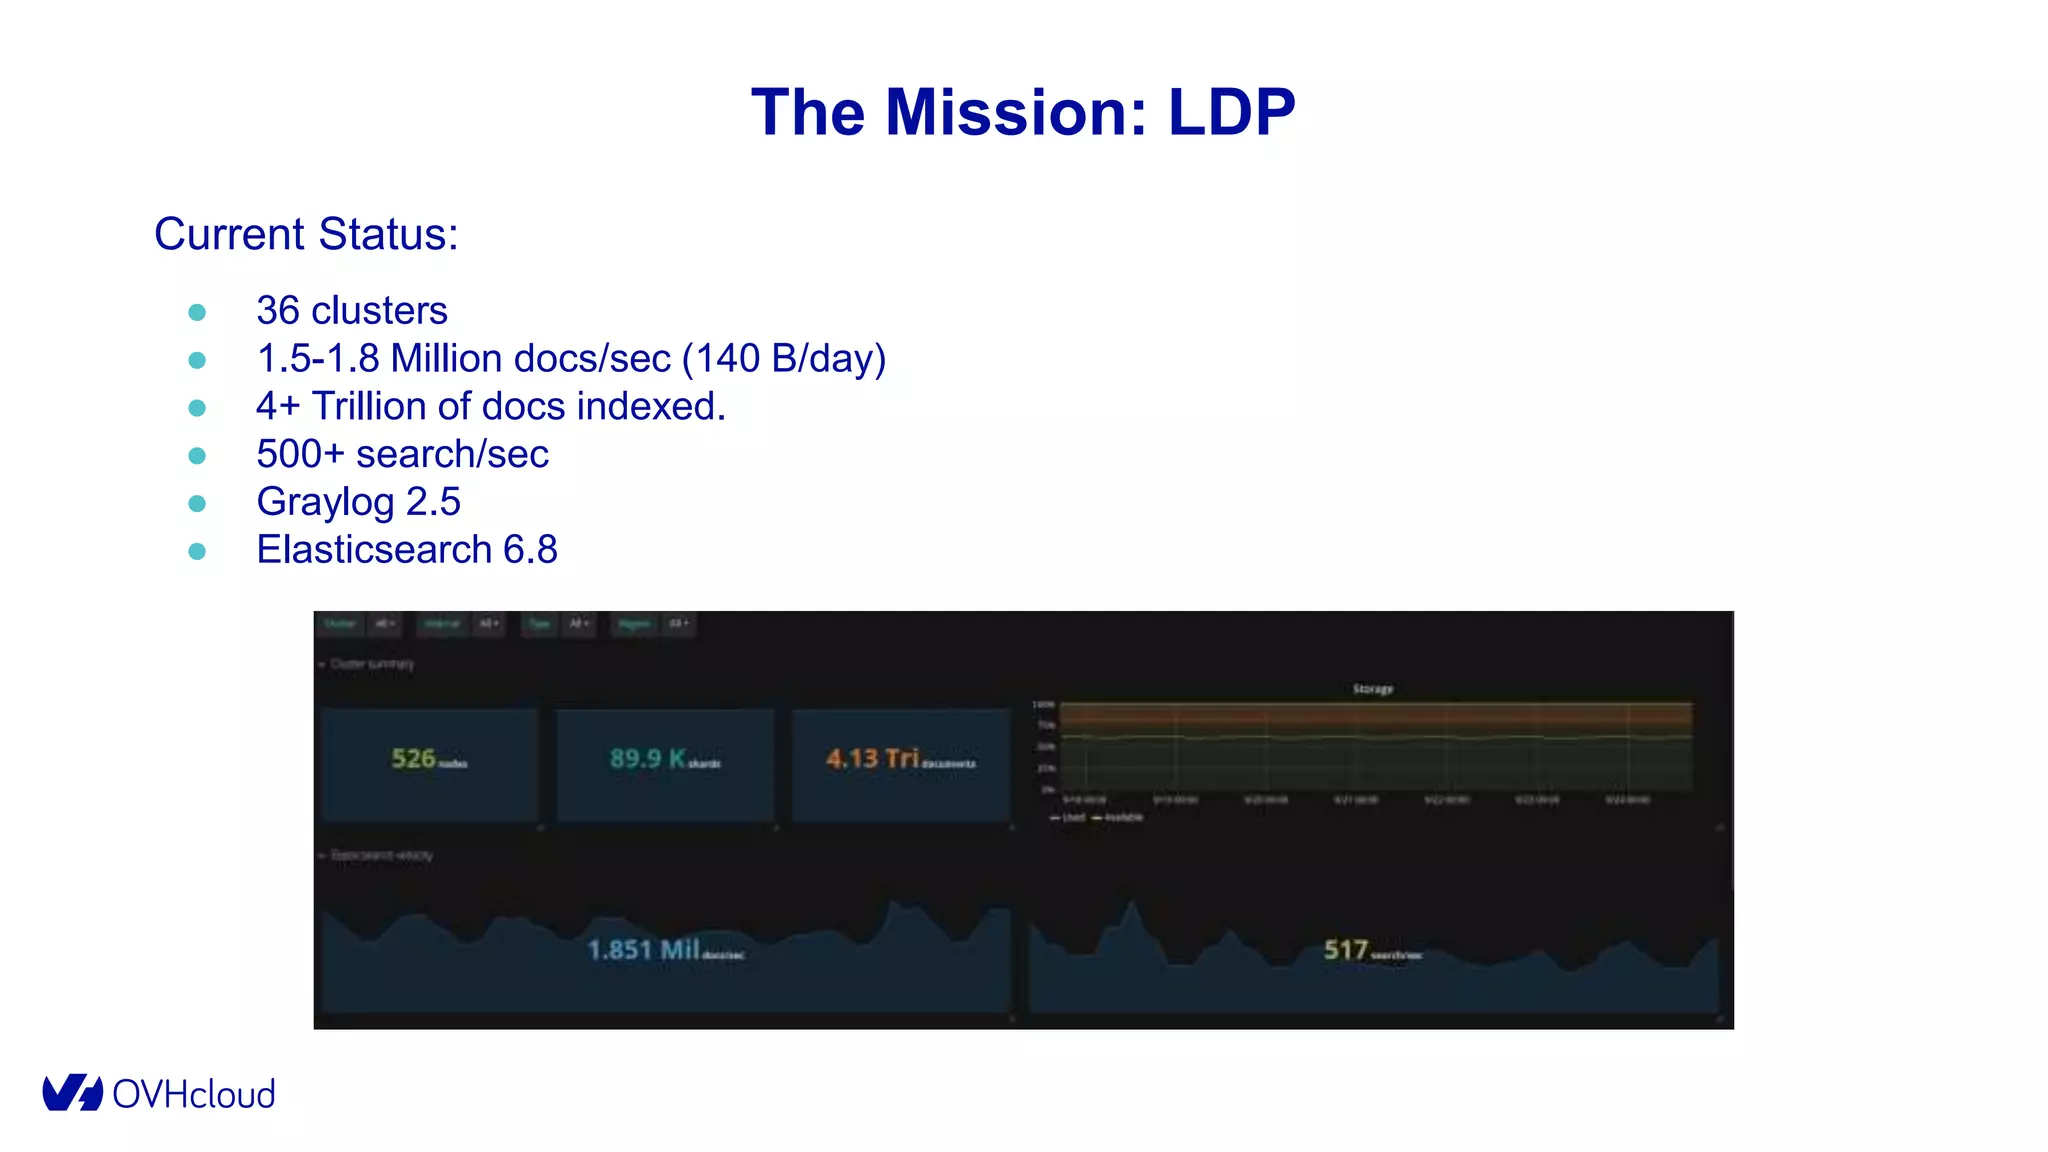


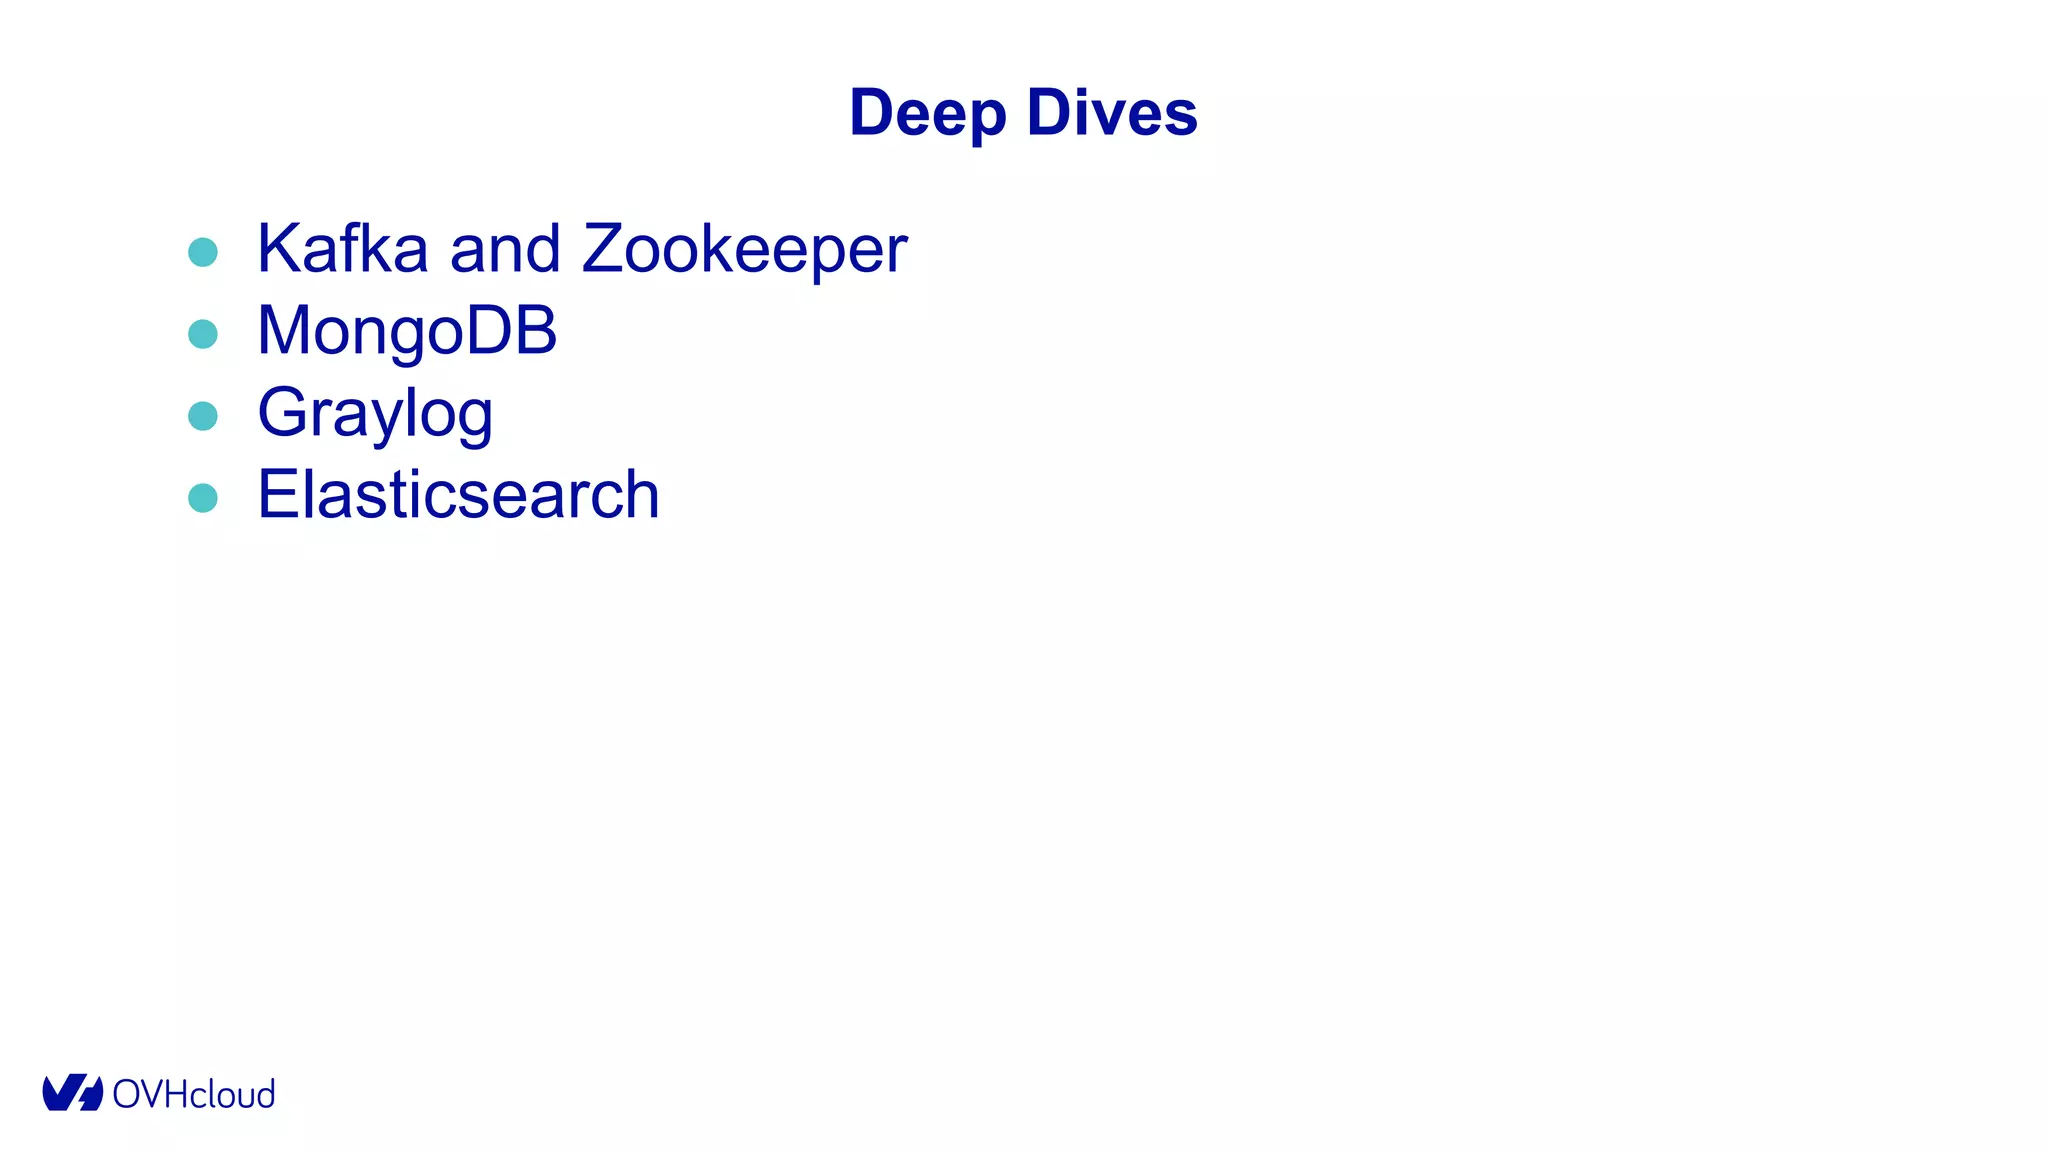


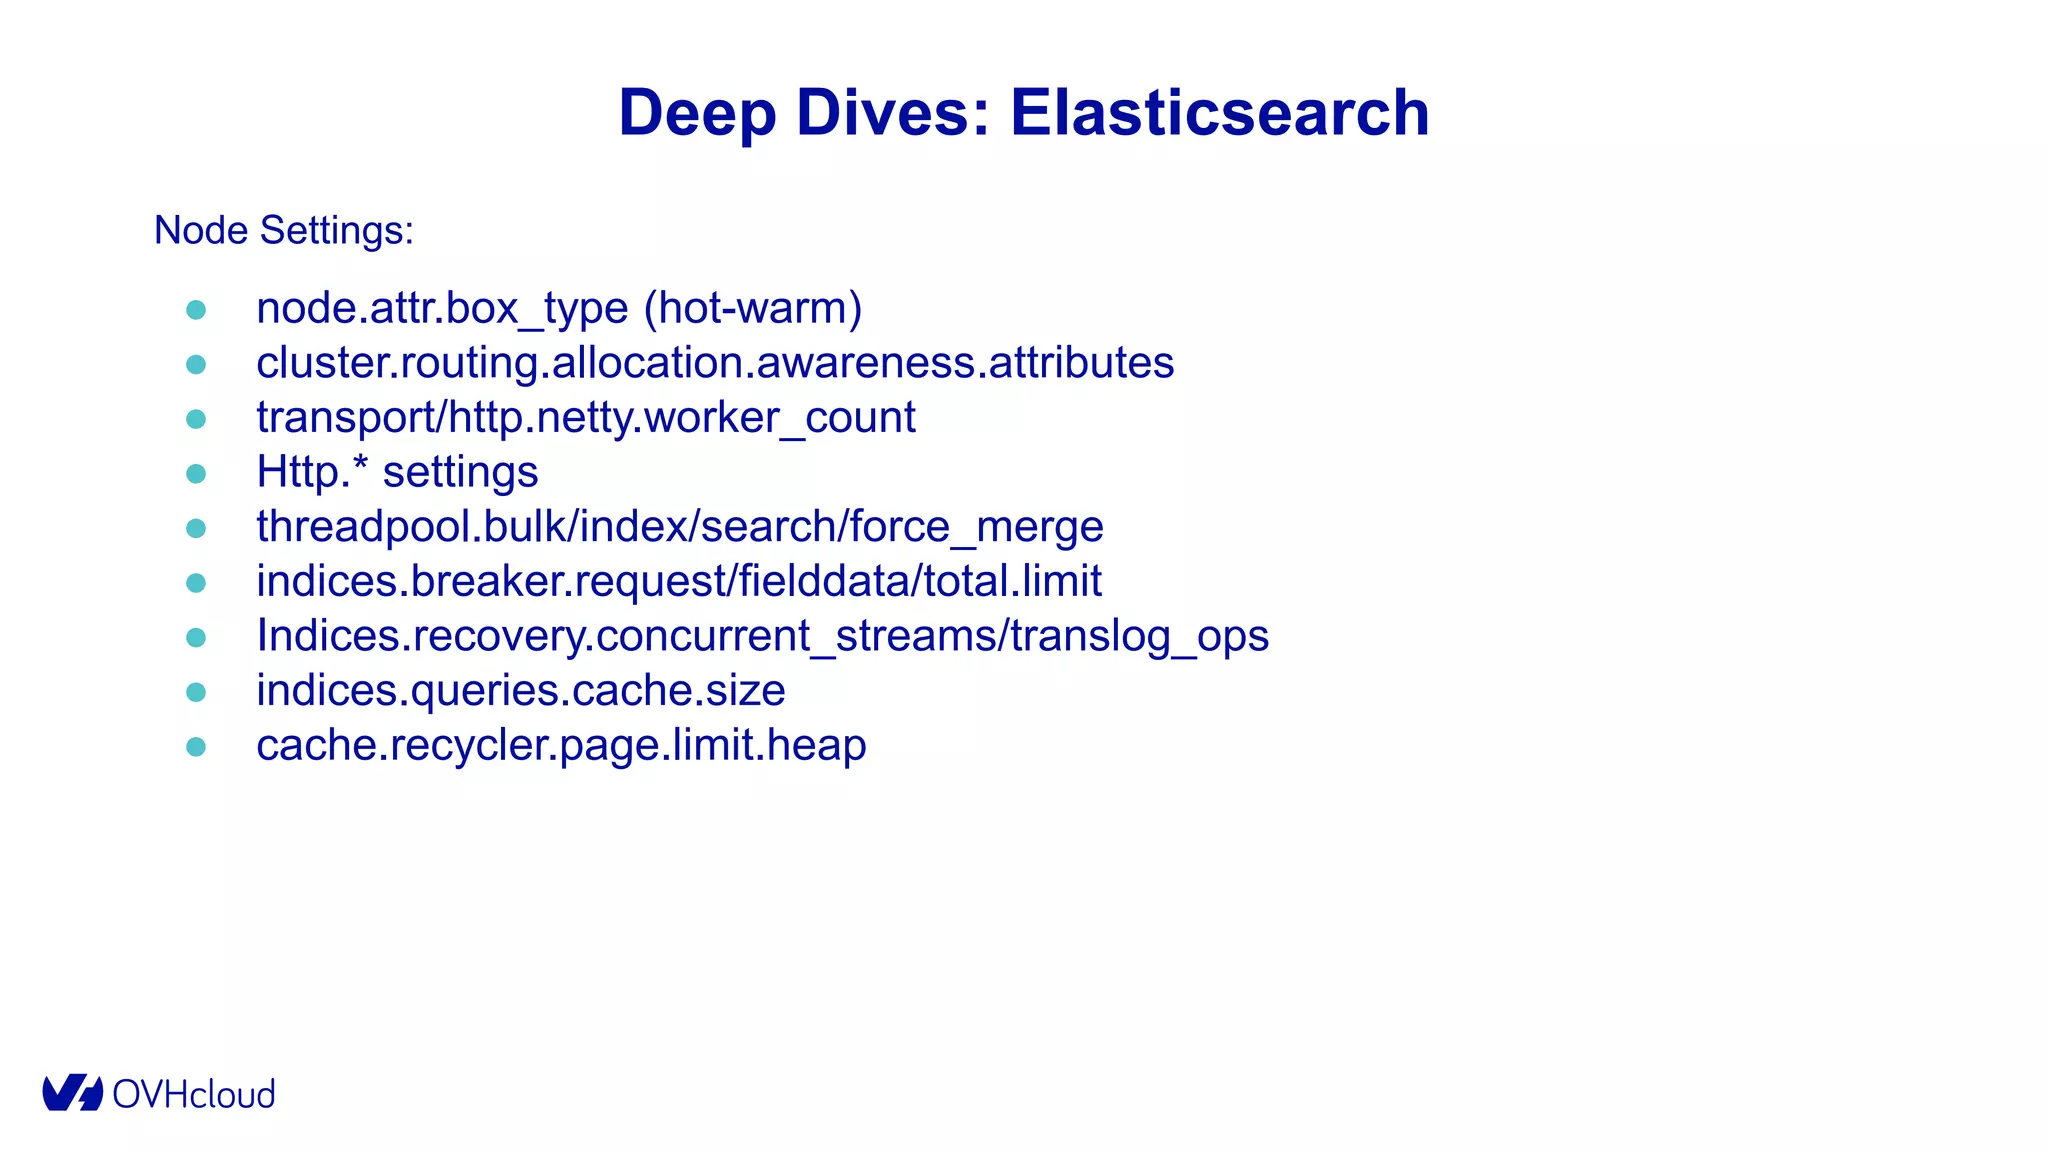

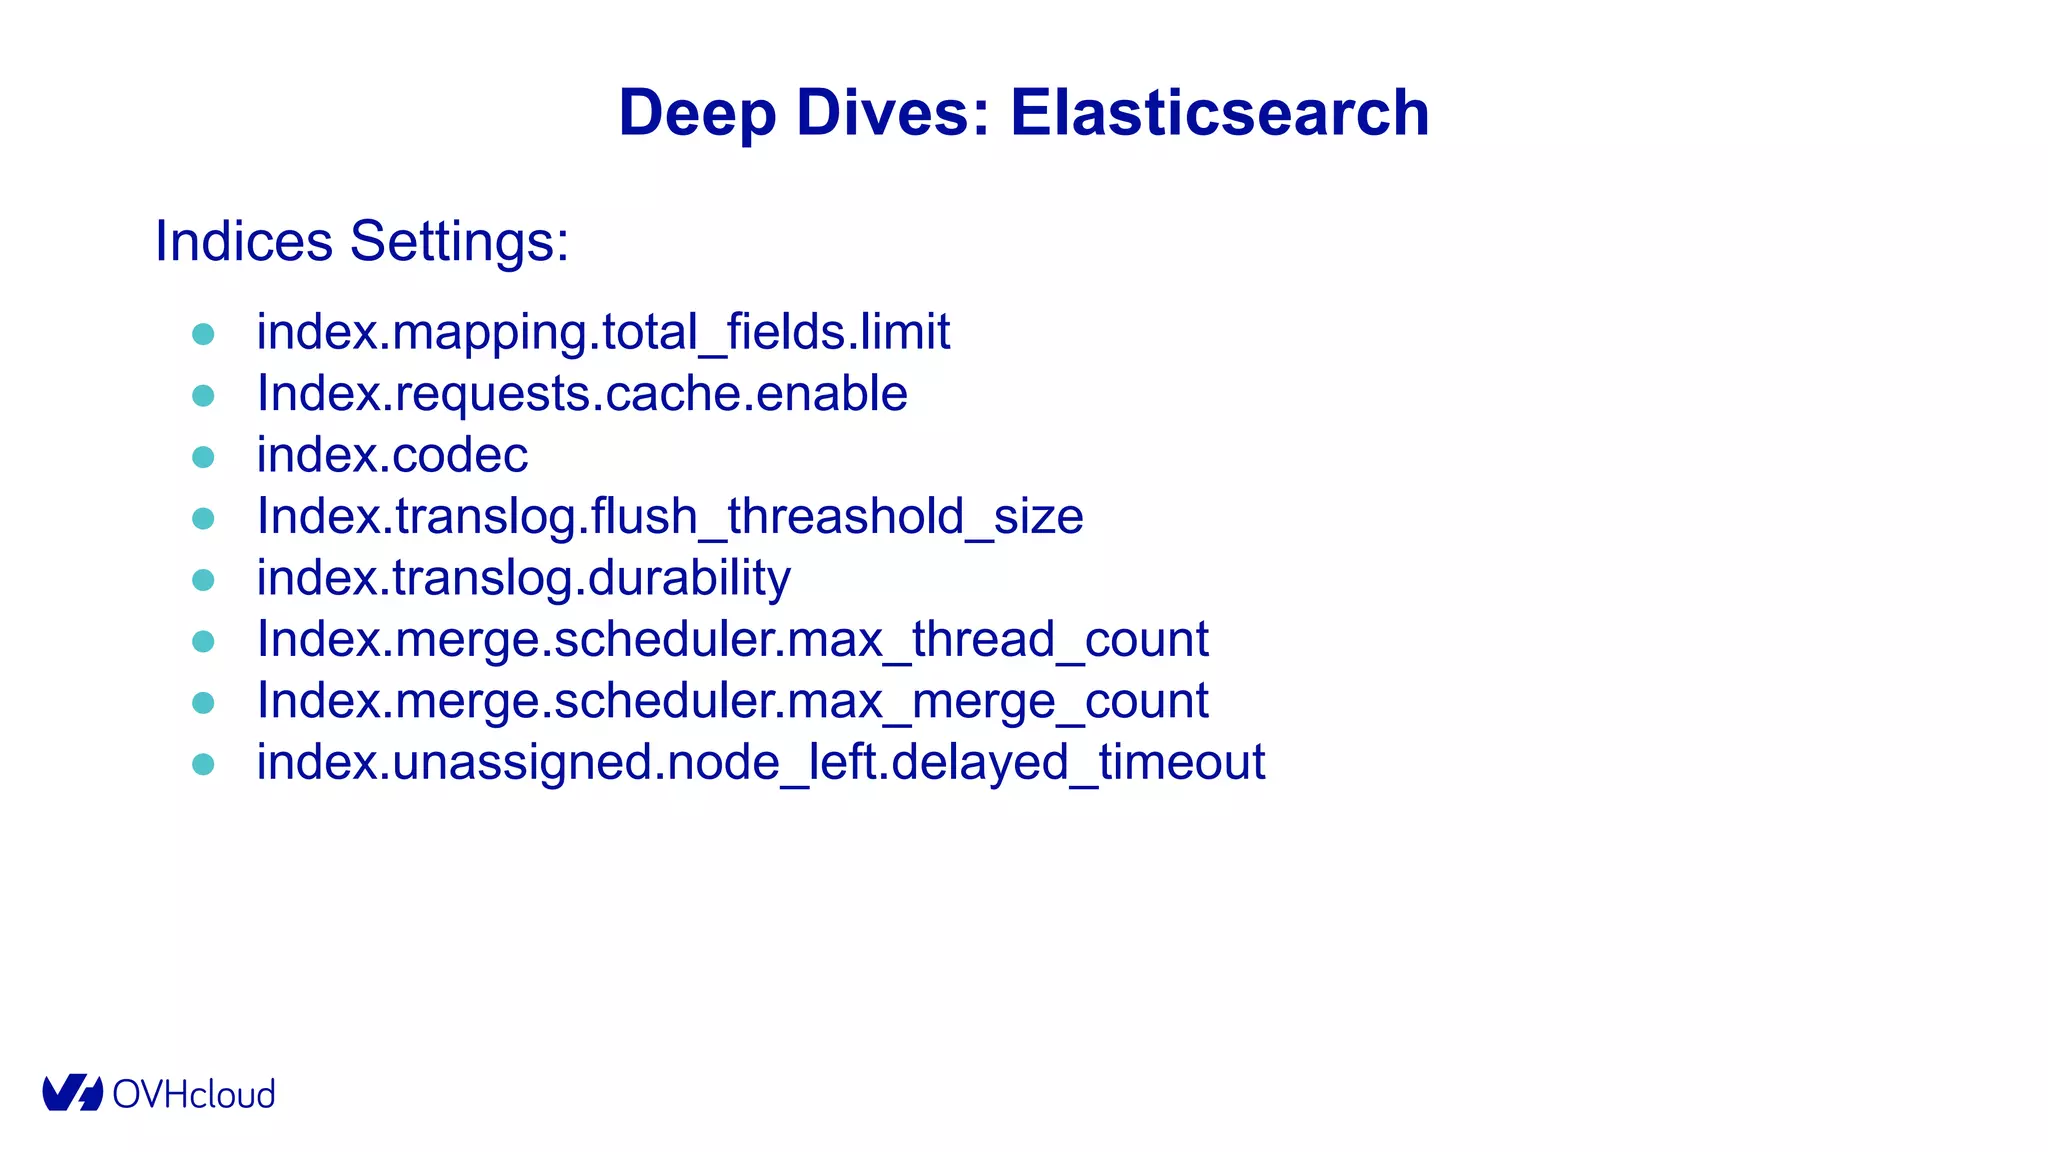
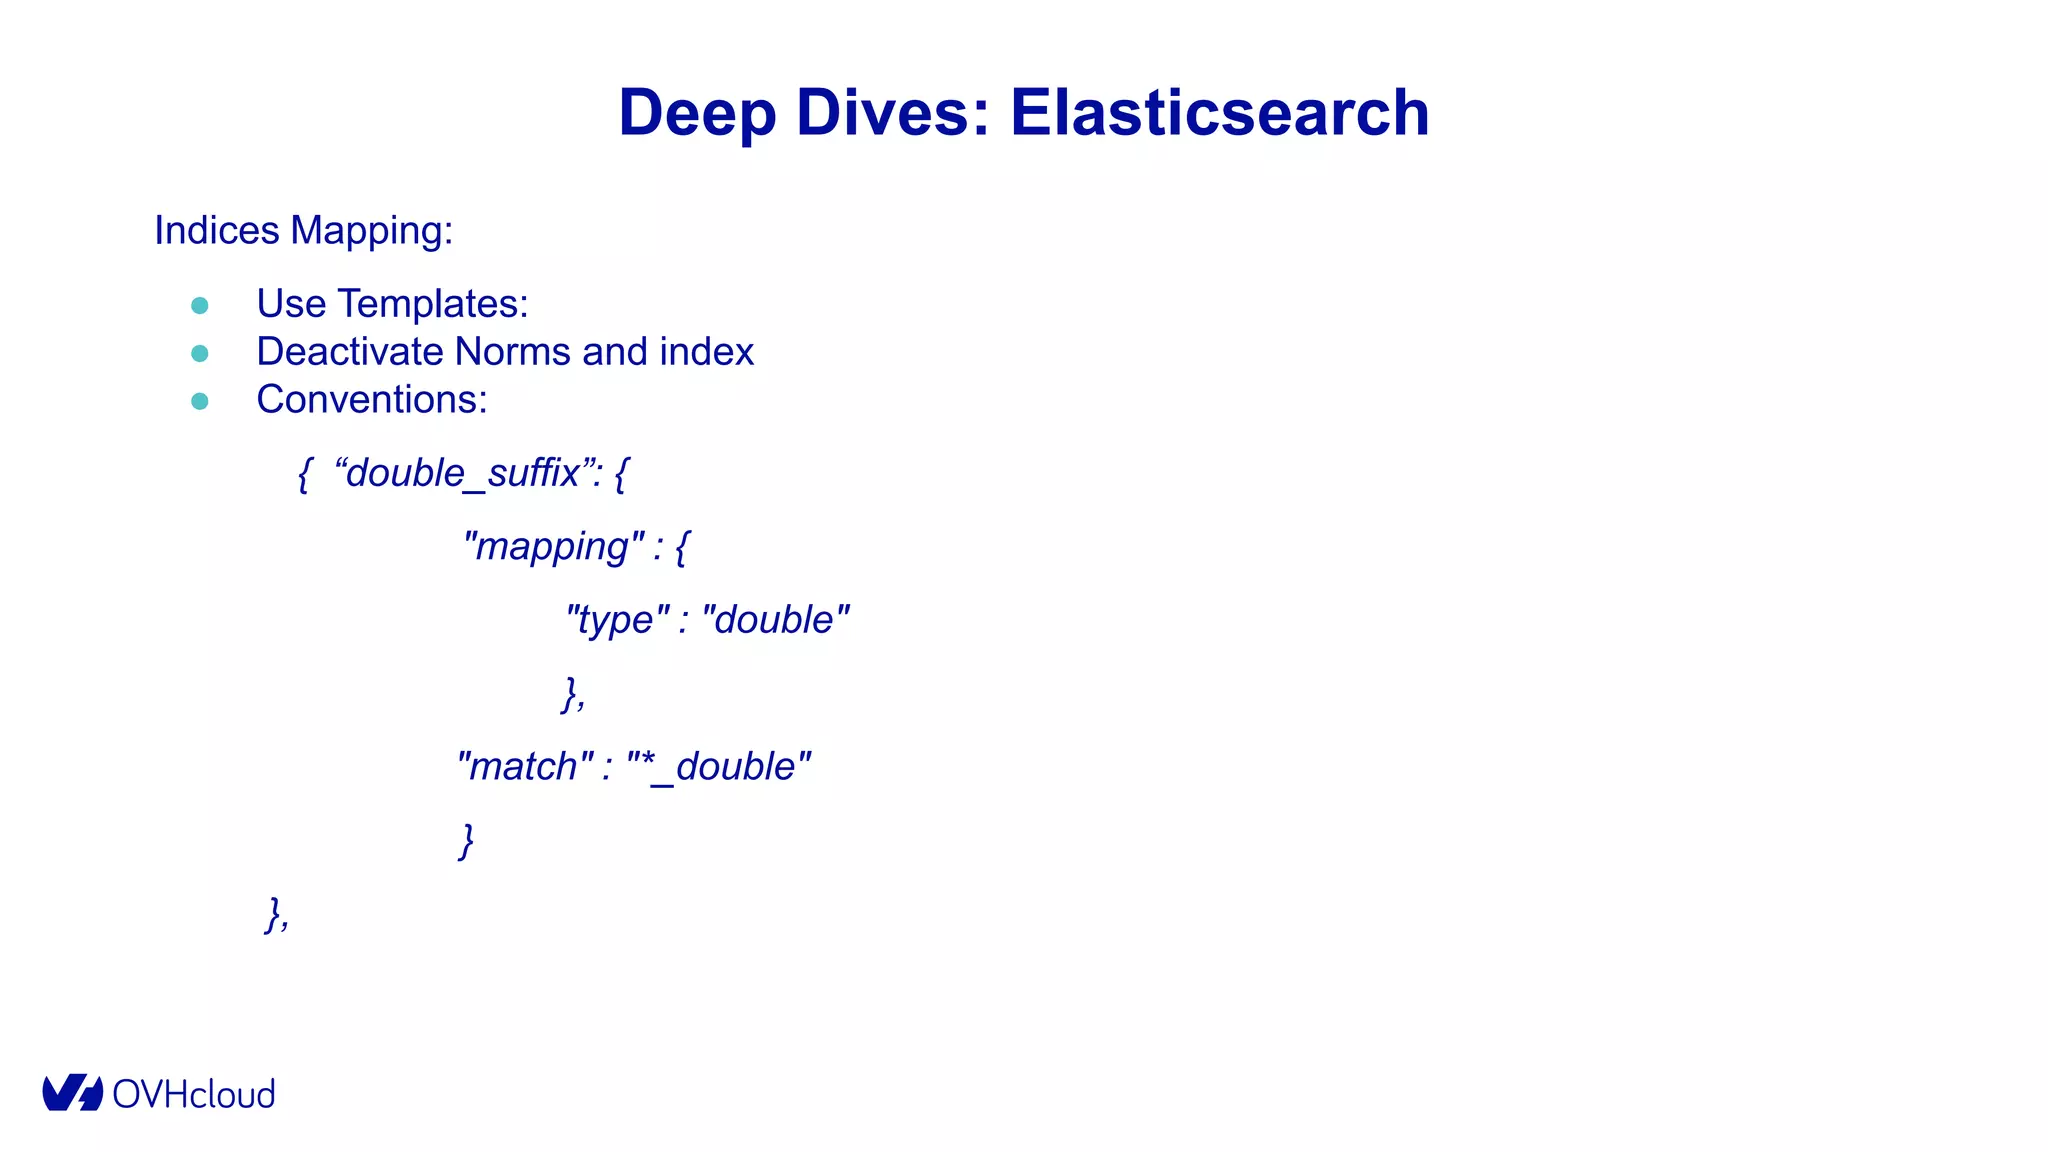


The document details OVHcloud's development of a log observability platform aimed at collecting and analyzing logs from various infrastructures and applications. It outlines the transition through various phases of implementation, highlighting challenges faced, architectural decisions made, and improvements over time, leading to a robust multi-tenant solution. Key takeaways emphasize the importance of understanding infrastructure, optimizing performance, and adapting to user needs.


![[jLove 2020] Where is my cache architectural patterns for caching microservi...](https://cdn.slidesharecdn.com/ss_thumbnails/whereismycachearchitecturalpatternsforcachingmicroservicesbyexample-201204105143-thumbnail.jpg?width=640&height=640&fit=bounds)