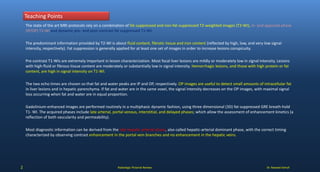
1) The document discusses the MRI approach for evaluating focal liver lesions, describing the protocols and appearance of common lesions on different MRI sequences.
2) Key sequences include T1-weighted, T2-weighted, in-phase/opposed-phase, and dynamic post-contrast images which help characterize lesions based on features like signal intensity, enhancement pattern, and hepatobiliary phase uptake.
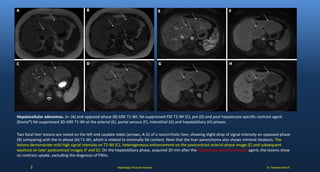
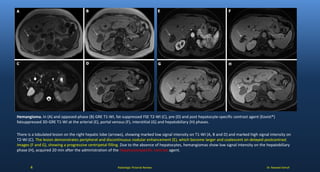
3) Examples are provided of common benign and malignant liver lesions like hemangioma, focal nodular hyperplasia, cyst, hepatocellular carcinoma, and their MRI findings.


![CASE_PRESENTATION_ON_subdural_hematoma(SDH)[1 FINAL PPT]-1.pptx](https://cdn.slidesharecdn.com/ss_thumbnails/casepresentationonsubduralhematomasdh1finalppt-1-260129172522-d405d375-thumbnail.jpg?width=640&height=640&fit=bounds)


