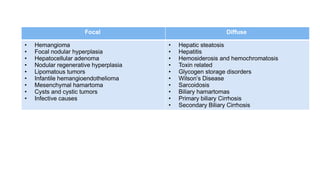
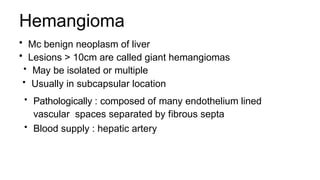
Hemangioma
• Mc benignneoplasm of liver
• Lesions > 10cm are called giant hemangiomas
• May be isolated or multiple
• Usually in subcapsular location
• Pathologically : composed of many endothelium lined
vascular spaces separated by fibrous septa
• Blood supply : hepatic artery
4.
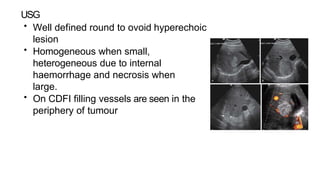
USG
• Well definedround to ovoid hyperechoic
lesion
• Homogeneous when small,
heterogeneous due to internal
haemorrhage and necrosis when
large.
• On CDFI filling vessels are seen in the
periphery of tumour
5.
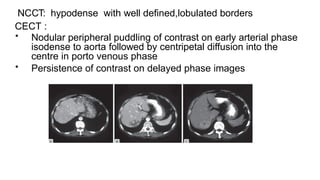
NCCT: hypodense withwell defined,lobulated borders
CECT :
• Nodular peripheral puddling of contrast on early arterial phase
isodense to aorta followed by centripetal diffusion into the
centre in porto venous phase
• Persistence of contrast on delayed phase images
6.
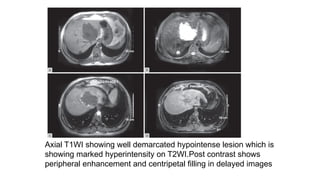
MRI
• T1WI :well defined hypointense
• T2WI : marked hyperintensity “light bulb appearance”
• Majority of small lesions show uniform early enhancement or
peripheral nodular enhancement progressing centripetally
7.
Axial T1WI showingwell demarcated hypointense lesion which is
showing marked hyperintensity on T2WI.Post contrast shows
peripheral enhancement and centripetal filling in delayed images
8.
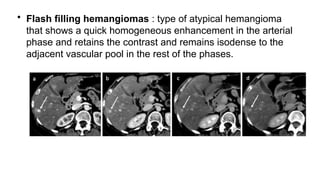
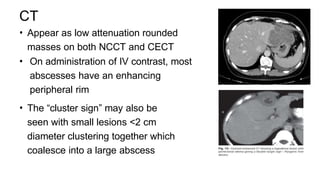
• Flash fillinghemangiomas : type of atypical hemangioma
that shows a quick homogeneous enhancement in the arterial
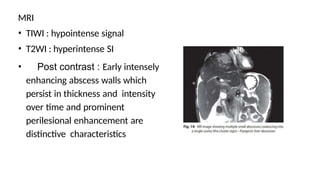
phase and retains the contrast and remains isodense to the
adjacent vascular pool in the rest of the phases.
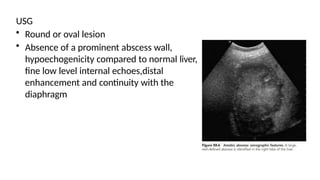
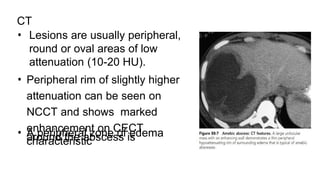
9.
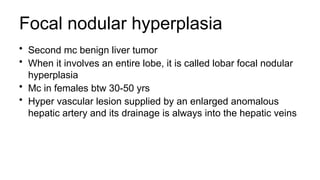
Focal nodular hyperplasia
•Second mc benign liver tumor
• When it involves an entire lobe, it is called lobar focal nodular
hyperplasia
• Mc in females btw 30-50 yrs
• Hyper vascular lesion supplied by an enlarged anomalous
hepatic artery and its drainage is always into the hepatic veins
10.
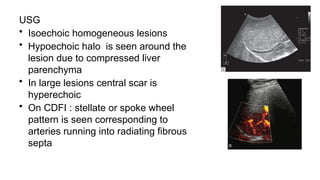
USG
• Isoechoic homogeneouslesions
• Hypoechoic halo is seen around the
lesion due to compressed liver
parenchyma
• In large lesions central scar is
hyperechoic
• On CDFI : stellate or spoke wheel
pattern is seen corresponding to
arteries running into radiating fibrous
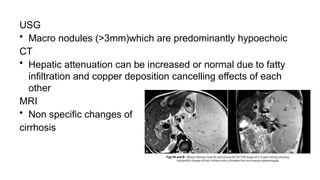
septa
11.
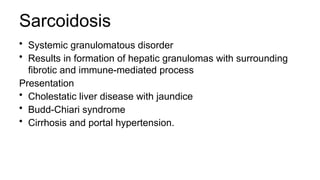
CT
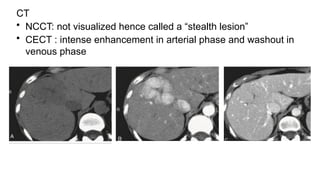
• NCCT: notvisualized hence called a “stealth lesion”
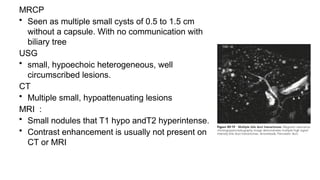
• CECT : intense enhancement in arterial phase and washout in
venous phase
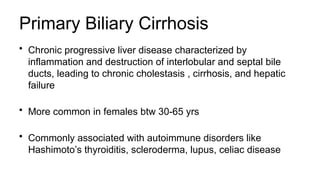
12.
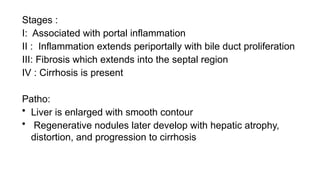
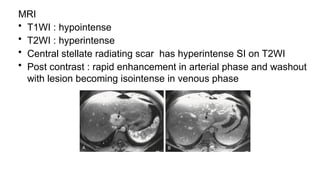
MRI
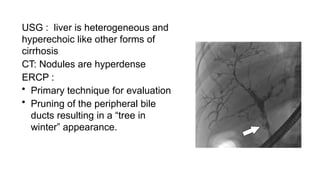
• T1WI :hypointense
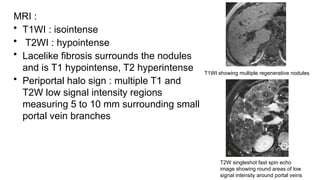
• T2WI : hyperintense
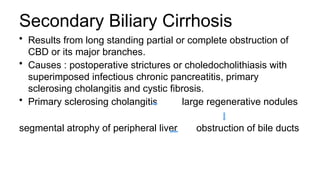
• Central stellate radiating scar has hyperintense SI on T2WI
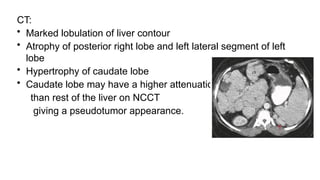
• Post contrast : rapid enhancement in arterial phase and washout
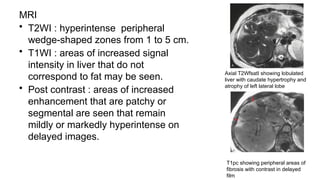
with lesion becoming isointense in venous phase
13.
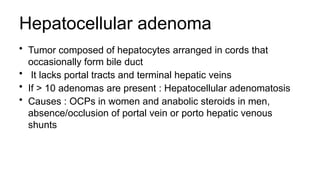
Hepatocellular adenoma
• Tumorcomposed of hepatocytes arranged in cords that
occasionally form bile duct
• It lacks portal tracts and terminal hepatic veins
• If > 10 adenomas are present : Hepatocellular adenomatosis
• Causes : OCPs in women and anabolic steroids in men,
absence/occlusion of portal vein or porto hepatic venous
shunts
14.
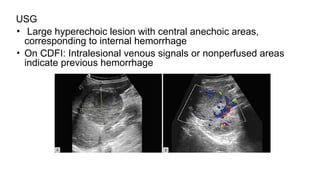
USG
• Large hyperechoiclesion with central anechoic areas,
corresponding to internal hemorrhage
• On CDFI: Intralesional venous signals or nonperfused areas
indicate previous hemorrhage
15.
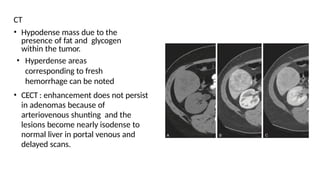
CT
• Hypodense massdue to the
presence of fat and glycogen
within the tumor.
• Hyperdense areas
corresponding to fresh
hemorrhage can be noted
• CECT : enhancement does not persist
in adenomas because of
arteriovenous shunting and the
lesions become nearly isodense to
normal liver in portal venous and
delayed scans.
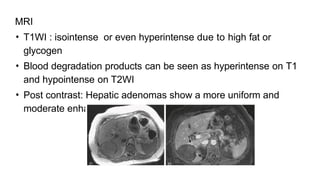
16.
MRI
• T1WI :isointense or even hyperintense due to high fat or
glycogen
• Blood degradation products can be seen as hyperintense on T1
and hypointense on T2WI
• Post contrast: Hepatic adenomas show a more uniform and
moderate enhancement on arterial phase
17.
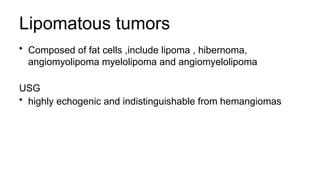
Lipomatous tumors
• Composedof fat cells ,include lipoma , hibernoma,
angiomyolipoma myelolipoma and angiomyelolipoma
USG
• highly echogenic and indistinguishable from hemangiomas
18.
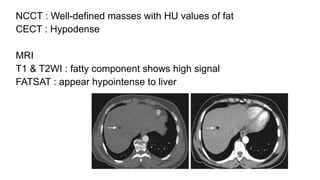
NCCT : Well-definedmasses with HU values of fat
CECT : Hypodense
MRI
T1 & T2WI : fatty component shows high signal
FATSAT : appear hypointense to liver
19.
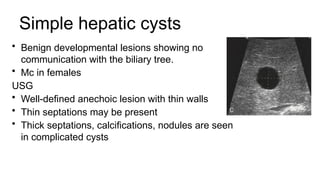
Simple hepatic cysts
•Benign developmental lesions showing no
communication with the biliary tree.
• Mc in females
USG
• Well-defined anechoic lesion with thin walls
• Thin septations may be present
• Thick septations, calcifications, nodules are seen
in complicated cysts
20.
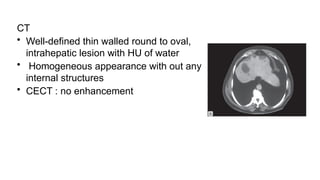
CT
• Well-defined thinwalled round to oval,
intrahepatic lesion with HU of water
• Homogeneous appearance with out any
internal structures
• CECT : no enhancement
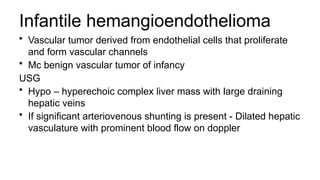
Infantile hemangioendothelioma
• Vasculartumor derived from endothelial cells that proliferate
and form vascular channels
• Mc benign vascular tumor of infancy
USG
• Hypo – hyperechoic complex liver mass with large draining
hepatic veins
• If significant arteriovenous shunting is present - Dilated hepatic
vasculature with prominent blood flow on doppler
23.
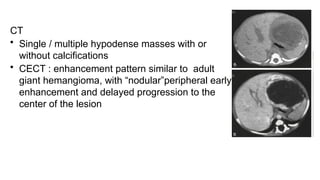
CT
• Single /multiple hypodense masses with or
without calcifications
• CECT : enhancement pattern similar to adult
giant hemangioma, with “nodular”peripheral early
enhancement and delayed progression to the
center of the lesion
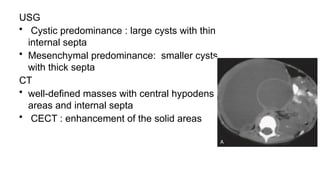
USG
• Cystic predominance: large cysts with thin
internal septa
• Mesenchymal predominance: smaller cysts
with thick septa
CT
• well-defined masses with central hypodense
areas and internal septa
• CECT : enhancement of the solid areas
27.
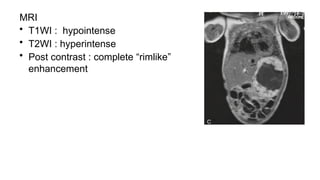
MRI
• Stromal predominance:T1WI
hypointense than normal liver
• Cystic predominance: T1WI -
hypointense
T2WI - markedly hyperintense with
multiple septa traversing the tumor,
indicating that the mass is not a simple cyst
• Post contrast : stromal components may
enhance
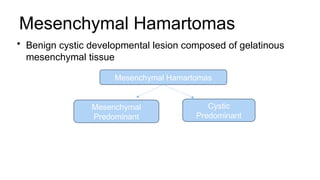
Hydatid disease
• Hydatiddisease is a worldwide zoonosis produced by the
larvae of Echinococcus tapeworm
• Caused by E granulosus and E multilocularis.
• Definitive host - dog.
• Intermediate host - Human
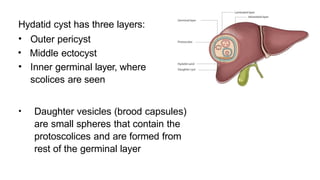
30.
Hydatid cyst hasthree layers:
• Outer pericyst
• Middle ectocyst
• Inner germinal layer, where
scolices are seen
• Daughter vesicles (brood capsules)
are small spheres that contain the
protoscolices and are formed from
rest of the germinal layer
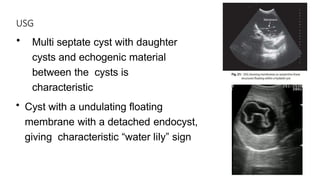
31.
USG
• Multi septatecyst with daughter
cysts and echogenic material
between the cysts is
characteristic
• Cyst with a undulating floating
membrane with a detached endocyst,
giving characteristic “water lily” sign
32.
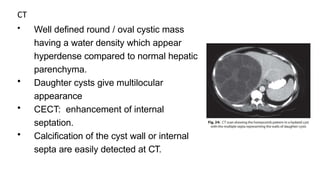
CT
• Well definedround / oval cystic mass
having a water density which appear
hyperdense compared to normal hepatic
parenchyma.
• Daughter cysts give multilocular
appearance
• CECT: enhancement of internal
septation.
• Calcification of the cyst wall or internal
septa are easily detected at CT.
33.
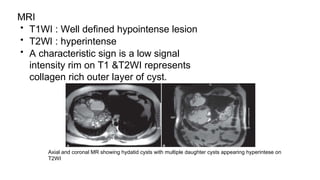
MRI
• T1WI :Well defined hypointense lesion
• T2WI : hyperintense
• A characteristic sign is a low signal
intensity rim on T1 &T2WI represents
collagen rich outer layer of cyst.
Axial and coronal MR showing hydatid cysts with multiple daughter cysts appearing hyperintese on
T2WI
34.
Pyogenic liver abscess
•E coli,Klebsiella pneumoniae,bacteroid,
streptococci,enterococci
• Typical presentation is right upper quadrant pain, fever and
jaundice.
• Bacterial abscesses are often multiple
35.
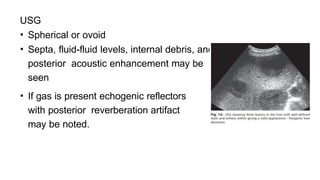
USG
• Spherical orovoid
• Septa, fluid-fluid levels, internal debris, and
posterior acoustic enhancement may be
seen
• If gas is present echogenic reflectors
with posterior reverberation artifact
may be noted.
36.
CT
• Appear aslow attenuation rounded
masses on both NCCT and CECT
• On administration of IV contrast, most
abscesses have an enhancing
peripheral rim
• The “cluster sign” may also be
seen with small lesions <2 cm
diameter clustering together which
coalesce into a large abscess
37.
MRI
• TIWI :hypointense signal
• T2WI : hyperintense SI
• Post contrast : Early intensely
enhancing abscess walls which
persist in thickness and intensity
over time and prominent
perilesional enhancement are
distinctive characteristics
38.
Amoebic Liver abcess
•Caused by Entamoeba histolytica.
• Most common extraintestinal manifestation of amoebiasis
• Centrally the cavity is often filled by a thick fluid that
resembles “anchovy sause”.
• Usually solitary, mc located in right lobe
39.
USG
• Round oroval lesion
• Absence of a prominent abscess wall,
hypoechogenicity compared to normal liver,
fine low level internal echoes,distal
enhancement and continuity with the
diaphragm
40.
CT
• Lesions areusually peripheral,
round or oval areas of low
attenuation (10-20 HU).
• Peripheral rim of slightly higher
attenuation can be seen on
NCCT and shows marked
enhancement on CECT
• A peripheral zone of edema
around the abscess is
characteristic
41.
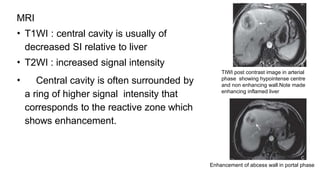
MRI
• T1WI :central cavity is usually of
decreased SI relative to liver
• T2WI : increased signal intensity
• Central cavity is often surrounded by
a ring of higher signal intensity that
corresponds to the reactive zone which
shows enhancement.
TIWI post contrast image in arterial
phase showing hypointense centre
and non enhancing wall.Note made
enhancing inflamed liver
Enhancement of abcess wall in portal phase
Hepatic steatosis
• Excessiveaccumulation of
intracellular fat within
hepatocytes known as
hepatic steatosis
• Causes : alcohol, diabetes
mellitus and obesity
44.
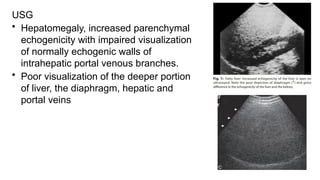
USG
• Hepatomegaly, increasedparenchymal
echogenicity with impaired visualization
of normally echogenic walls of
intrahepatic portal venous branches.
• Poor visualization of the deeper portion
of liver, the diaphragm, hepatic and
portal veins
45.
CT
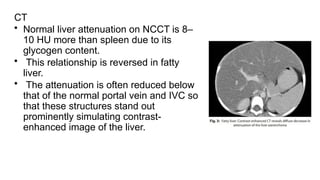
• Normal liverattenuation on NCCT is 8–
10 HU more than spleen due to its
glycogen content.
• This relationship is reversed in fatty
liver.
• The attenuation is often reduced below
that of the normal portal vein and IVC so
that these structures stand out
prominently simulating contrast-
enhanced image of the liver.
46.
MRI
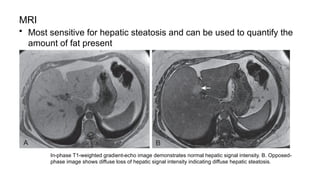
• Most sensitivefor hepatic steatosis and can be used to quantify the
amount of fat present
In-phase T1-weighted gradient-echo image demonstrates normal hepatic signal intensity. B. Opposed-
phase image shows diffuse loss of hepatic signal intensity indicating diffuse hepatic steatosis.
47.
Hepatits
• Hepatitis isa general term used to describe acute or chronic
inflammation of the liver
Causes include:
• Viral [mc]
• Alcohol
• Drugs : acetaminophen, isoniazid, oral contraceptives
48.
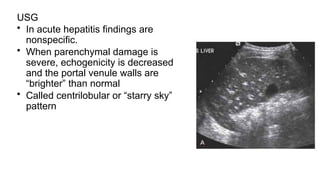
USG
• In acutehepatitis findings are
nonspecific.
• When parenchymal damage is
severe, echogenicity is decreased
and the portal venule walls are
“brighter” than normal
• Called centrilobular or “starry sky”
pattern
49.
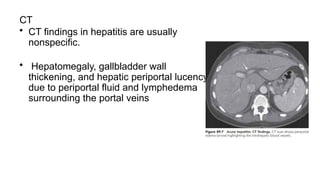
CT
• CT findingsin hepatitis are usually
nonspecific.
• Hepatomegaly, gallbladder wall
thickening, and hepatic periportal lucency
due to periportal fluid and lymphedema
surrounding the portal veins
50.
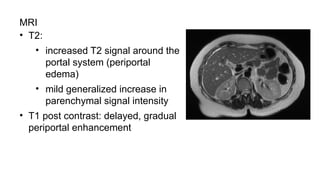
MRI
• T2:
• increasedT2 signal around the
portal system (periportal
edema)
• mild generalized increase in
parenchymal signal intensity
• T1 post contrast: delayed, gradual
periportal enhancement
51.
Hemosiderosis and Hemochromatosis
•Normal iron : 2 to 6 g
• 80% is functional iron in the form of hemoglobin, myoglobin, and
iron-containing enzymes
• Rest 20% as the storage form , either hemosiderin or ferritin and is
stored in the reticuloendothelial system
• If present in excess amounts deposited into additional organs and
causes dysfunction
52.
Hemosiderosis :
• Increasediron deposition without parenchymal organ damage
• Body iron stores : 10 - 20 g.
Hemochromatosis :
• Iron overload disorder that results in structural and functional
impairment of the involved organs.
• Body iron : 50 - 60 g.
53.
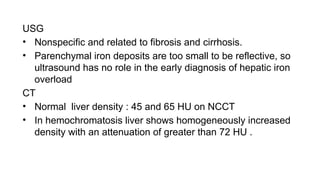
USG
• Nonspecific andrelated to fibrosis and cirrhosis.
• Parenchymal iron deposits are too small to be reflective, so
ultrasound has no role in the early diagnosis of hepatic iron
overload
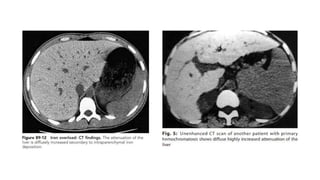
CT
• Normal liver density : 45 and 65 HU on NCCT
• In hemochromatosis liver shows homogeneously increased
density with an attenuation of greater than 72 HU .
55.
MRI
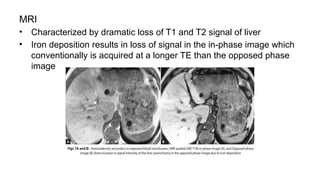
• Characterized bydramatic loss of T1 and T2 signal of liver
• Iron deposition results in loss of signal in the in-phase image which
conventionally is acquired at a longer TE than the opposed phase
image
56.
Glycogen storage disorders
•Type Ia (von Gierke’s disease) is the most common subtype to
affect liver
• Due to deficiency of glucose-6-phosphatase in the liver and
kidneys
Excessive glycogen deposition in the hepatocytes and
proximal renal tubules
• Adenomatosis is seen in upto 60% of patients with type Ia
glycogen storage disease
57.
USG
• Hepatomegaly withincreased echogenicity
• Less fat and glycogen in the adenomas compared with the rest
of liver
• Adenomas from other causes contain more fat in comparison
to liver parenchyma
58.
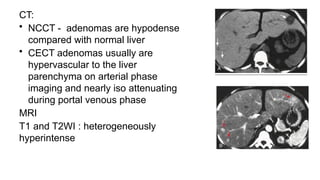
CT:
• NCCT -adenomas are hypodense
compared with normal liver
• CECT adenomas usually are
hypervascular to the liver
parenchyma on arterial phase
imaging and nearly iso attenuating
during portal venous phase
MRI
T1 and T2WI : heterogeneously
hyperintense
59.
Wilson’s Disease
• Alsocalled hepatolenticular degeneration,
• Autosomal recessive inherited disorder of copper metabolism
• Leads to decreased biliary excretion of copper and decreased
levels of ceruloplasmin
Accumulation of copper in hepatocytes
60.
USG
• Macro nodules(>3mm)which are predominantly hypoechoic
CT
• Hepatic attenuation can be increased or normal due to fatty
infiltration and copper deposition cancelling effects of each
other
MRI
• Non specific changes of
cirrhosis
61.
Sarcoidosis
• Systemic granulomatousdisorder
• Results in formation of hepatic granulomas with surrounding
fibrotic and immune-mediated process
Presentation
• Cholestatic liver disease with jaundice
• Budd-Chiari syndrome
• Cirrhosis and portal hypertension.
62.
USG
• large granulomasseen as
hypoechoic nodules
CT
• hepatomegaly and hypoattenuating
nodules varying in size up to 2 cm
MRI
• Nodules appear hypointense on both
T1 and T2WI
T1 GRE sequence showing
irregularly shaped low SI nodules
in periphery of the liver and
widening of periportal tracts
63.
Biliary Hamartomas
• Knownas von Meyenburg complexes
• Benign malformations of the biliary tract
• Characterized by irregular bile ducts surrounded by fibrous
stroma
• Associated with both polycystic liver and kidney disease
• Malignant transformation is very rare
64.
MRCP
• Seen asmultiple small cysts of 0.5 to 1.5 cm
without a capsule. With no communication with
biliary tree
USG
• small, hypoechoic heterogeneous, well
circumscribed lesions.
CT
• Multiple small, hypoattenuating lesions
MRI :
• Small nodules that T1 hypo andT2 hyperintense.
• Contrast enhancement is usually not present on
CT or MRI
65.
Primary Biliary Cirrhosis
•Chronic progressive liver disease characterized by
inflammation and destruction of interlobular and septal bile
ducts, leading to chronic cholestasis , cirrhosis, and hepatic
failure
• More common in females btw 30-65 yrs
• Commonly associated with autoimmune disorders like
Hashimoto’s thyroiditis, scleroderma, lupus, celiac disease
66.
Stages :
I: Associatedwith portal inflammation
II : Inflammation extends periportally with bile duct proliferation
III: Fibrosis which extends into the septal region
IV : Cirrhosis is present
Patho:
• Liver is enlarged with smooth contour
• Regenerative nodules later develop with hepatic atrophy,
distortion, and progression to cirrhosis
67.
USG : liveris heterogeneous and
hyperechoic like other forms of
cirrhosis
CT: Nodules are hyperdense
ERCP :
• Primary technique for evaluation
• Pruning of the peripheral bile
ducts resulting in a “tree in
winter” appearance.
68.
MRI :
• T1WI: isointense
• T2WI : hypointense
• Lacelike fibrosis surrounds the nodules
and is T1 hypointense, T2 hyperintense
• Periportal halo sign : multiple T1 and
T2W low signal intensity regions
measuring 5 to 10 mm surrounding small
portal vein branches
T1WI showing multiple regenerative nodules
T2W singleshot fast spin echo
image showing round areas of low
signal intensity around portal veins
69.
Secondary Biliary Cirrhosis
•Results from long standing partial or complete obstruction of
CBD or its major branches.
• Causes : postoperative strictures or choledocholithiasis with
superimposed infectious chronic pancreatitis, primary
sclerosing cholangitis and cystic fibrosis.
• Primary sclerosing cholangitis large regenerative nodules
segmental atrophy of peripheral liver obstruction of bile ducts
70.
CT:
• Marked lobulationof liver contour
• Atrophy of posterior right lobe and left lateral segment of left
lobe
• Hypertrophy of caudate lobe
• Caudate lobe may have a higher attenuation
than rest of the liver on NCCT
giving a pseudotumor appearance.
71.
MRI
• T2WI :hyperintense peripheral
wedge-shaped zones from 1 to 5 cm.
• T1WI : areas of increased signal
intensity in liver that do not
correspond to fat may be seen.
• Post contrast : areas of increased
enhancement that are patchy or
segmental are seen that remain
mildly or markedly hyperintense on
delayed images.
Axial T2WfsatI showing lobulated
liver with caudate hypertrophy and
atrophy of left lateral lobe
T1pc showing peripheral areas of
fibrosis with contrast in delayed
film
72.
References
• Grainger &Allison’s DIAGNOSTIC RADIOLOGY A Textbook of
Medical Imaging--Seventh edition
• Textbook of Gastrointestinal Radiology- Gore and Levine( 4th
edition)
• Matos AP, Velloni F, et alFocal liver lesions: Practical magnetic
resonance imaging approach. World J Hepatol. 2015 Aug
8;7(16)


![Hepatits
• Hepatitis is a general term used to describe acute or chronic
inflammation of the liver
Causes include:
• Viral [mc]
• Alcohol
• Drugs : acetaminophen, isoniazid, oral contraceptives](https://image.slidesharecdn.com/benignliverfocalanddiffuseleisons1-250413160616-4a4d4b03/85/benign-liver-focal-and-diffuse-leisons-1-pptx-47-320.jpg)