Download as PDF, PPTX


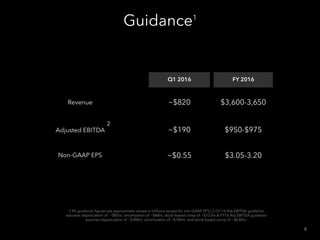

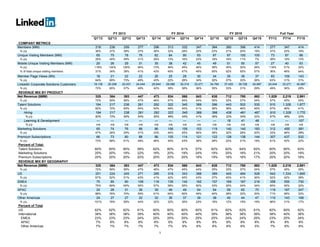
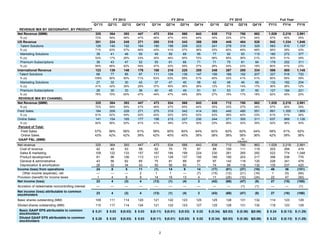
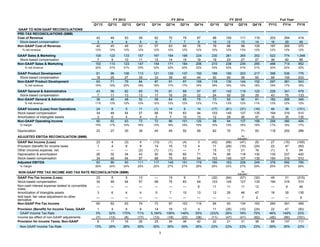
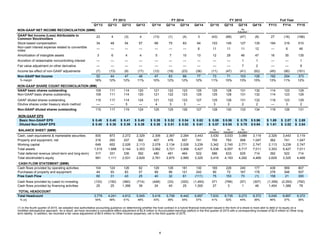


The document presents forward-looking financial metrics for Q1 and full fiscal year 2016, outlining expected revenue, adjusted EBITDA, and key risks impacting outcomes. It includes historical member growth and engagement statistics alongside revenue breakdowns by product and geography. Additionally, it emphasizes the significance of member data security, competition, and regulatory changes in shaping the company's future performance.


![Freelancers Are LinkedIn Power Users [Infographic]](https://cdn.slidesharecdn.com/ss_thumbnails/linkedinfreelancepowerusers-151020201935-lva1-app6892-thumbnail.jpg?width=640&height=640&fit=bounds)
![Top Industries for Freelancers on LinkedIn [Infographic]](https://cdn.slidesharecdn.com/ss_thumbnails/topfreelanceindustries-151020195404-lva1-app6892-thumbnail.jpg?width=640&height=640&fit=bounds)


