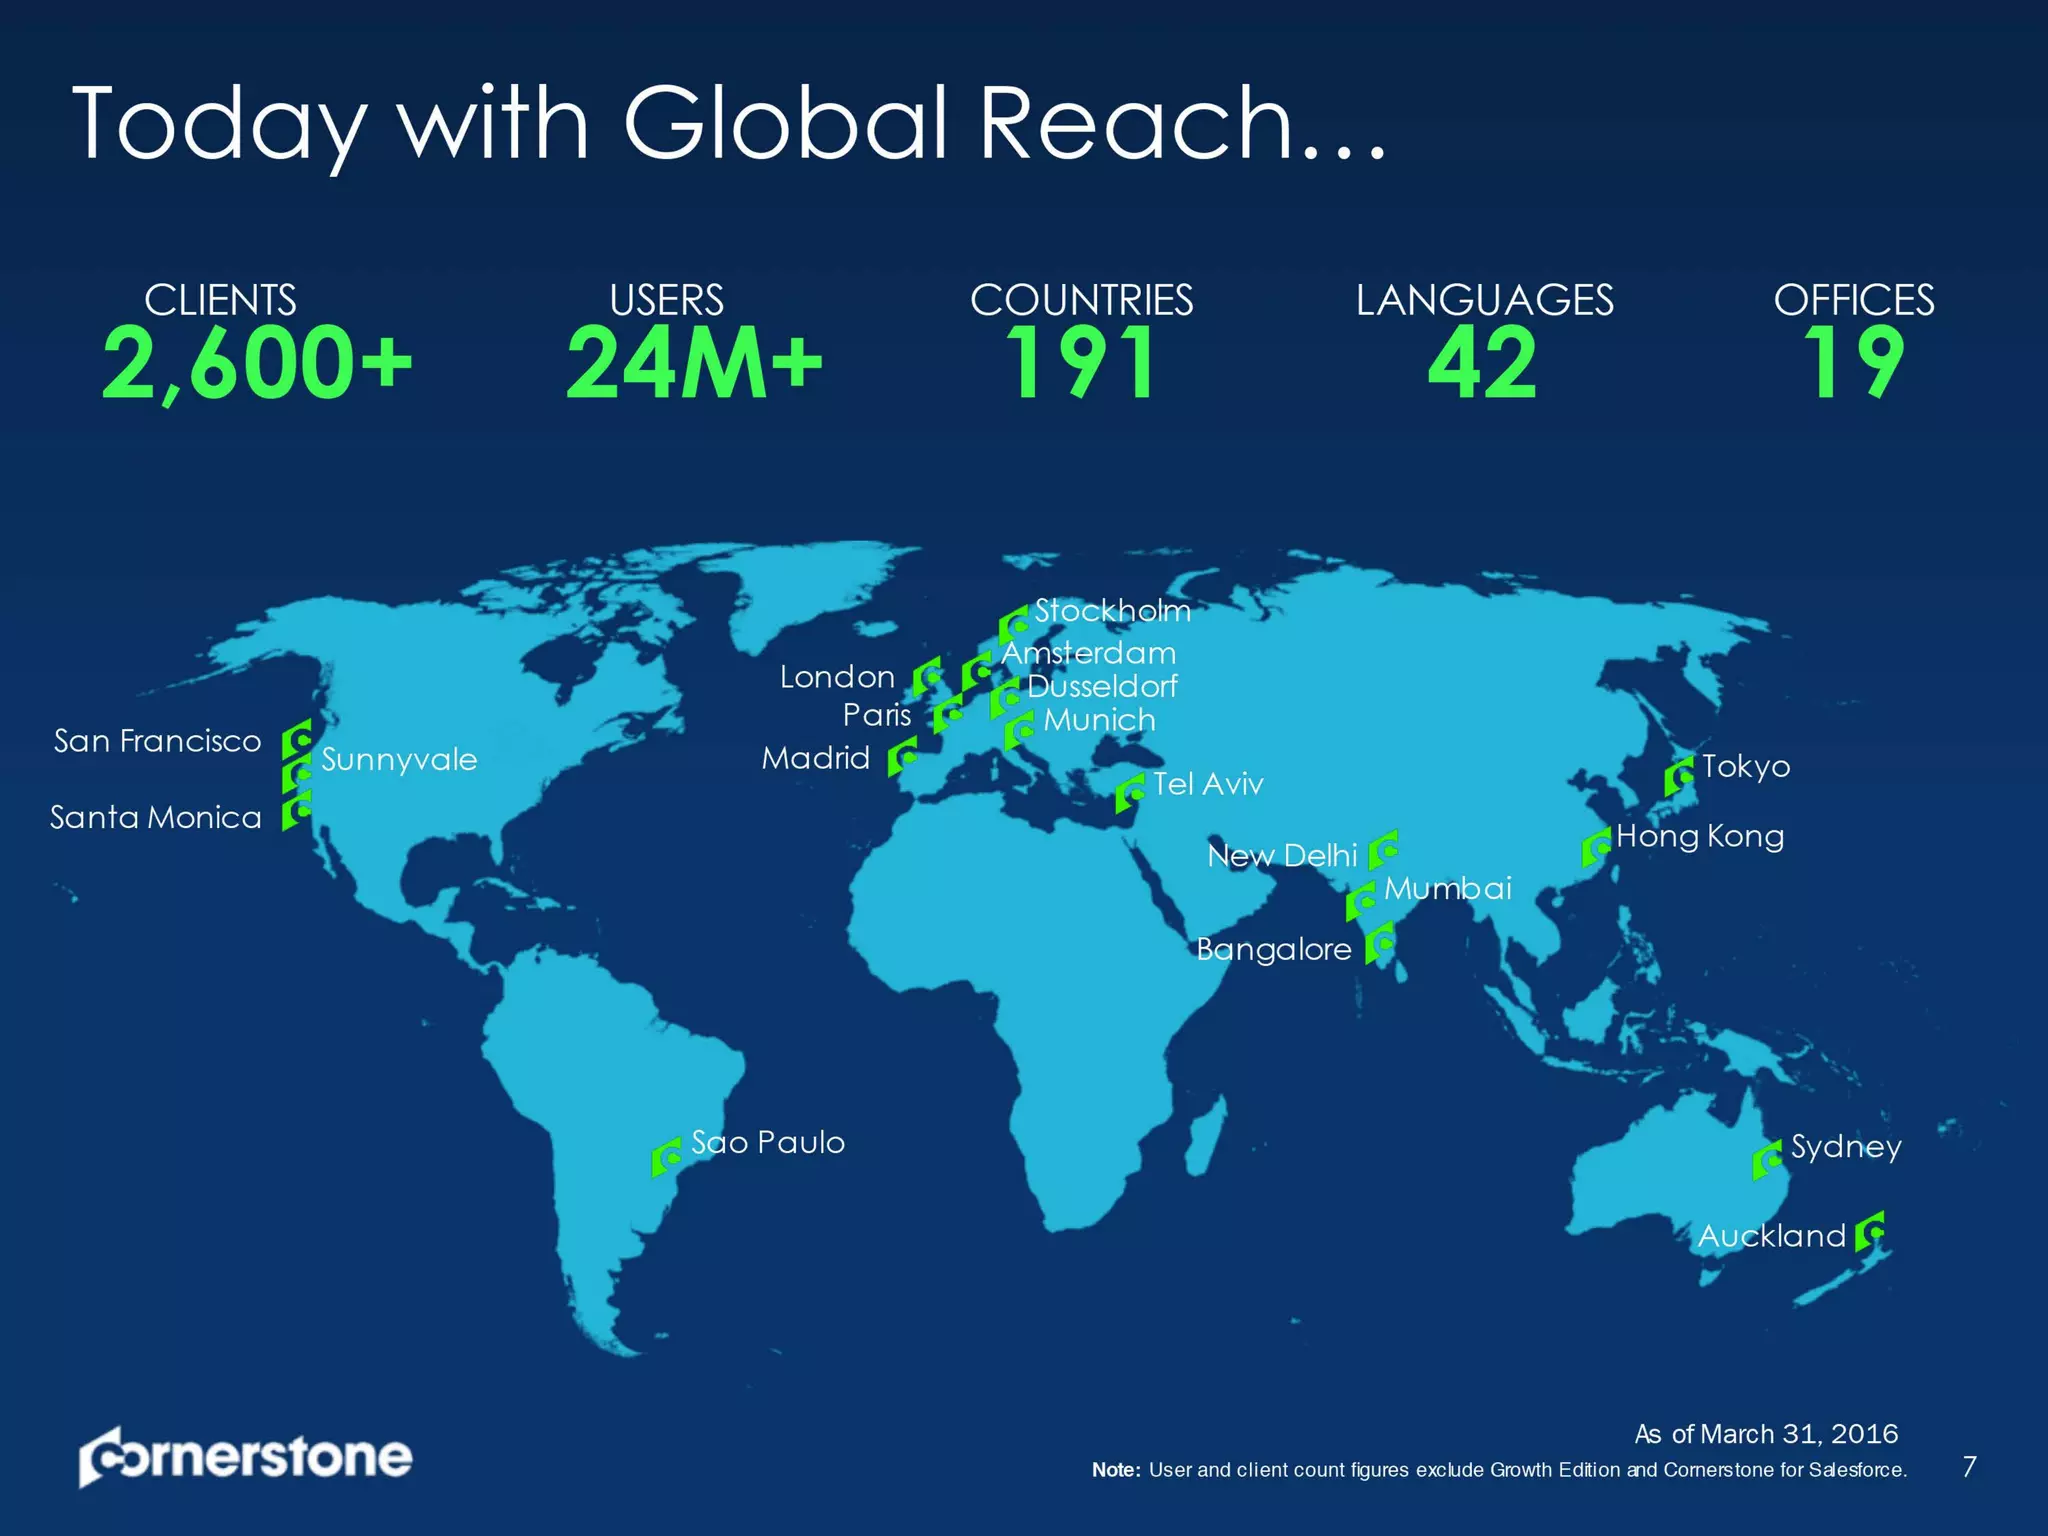
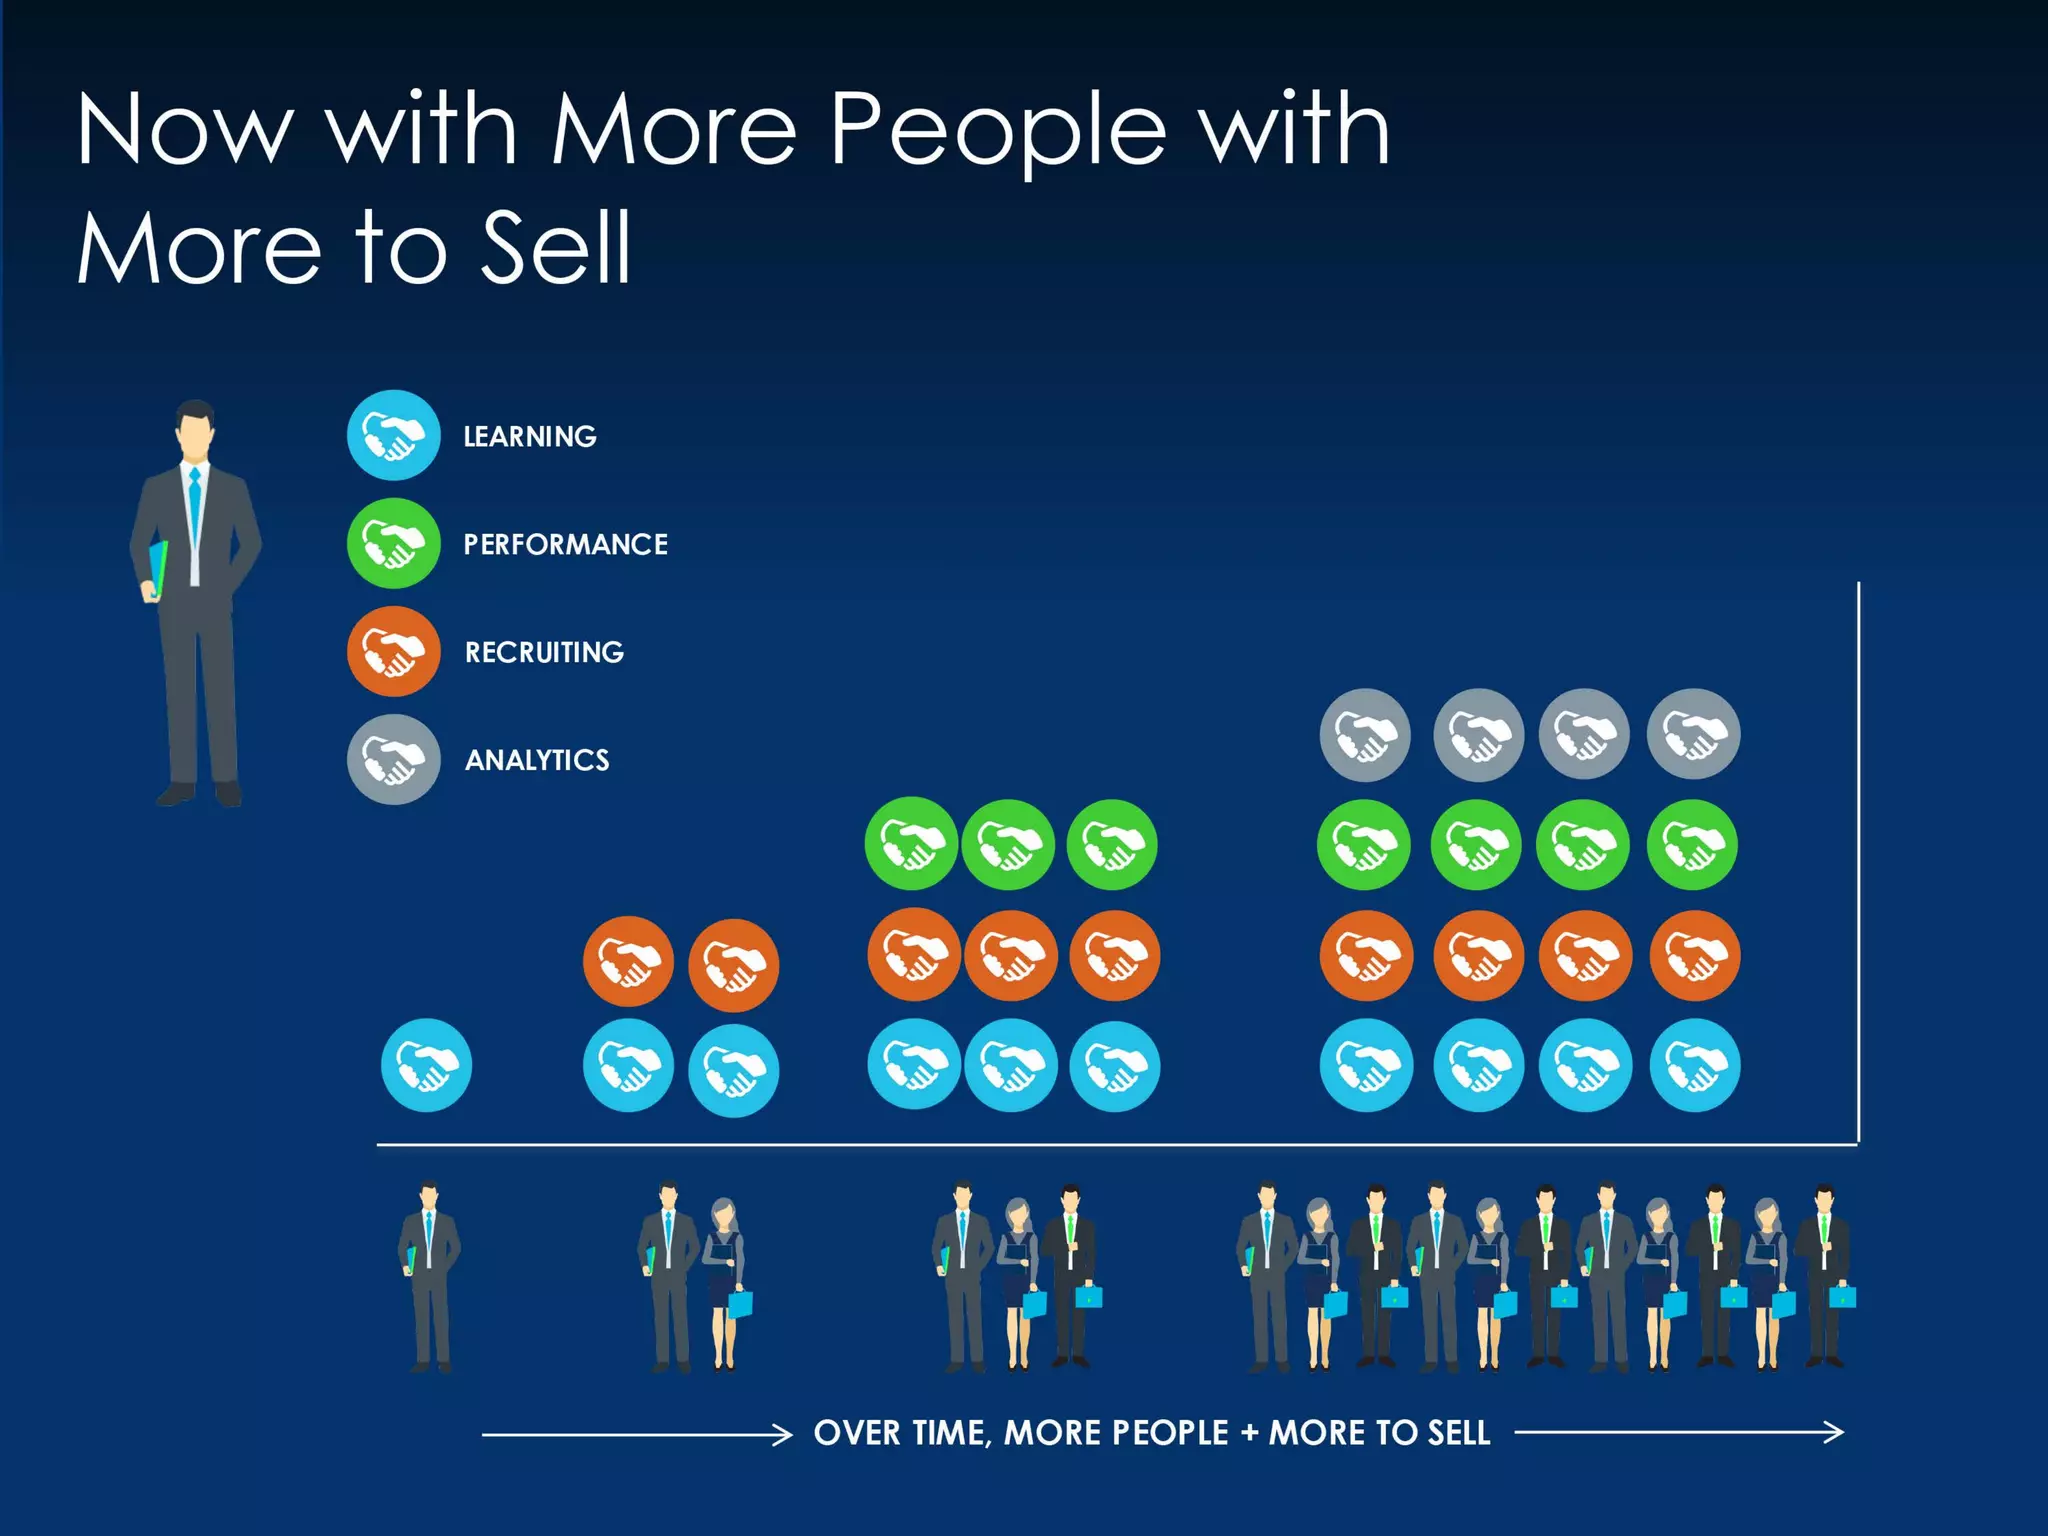
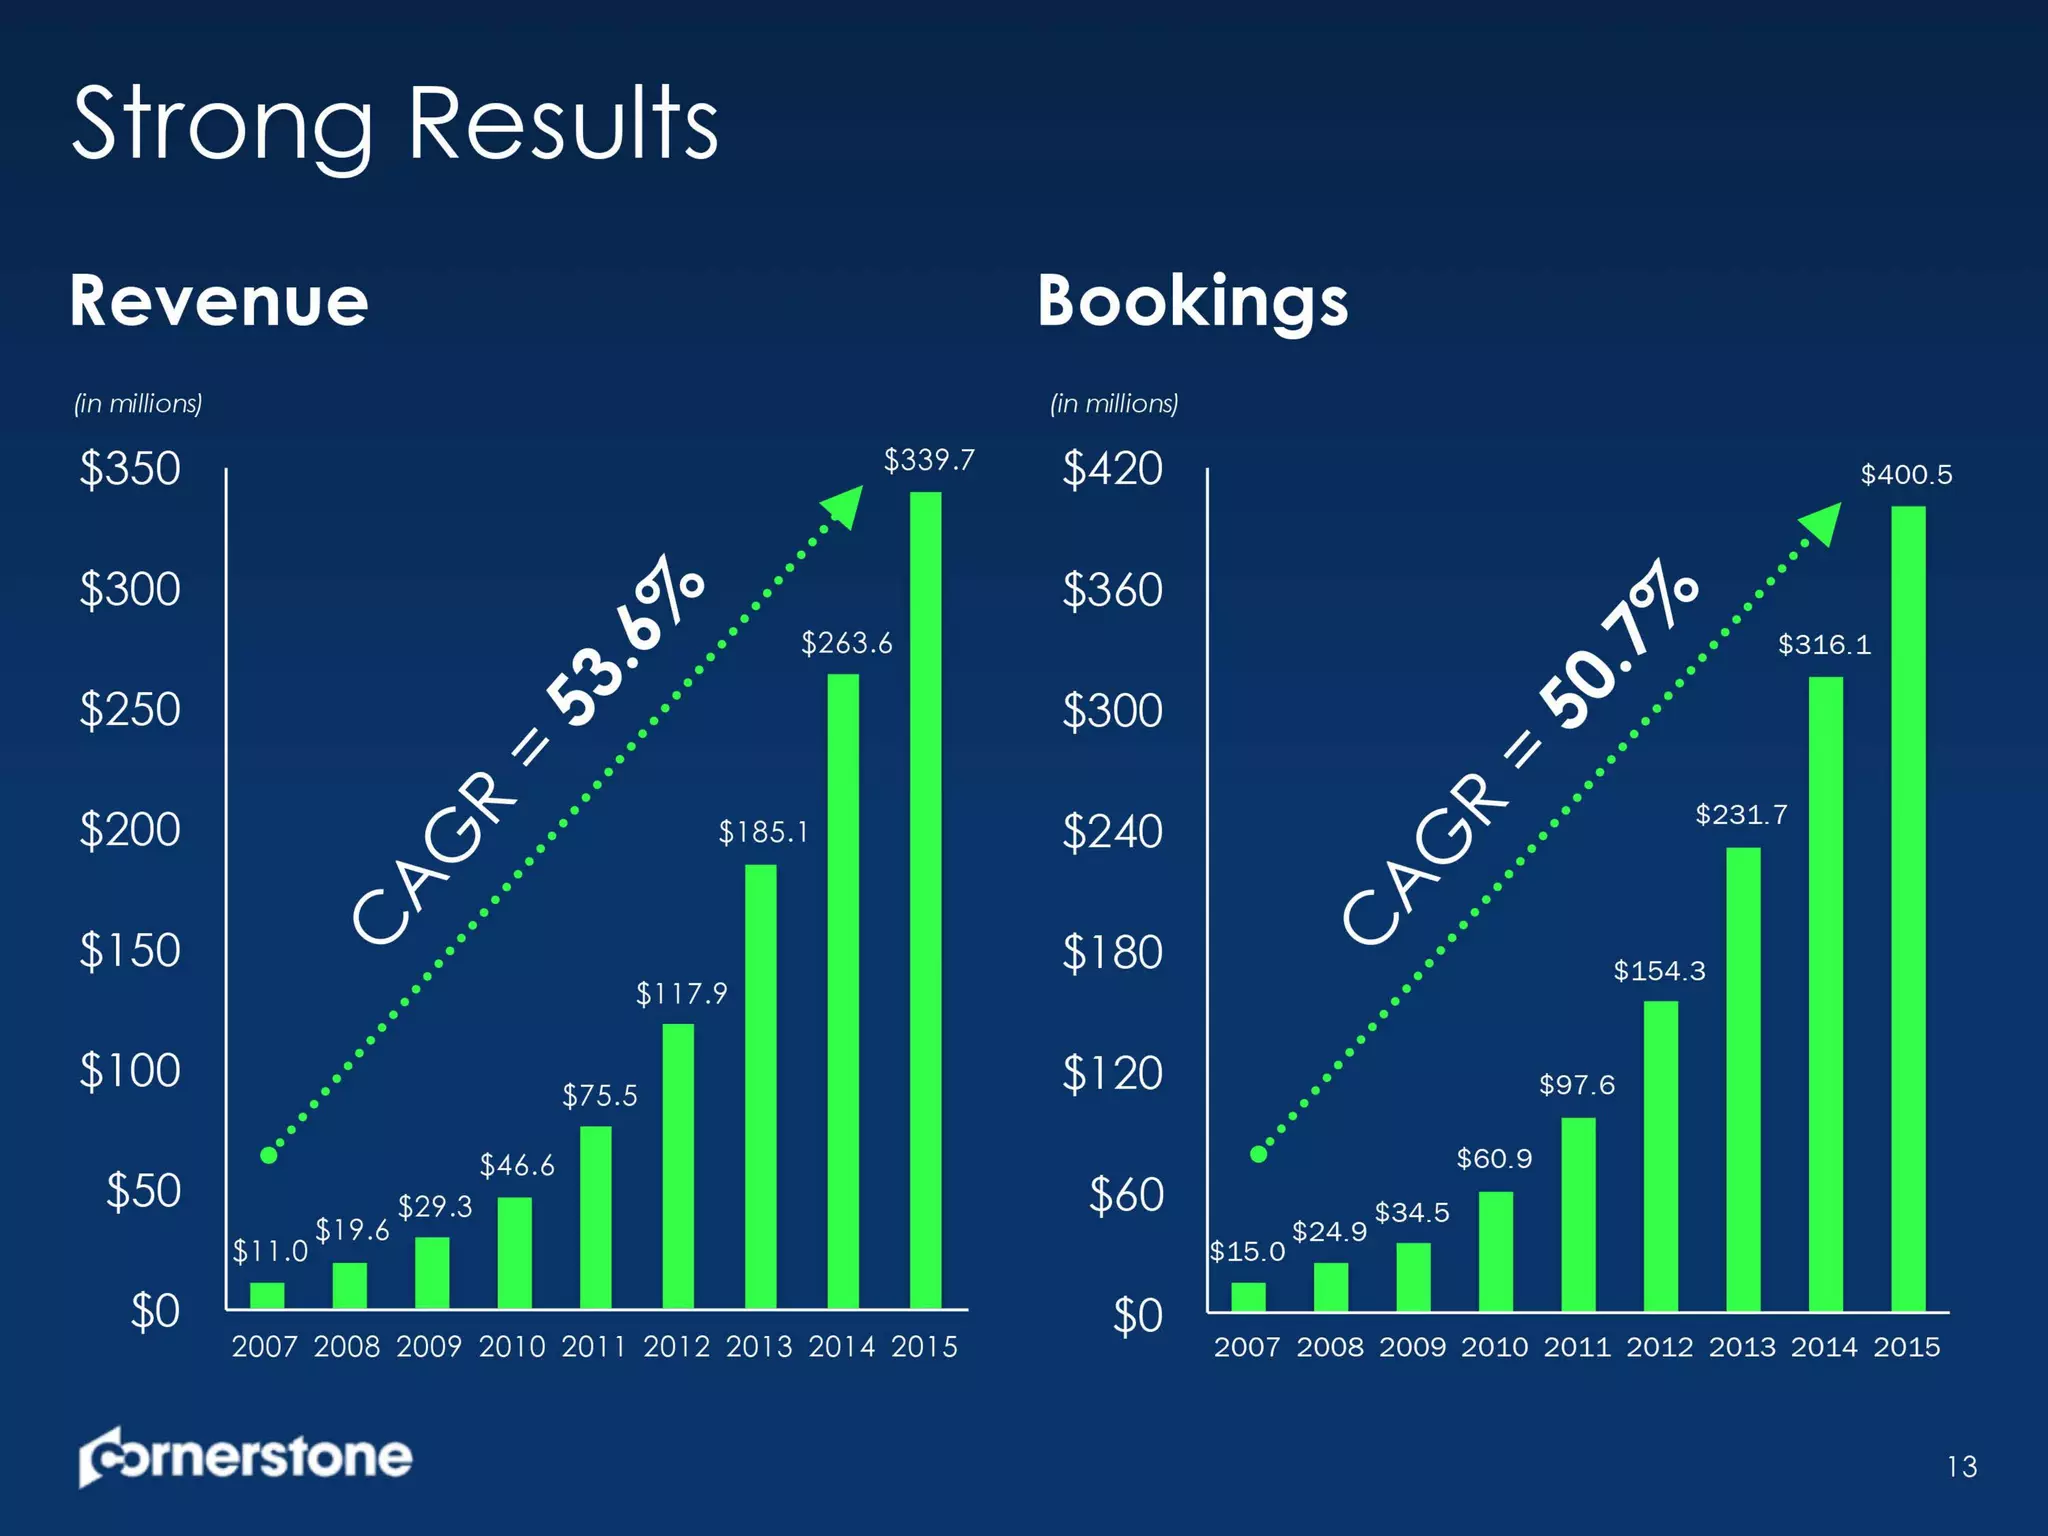
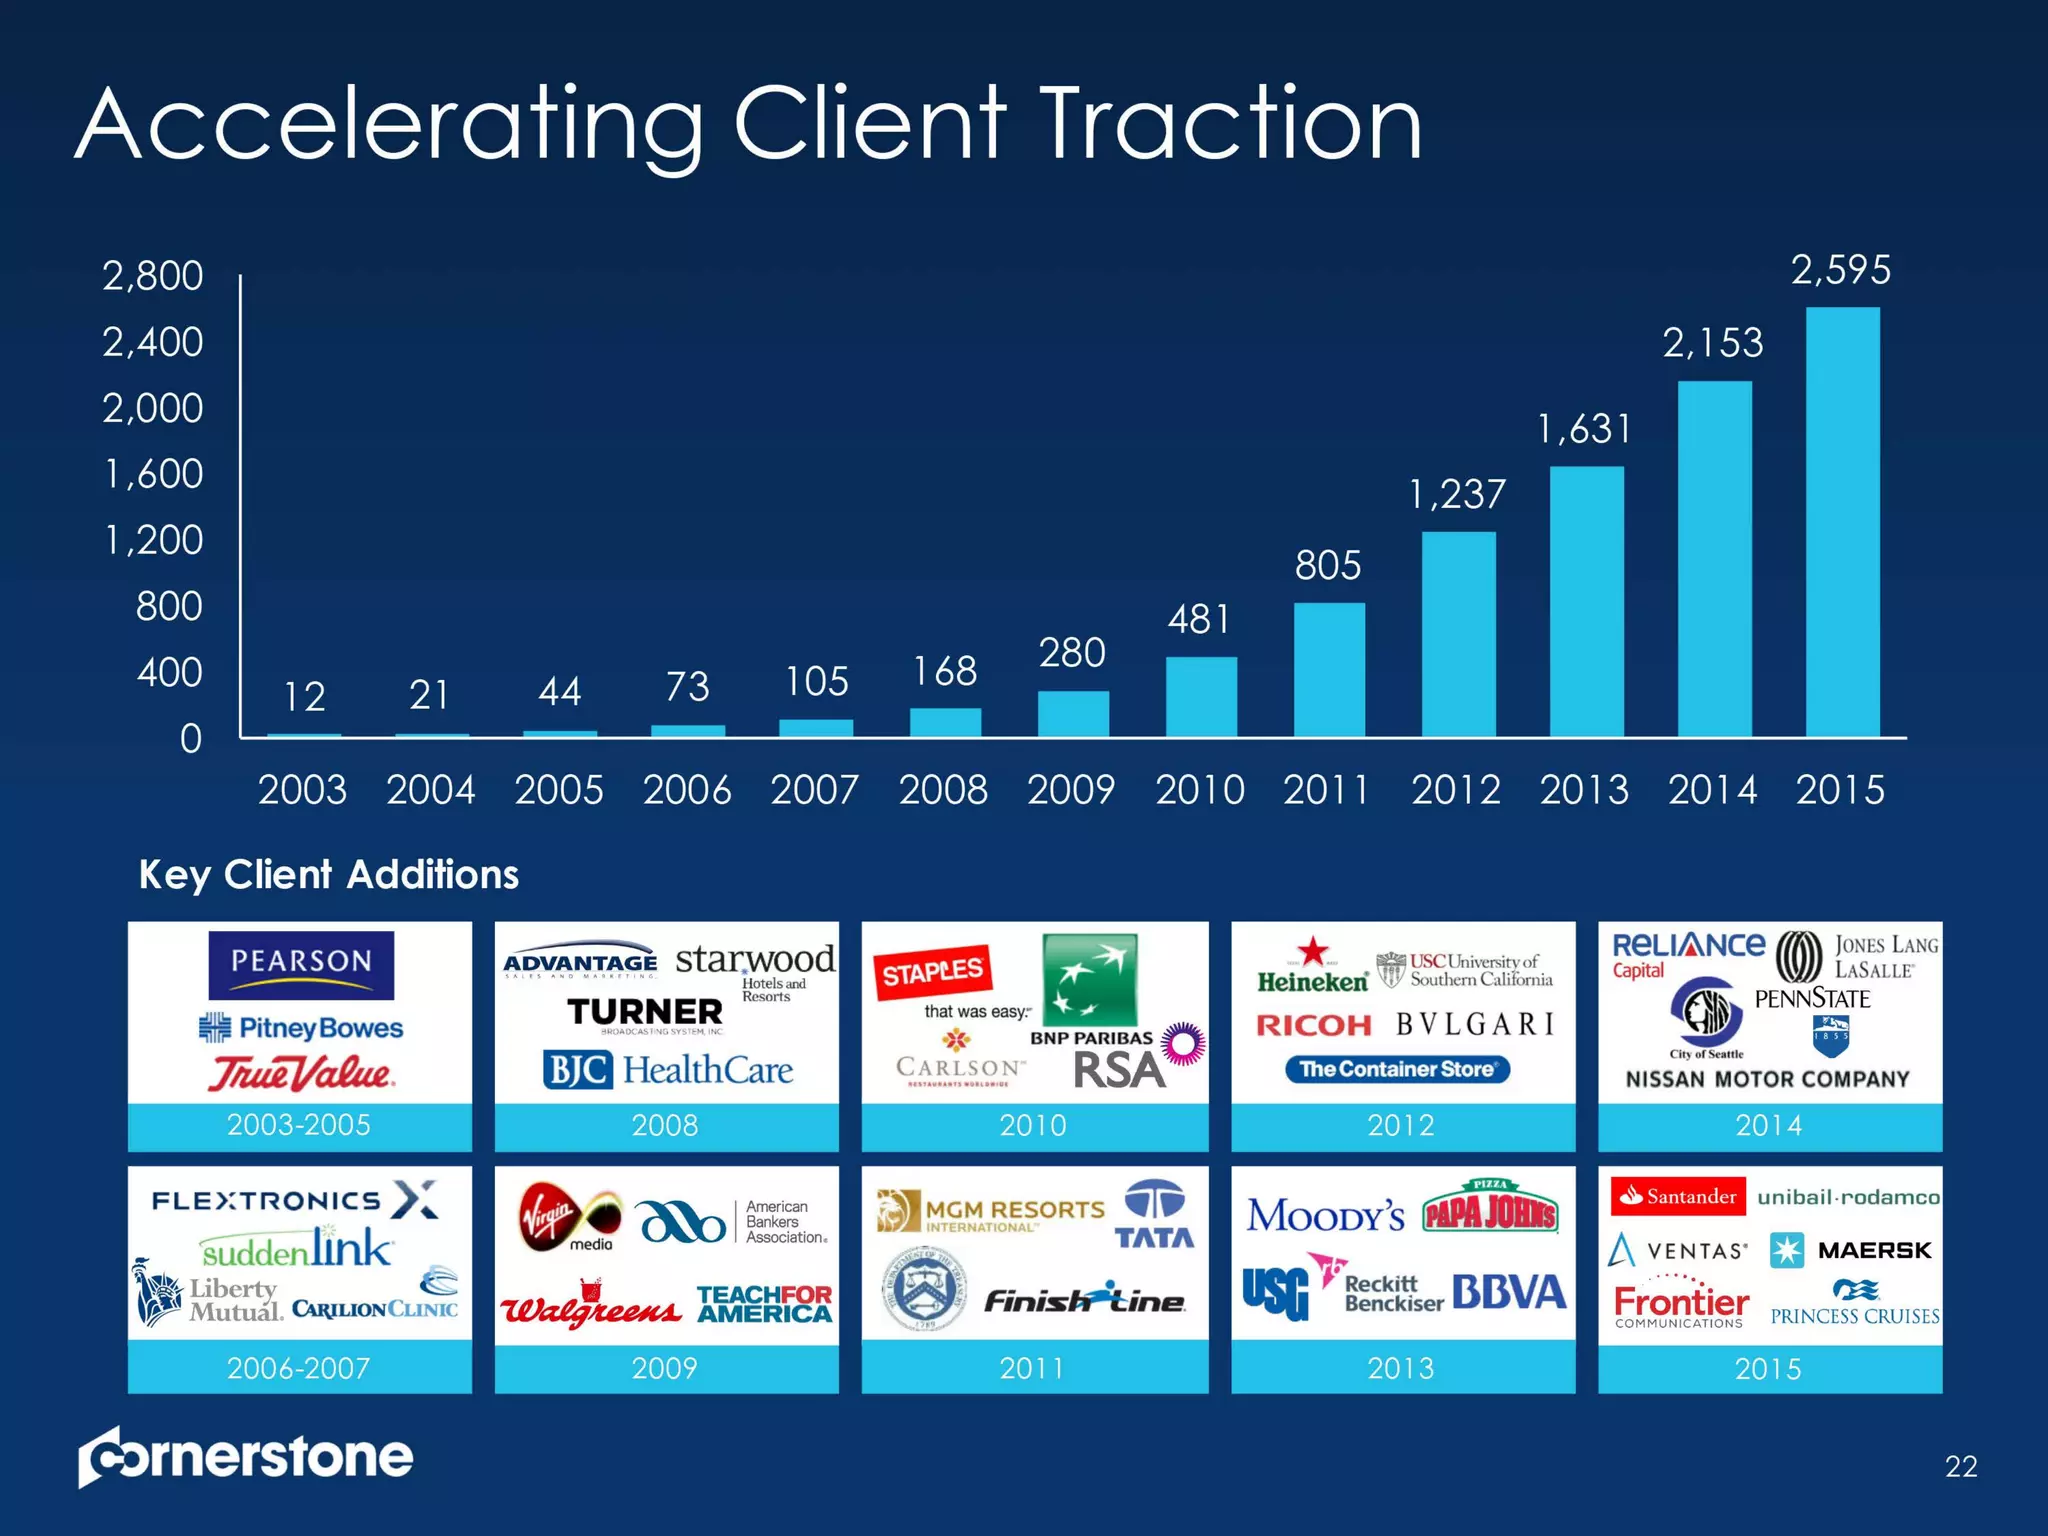
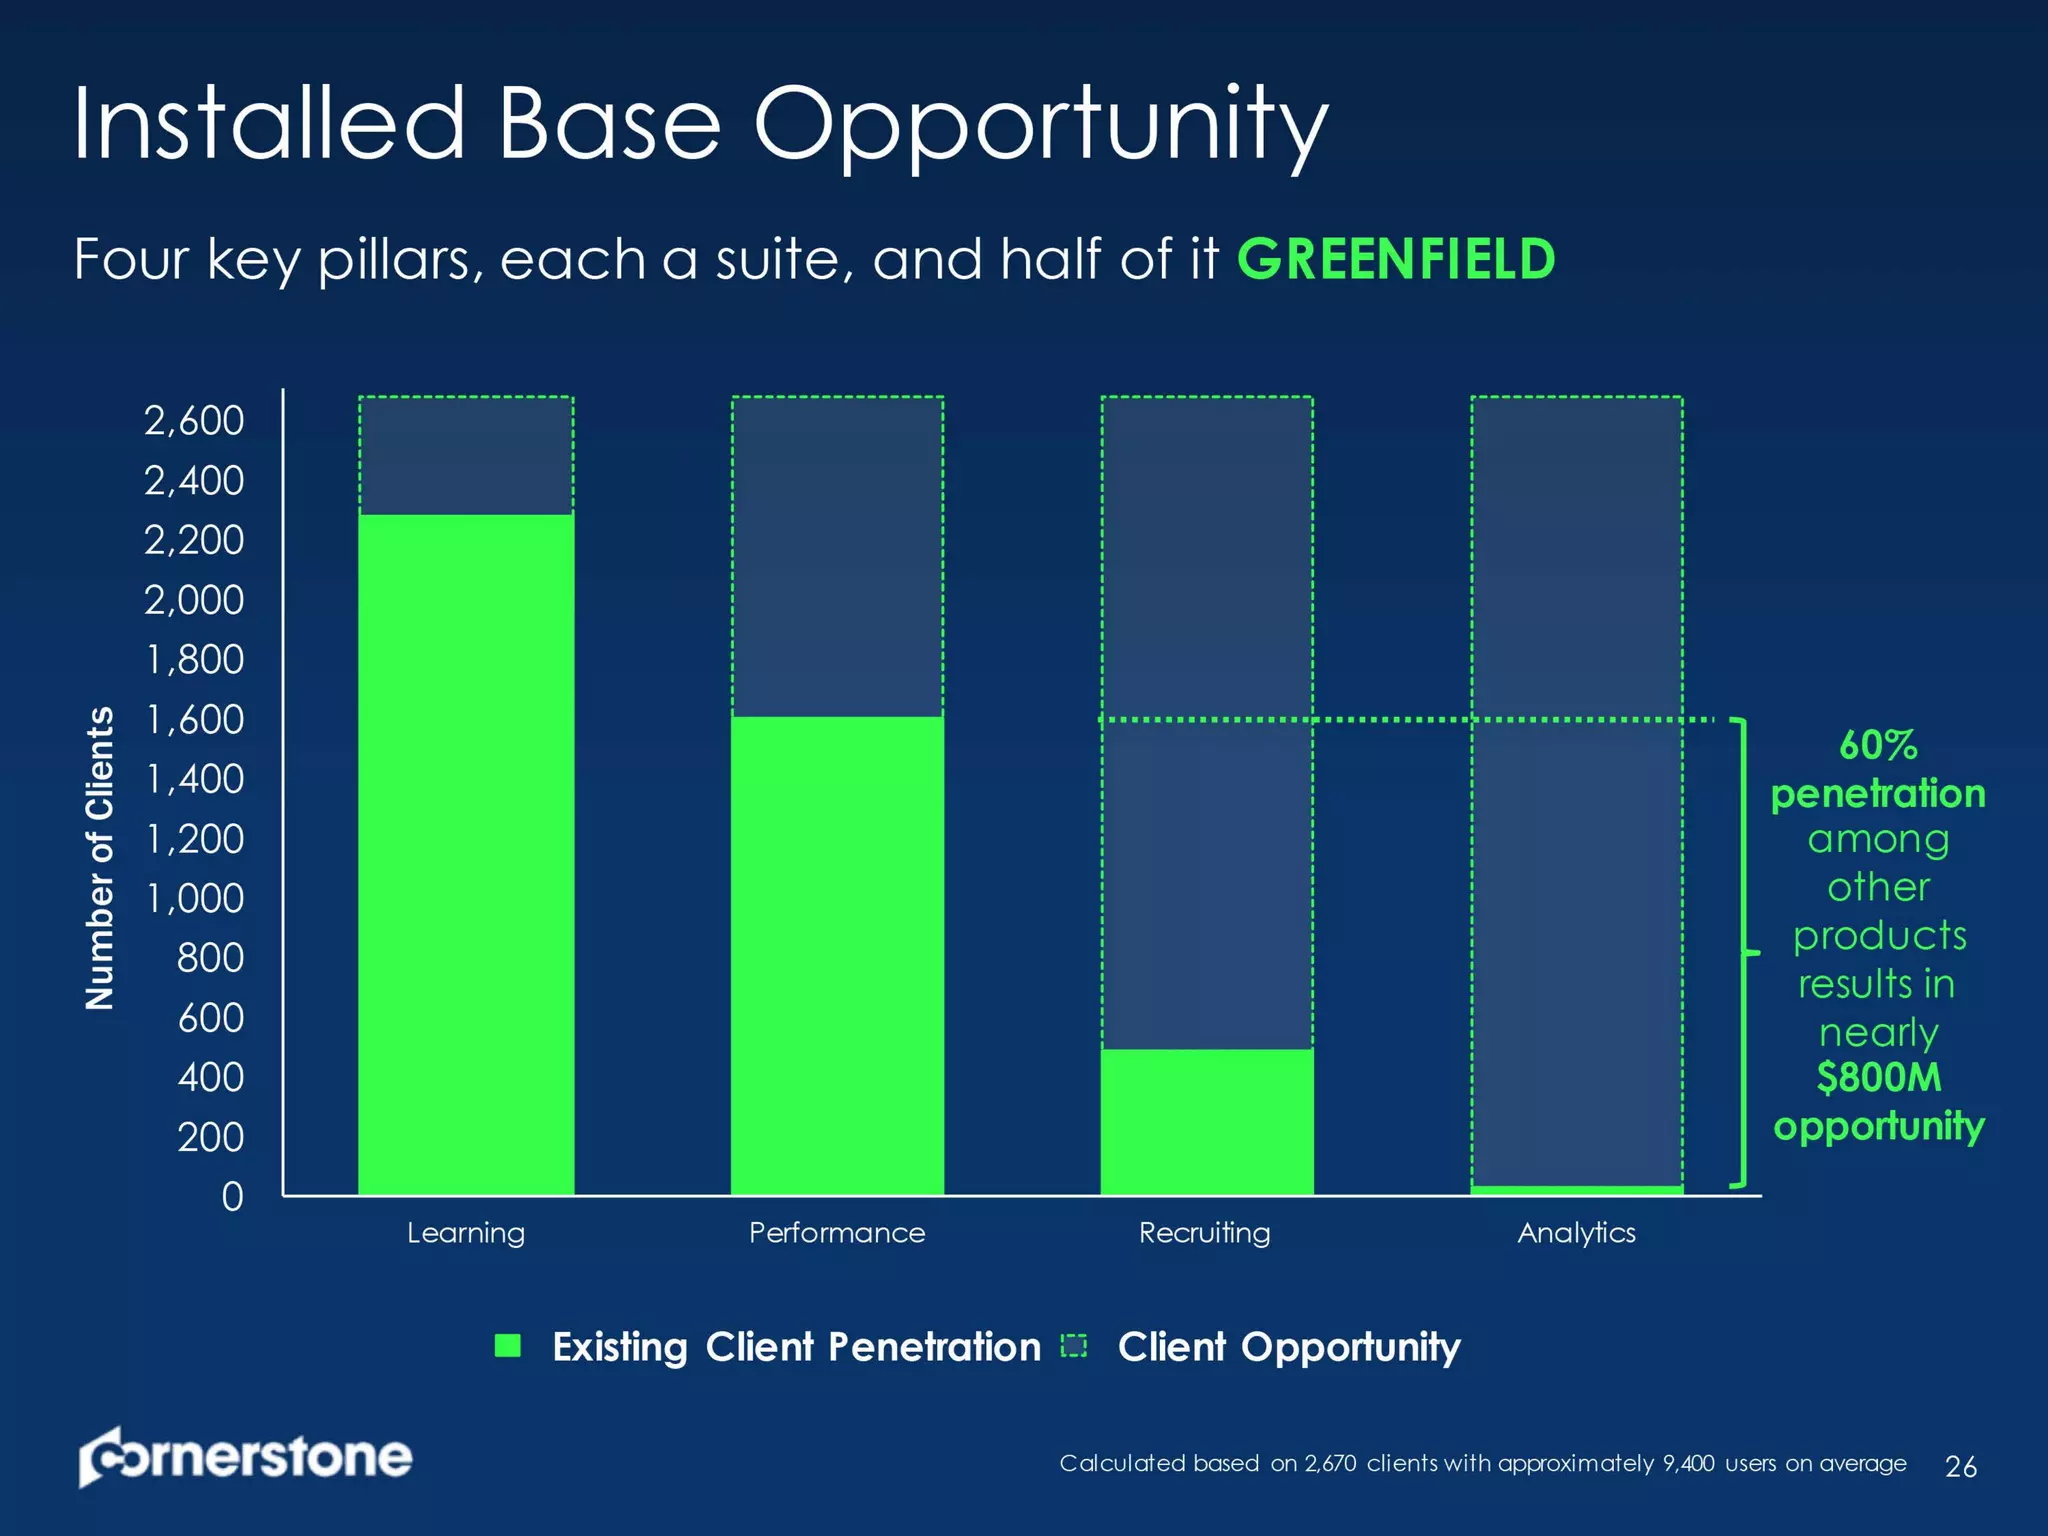
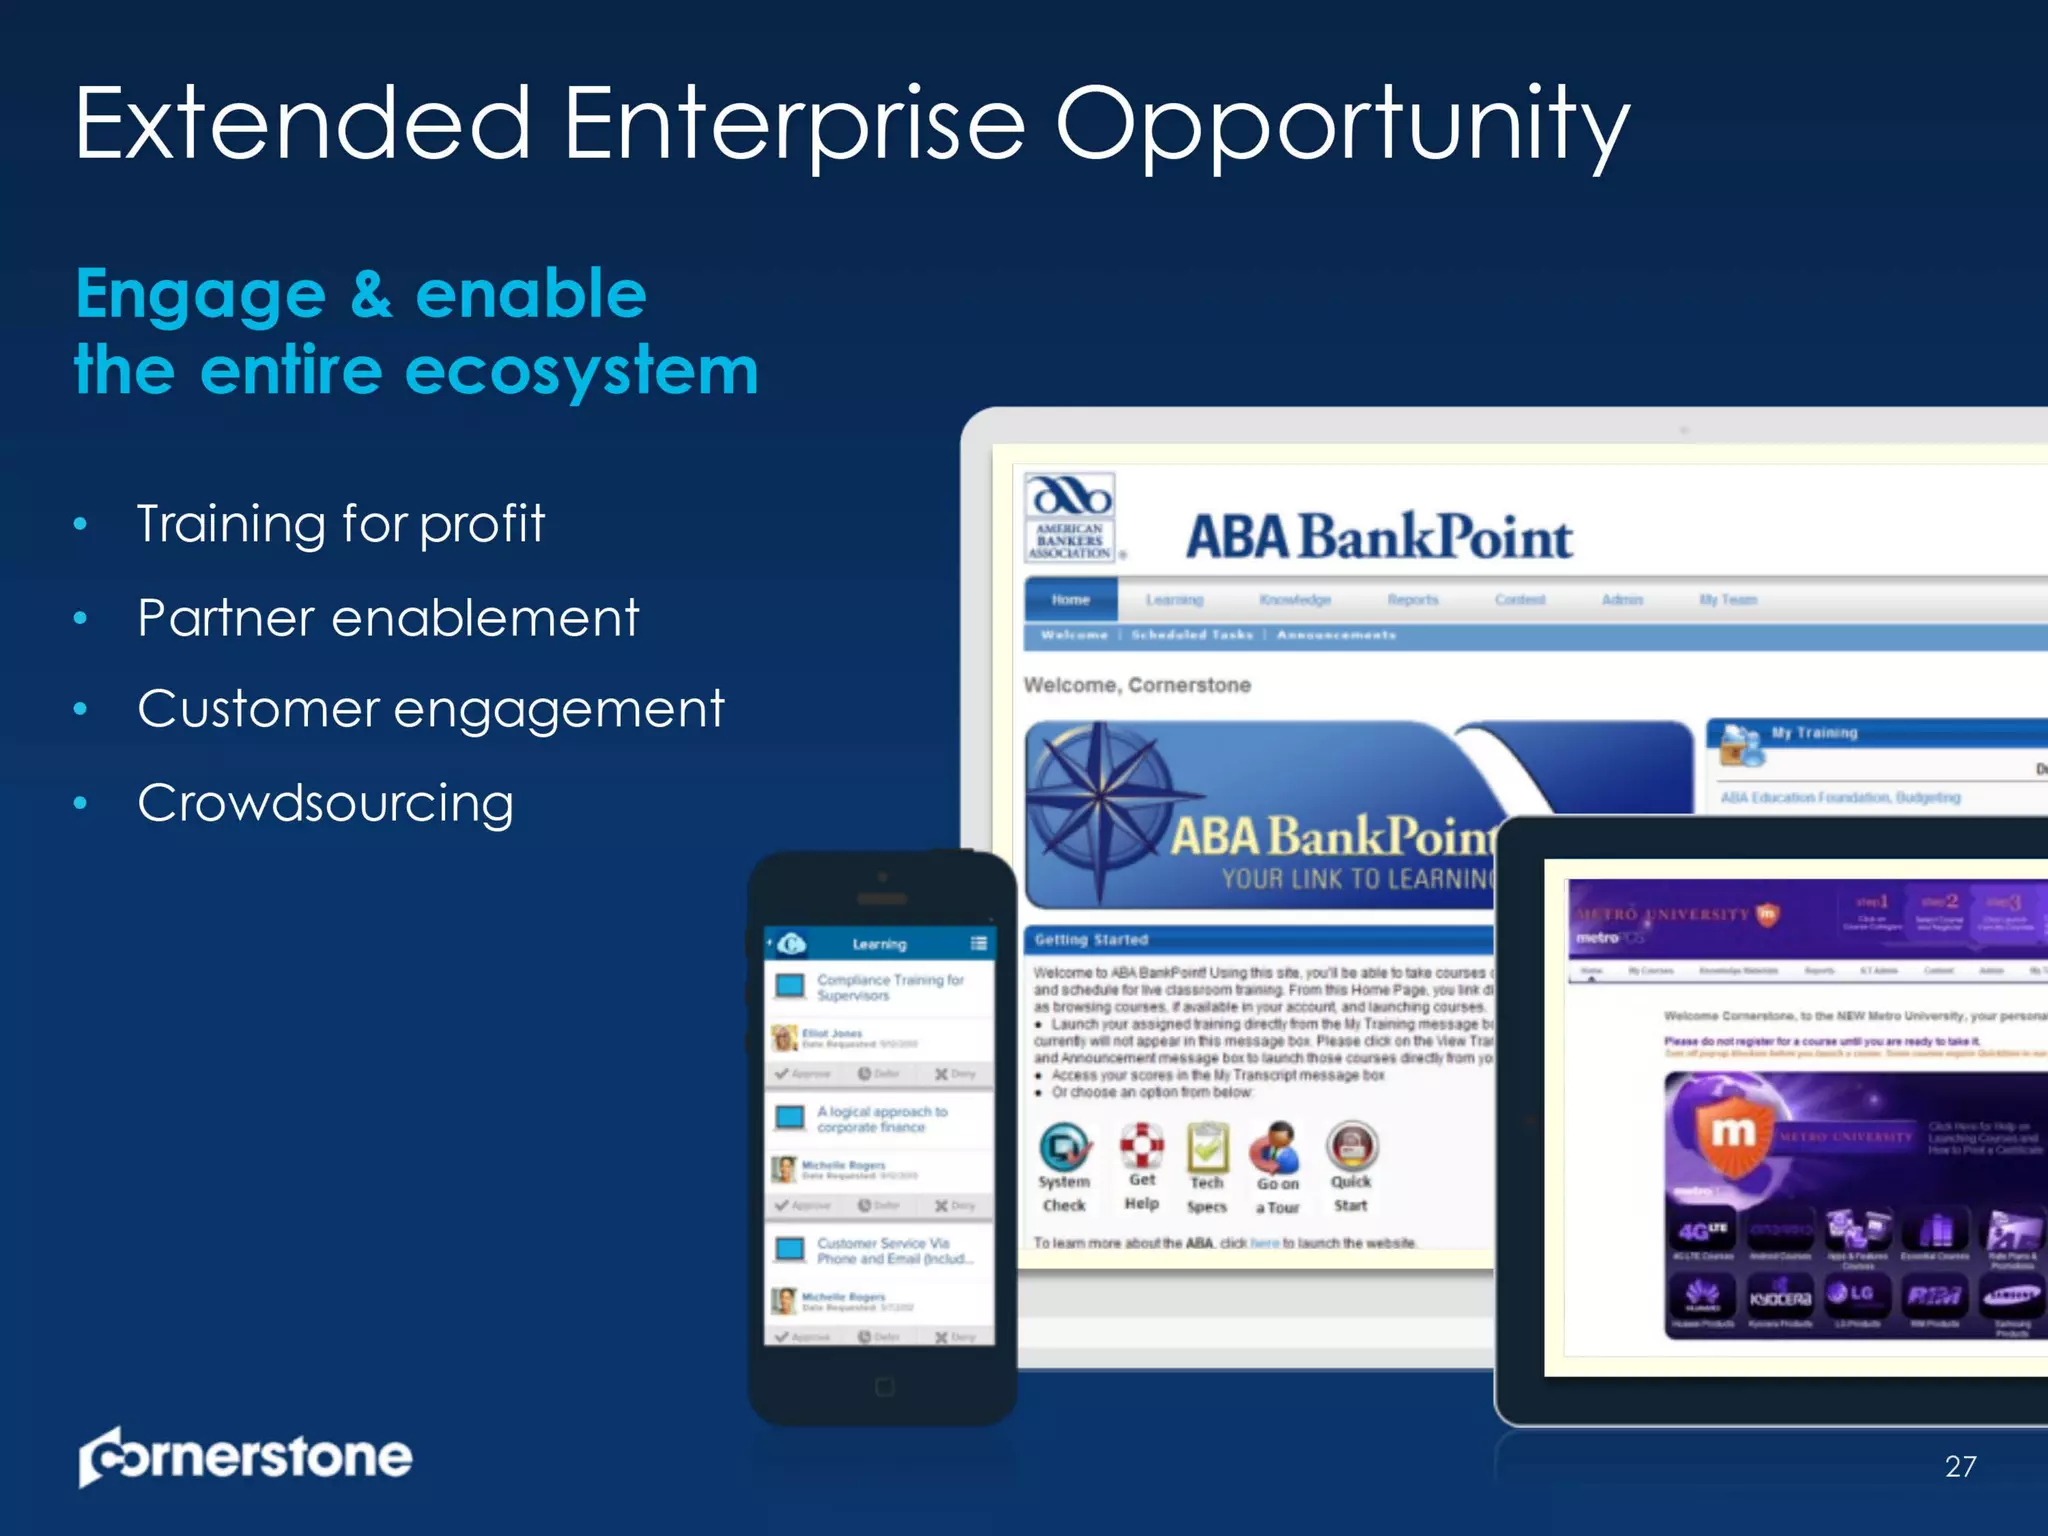
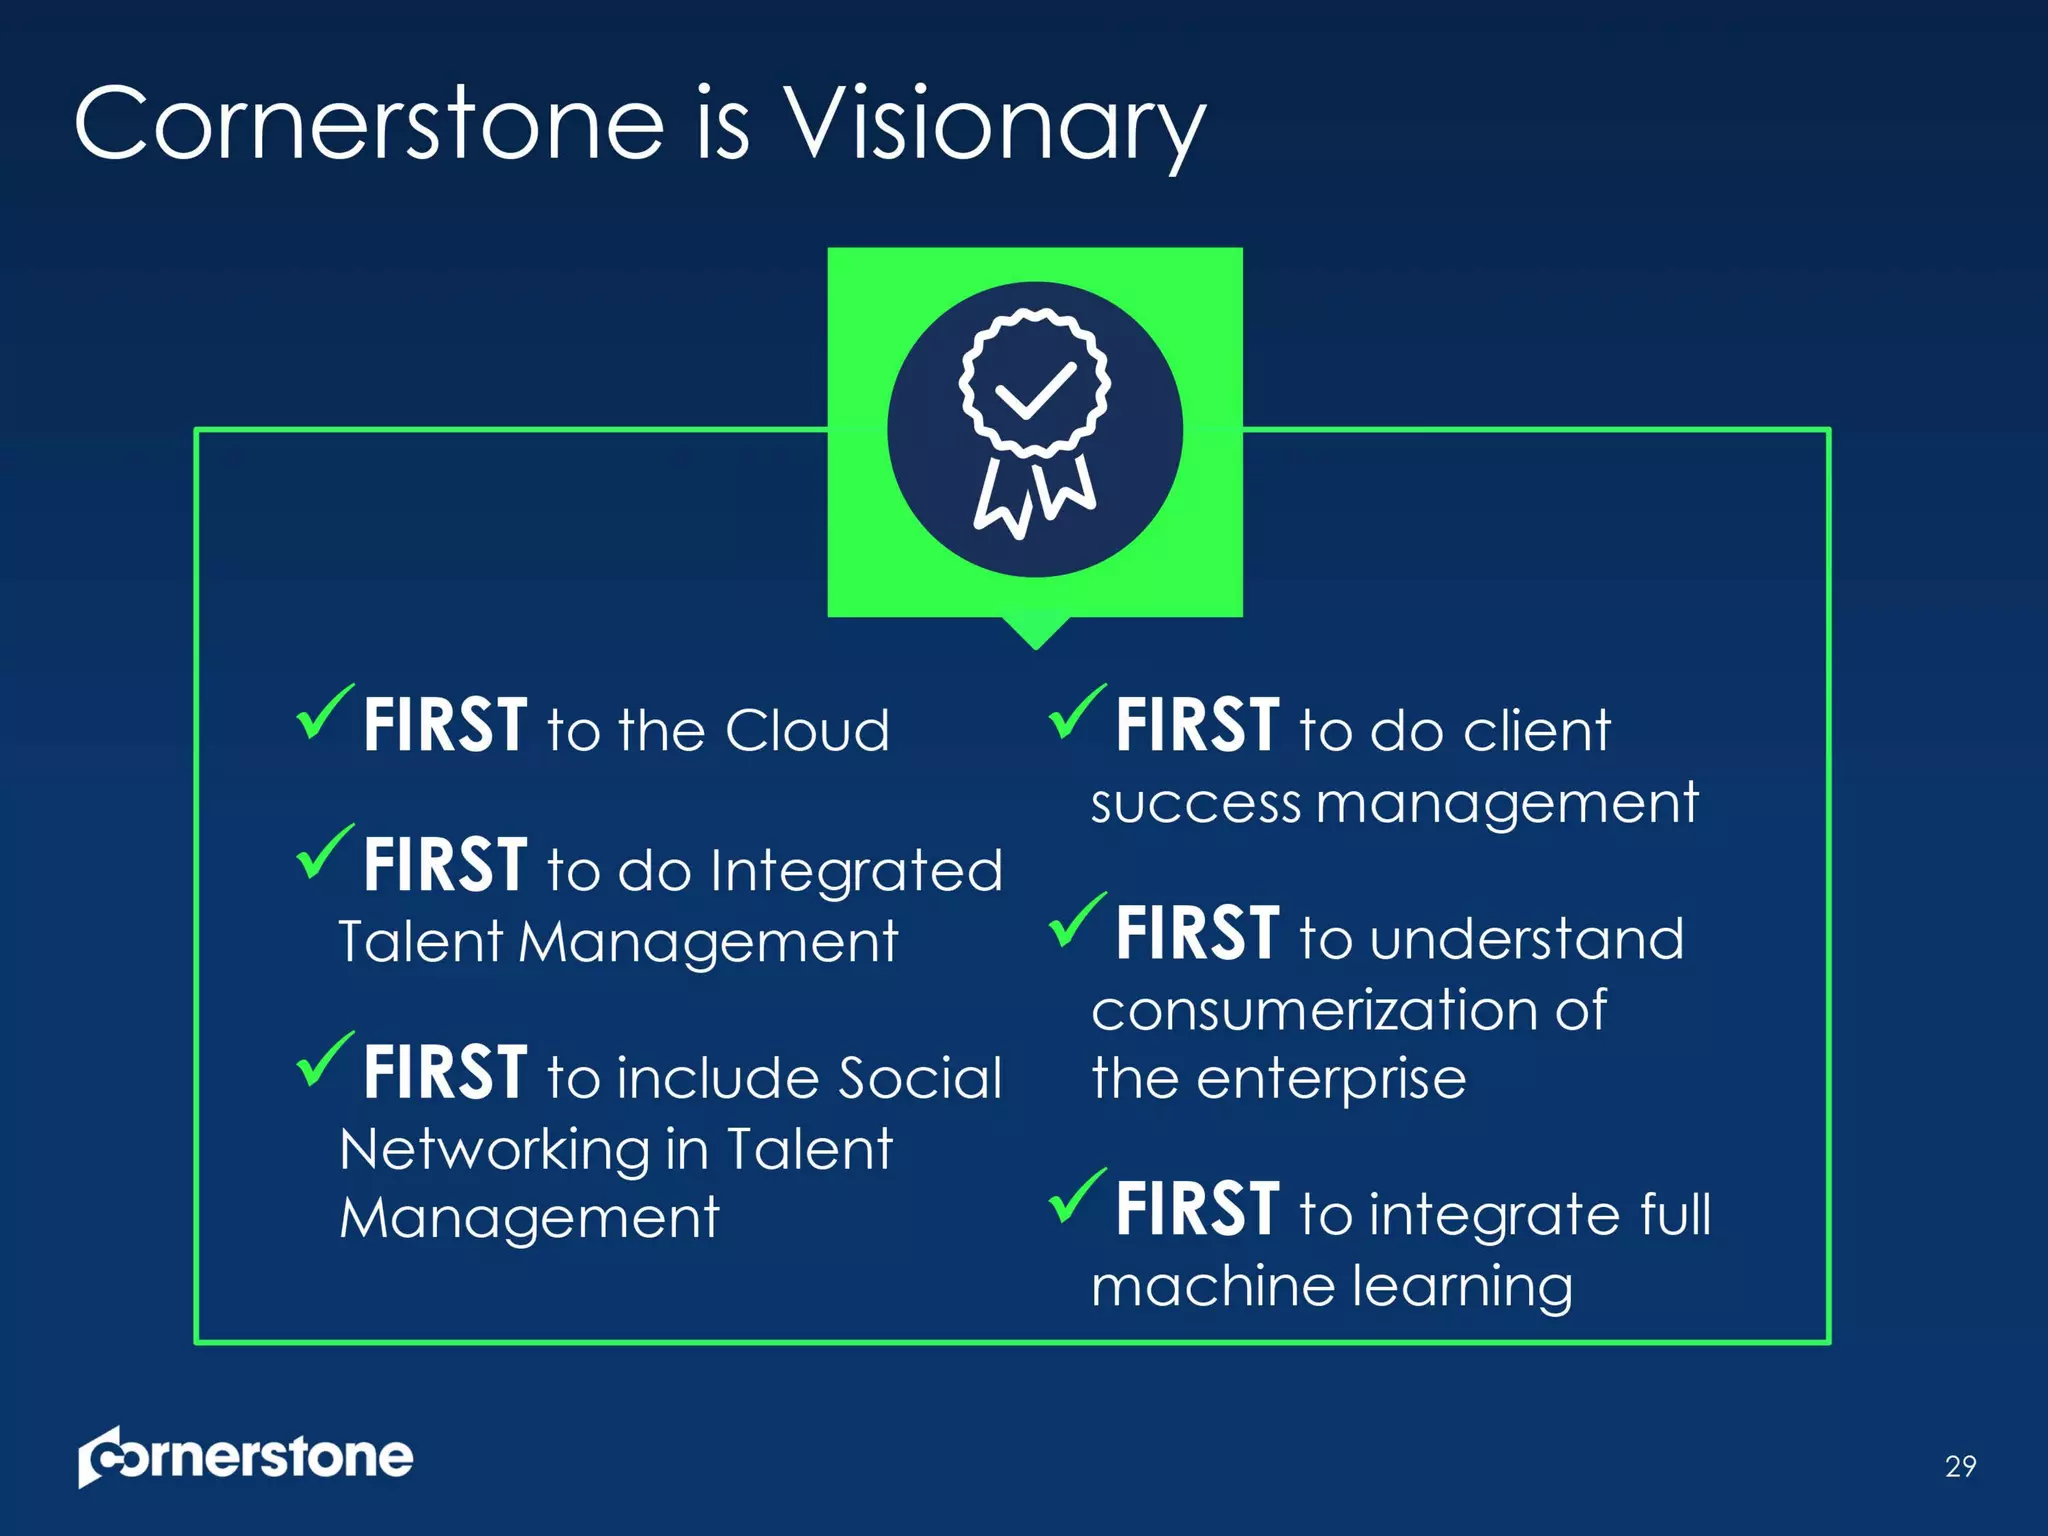
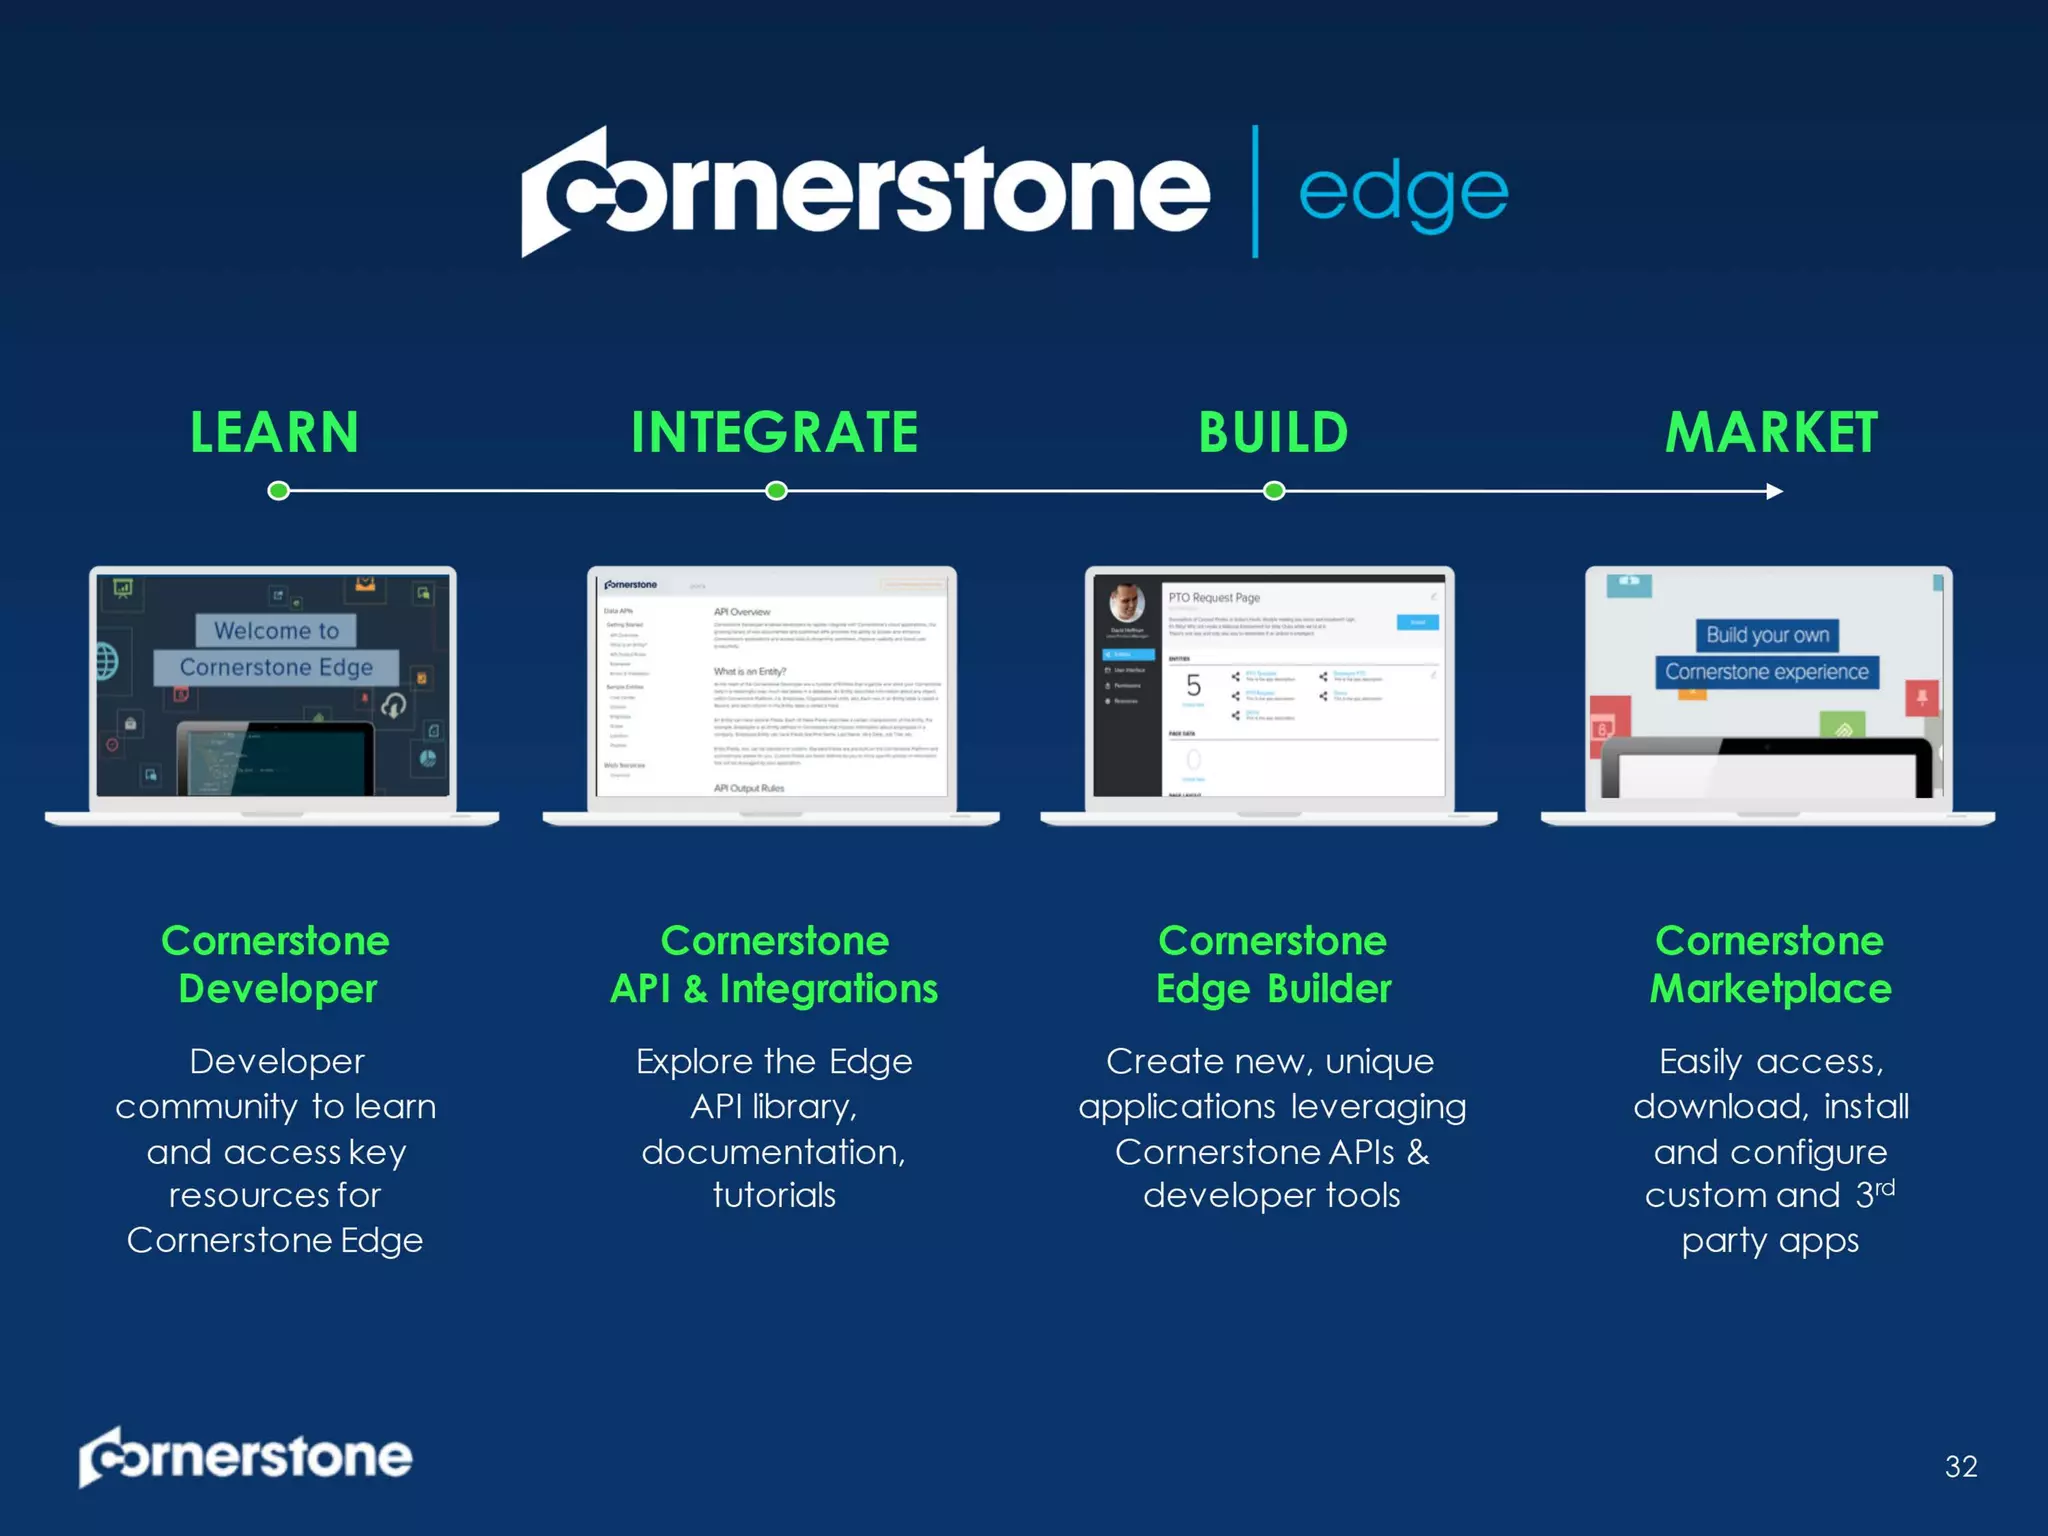
Corporate Overview
Second Quarter 2016
Safe Harbor
This presentation includes forward-looking statements. In this presentation, the words “believe,” “may,” “will,” “estimate,” “continue,” “anticipate,” “intend,”
“expect,” “predict,” “potential” and similar expressions, as they relate to Cornerstone OnDemand, Inc. (“Cornerstone OnDemand” or the “Company”), business and
management, are intended to identify forward-looking statements. In light of the risks and uncertainties outlined below, the future events and circumstances discussed in
this presentation may not occur, and actual results could differ materially from those anticipated or implied in the forward-looking statements. The Company has based
these forward-looking statements largely on its current expectations and projections about future events and financial trends affecting its business. Forward-looking
statements should not be read as guarantees of future performance or results, and will not necessarily be accurate indications of the times at, or by, which such
performance or results will be achieved. Forward-looking statements are based on information available at the date of this presentation and management’s good faith
belief as of such date with respect to future events, and are subject to risks and uncertainties that could cause actual performance or results to differ materially from those
expressed in or suggested by the forward-looking statements. Important factors that could cause such differences include, but are not limited to:
• Statements regarding the Company’s business strategies;
• The Company’s anticipated future operating results and operating expenses;
• The Company’s ability to attract new clients to enter into subscriptions for its solution;
• The Company’s ability to service those clients effectively and induce them to renew and upgrade their deployments of the Company’s solution;
• The Company’s ability to expand its sales organization to address effectively the new industries, geographies and types of organizations the company intends to target;
• The Company’s ability to accurately forecast revenue and appropriately plan its expenses; market acceptance of enhanced solutions, alternate ways of addressing
learning and talent management needs or new technologies generally by the Company and its competitors; continued acceptance of SaaS as an effective method
for delivering learning and talent management solutions and other business management applications; the attraction and retention of qualified employees and key
personnel;
• The Company’s ability to protect and defend its intellectual property; costs associated with defending intellectual property infringement and other claims; events in the
markets for the Company’s solution and alternatives to the Company’s solution, as well as in the United States and global markets generally; future regulatory, judicial
and legislative changes in the Company’s industry; changes in the competitive environment in the Company’s industry and the markets in which the Company
operates; and other factors discussed under “Risk Factors” and “Management’s Discussion and Analysis of Financial Condition and Results of Operations” in the
Company’s periodic reports filed with the Securities and Exchange Commission (the “SEC”).
Forward-looking statements speak only as of the date of this presentation. You should not put undue reliance on any forward-looking statement. The Company assumes
no obligation to update any forward-looking statements to reflect actual results, changes in assumptions or changes in other factors affecting future performance or
results, except to the extent required by applicable laws. If the Company updates one or more forward-looking statements, no inference should be drawn that it will
make additional updates with respect to those or other forward-looking statements.
In considering investing in the Company’s securities, you should read the documents the Company has filed with the SEC for more complete information about the
Company. You may get these documents for free by visiting EDGAR on the SEC Web site at www.sec.gov.
2
Cornerstone Today
1999
Our Evolution
16 Years Ago…
4
2010
Our Evolution
The Last Decade…
5
2016
Our Evolution
Today
6
7Note: User and client count figures exclude Growth Edition and Cornerstone for Salesforce.
CLIENTS
2,600+
USERS
25M
COUNTRIES
191
LANGUAGES
42
OFFICES
19
San Francisco
Santa Monica
Sunnyvale
Sao Paulo
Madrid
Paris
London
Amsterdam
Stockholm
Dusseldorf
Munich
Tel Aviv
Bangalore
Mumbai
Hong Kong
Tokyo
Sydney
Auckland
Today with Global Reach…
As of March 31, 2016
New Delhi
Acquired by
Acquired by
Acquired by
Acquired by
Acquired by
8
…and an Organically-Grown Core Suite
Cornerstone is the Talent
Management Leader
9
Niche Players Visionaries
Challengers Leaders
Magic Quadrant for Talent Management Suites
Lumesse
COMPLETENESS OF VISION
ABILITYTOEXECUTE
Source: Gartner (August 2015)
Deltek (HRsmart)
Technomedia
Haufe PeopleFluent
SumTotal
Halogen Software
Saba
Oracle (Talent Management Cloud)
SAP (SuccessFactors)
Talentsoft
Bolstered by Tier One
Global Partners
10
Select Alliances
OVER TIME, MORE PEOPLE + MORE TO SELL
LEARNING
PERFORMANCE
RECRUITING
ANALYTICS
Now with More People with
More to Sell
Strong Results
13
$11.0
$19.6
$29.3
$46.6
$75.5
$117.9
$185.1
$263.6
$339.7
$0
$50
$100
$150
$200
$250
$300
$350
2007 2008 2009 2010 2011 2012 2013 2014 2015
$15.0
$24.9
$34.5
$60.9
$97.6
$154.3
$231.7
$316.1
$400.5
$0
$60
$120
$180
$240
$300
$360
$420
2007 2008 2009 2010 2011 2012 2013 2014 2015
(in millions) (in millions)
Revenue Bookings
Growing ASPs Across All Geographies
14
+48%
+15%
+44%
North
America Europe,
Middle East
& Africa
Asia Pacific
Note: ASP values reflect year-over-year growth for FY2015.
Growth Across All Metrics
15
$11.0
$19.6
$29.3
$46.6
$75.5
$117.9
$185.1
$263.6
$339.7
2007 2008 2009 2010 2011 2012 2013 2014 2015
Revenue Growth
105
168
280
481
805
1,237
1,631
2,153
2,595
2007 2008 2009 2010 2011 2012 2013 2014 2015
Client Growth
0.9
2.1
3.3
4.9
7.5
10.6
14.0
18.1
23.8
2007 2008 2009 2010 2011 2012 2013 2014 2015
User Growth
(in millions) (in millions)
Note: User and client count figures exclude Growth Edition and Cornerstone for Salesforce.
Clear Path to Profitability
16
$(2.5) $(2.0)
$4.1 $5.0
$12.8
$16.0
$34.0
($10)
$0
$10
$20
$30
$40
2010 2011 2012 2013 2014 2015 2016E
(in millions)
-21.9%
-17.0%
-13.4%
-6.7% -6.4% -6.2%
0.5%
-25%
-20%
-15%
-10%
-5%
0%
5%
2010 2011 2012 2013 2014 2015 2016E
Non-GAAP
Free Cash Flow
Non-GAAP
Net Loss Margin
Note: 2016E values reflect the latest issued guidance. 2016E non-GAAP net loss margin uses the midpoint of the revenue
guidance range of $428 - $434M.
Long-Term Margin Improvement
17
2015 Improvement 2018E
Gross Margin 72% 2-3% 74-75%
S&M (% of Rev.) 54% 10-14% 40-44%
R&D (% of Rev.) 10% - 10%
G&A (% of Rev.) 12% 2% 10%
Operating Margin -4% 14%+ 10%+
Free Cash Flow Margin 5% 11%+ 16%+
Note: All values are non-GAAP metrics.
Our Opportunity
Marching to $1 Billion
Work is Changing
19
WHO
WHAT
WHERE
WHEN
HOW
The Market Need is Real
20
Ben Schiller | May 8, 2015
What Do Workers Want
from the Boss?
Walter Frick | November 3, 2015
When Treating Workers
Well Leads to More
Innovation
Adam Miller | March 26, 2015
3 Things Millennials
Want in a Career
(hint: it’s not more money)
Sylvia Voerhauser-Smith |
October 15, 2015
Is HR Disconnected?
Here’s How HR Can
Reconnect and Embrace
the Future
Lauren Weber | September 30, 2015
How to Get More Women
Into the Workforce
The Market is HUGE
21
25.0M
USERS
ADDRESSABLE MARKET
$31B
88MEST. USERS
CURRENT MARKET
400MADDRESSABLE SEATS
CORNERSTONE
Source: Adapted from Gartner, IDC, US Census Bureau
Opportunities Abound
ü Continued Core Market Sales
ü Global Expansion
ü Market Segmentation
ü Vertical Opportunity
ü Installed Base Opportunity
ü Extended Enterprise
22
Accelerating Client Traction
23
2003-2005 2010 2012 20142008
2009 2011 2013 20152006-2007
Key Client Additions
12 21 44 73 105 168 280
481
805
1,237
1,631
2,153
2,595
0
400
800
1,200
1,600
2,000
2,400
2,800
2003 2004 2005 2006 2007 2008 2009 2010 2011 2012 2013 2014 2015
Expanded Global Footprint
24
Europe, Middle East & Africa
Select Notable Clients Select Notable Clients
JAPAN CHINA
AUSTRALIA
JAPAN
INDIACHINA
Asia Pacific
SWITZERLAND SPAIN
NETHERLANDSFRANCEUNITED KINGDOM
GERMANY
8 29
OFFICES LANGUAGES EST. USERS
7 9 1.9M
OFFICES LANGUAGES EST. USERS
6.8M
HAVE 2+
MODULES
2/3
Installed Base Penetration
2+ 2+ 2+ 2+ 2+ 2+ 2+ 2+ 2+ 2+
2+ 2+ 2+ 2+ 2+ 2+ 2+ 2+ 2+ 2+
3+ 3+ 3+ 3+ 3+ 3+ 3+ 3+ 3+ 3+
3+ 3+ 3+
HAVE 3+
MODULES
1/2Nearly
26
More
Than
2+
Installed Base Opportunity
27
0
200
400
600
800
1,000
1,200
1,400
1,600
1,800
2,000
2,200
2,400
2,600
Learning Performance Recruiting Analytics
Existing Client Penetration Client Opportunity
NumberofClients
Four key pillars, each a suite, and half of it GREENFIELD
Calculated based on 2,670 clients with approximately 9,400 users on average
60%
penetration
among
other
products
results in
nearly
$800M
opportunity
Extended Enterprise Opportunity
28
Engage & enable
the entire ecosystem
• Training for profit
• Partner enablement
• Customer engagement
• Crowdsourcing
The Future
Beyond 2016
30
üFIRST to the Cloud
üFIRST to do Integrated
Talent Management
üFIRST to include Social
Networking in Talent
Management
üFIRST to do client
success management
üFIRST to understand
consumerization of
the enterprise
üFIRST to integrate full
machine learning
Cornerstone is Visionary
Cornerstone has “Massive Data”
31
User
ü Position
ü Previous Position
ü Education
ü Skills
ü Certifications
ü Accomplishments
ü Languages
ü Organization
ü Preferences
Collaboration
ü Connections
ü Live Feed (Status)
ü Feedback
ü Actions
ü Snapshot
ü Teams
ü Discussions
ü Badges
ü Likes
ü Comments
Talent Organization
ü Transcript
ü Performance
ü Skills
ü Goals
ü Assessments
ü Dev Plans
ü Succession
ü Compensation
ü Applicants
ü Applicant Status
ü Industry
ü Business Unit
ü Department
ü Division
ü Region
ü Groups
ü Hierarchies
ü Cost Center
ü Grade
ü Location
25.0M USERS | 191 COUNTRIES | DECADE OF DATA
32
REPORT
Cornerstone
Reporting
Standard & custom reports
embedded
with Cornerstone
DISCOVER
Cornerstone
View
Highly visual dashboards
that can easily slice/ dice
talent information
PLAN
Cornerstone
Planning
Big data solution for workforce
planning
PREDICT
Cornerstone
Insights
Predictive analytics
for managing
talent decisions
Cornerstone Analytics
32
33
IMPORT INTEGRATE
Edge Import
Easily map and load data into
Cornerstone
Edge Integrate
Easy build & manage integrations
with 3rd-party apps
BUILD
Edge Build
Create new apps using
Edge APIs & developer tools
The Power of Platform
34
Multi-tenant REST APIs Mobile-Ready
Cornerstone Apps Partner Apps Custom Apps
One unified suite to recruit,
train, develop, & connect
employees
Marketplace of apps integrated
& embedded within
Cornerstone
Client-specific applications
designed & built by clients
or partners
Thank You!

Featured Presentation

  • 1.
  • 2.
    Safe Harbor This presentationincludes forward-looking statements. In this presentation, the words “believe,” “may,” “will,” “estimate,” “continue,” “anticipate,” “intend,” “expect,” “predict,” “potential” and similar expressions, as they relate to Cornerstone OnDemand, Inc. (“Cornerstone OnDemand” or the “Company”), business and management, are intended to identify forward-looking statements. In light of the risks and uncertainties outlined below, the future events and circumstances discussed in this presentation may not occur, and actual results could differ materially from those anticipated or implied in the forward-looking statements. The Company has based these forward-looking statements largely on its current expectations and projections about future events and financial trends affecting its business. Forward-looking statements should not be read as guarantees of future performance or results, and will not necessarily be accurate indications of the times at, or by, which such performance or results will be achieved. Forward-looking statements are based on information available at the date of this presentation and management’s good faith belief as of such date with respect to future events, and are subject to risks and uncertainties that could cause actual performance or results to differ materially from those expressed in or suggested by the forward-looking statements. Important factors that could cause such differences include, but are not limited to: • Statements regarding the Company’s business strategies; • The Company’s anticipated future operating results and operating expenses; • The Company’s ability to attract new clients to enter into subscriptions for its solution; • The Company’s ability to service those clients effectively and induce them to renew and upgrade their deployments of the Company’s solution; • The Company’s ability to expand its sales organization to address effectively the new industries, geographies and types of organizations the company intends to target; • The Company’s ability to accurately forecast revenue and appropriately plan its expenses; market acceptance of enhanced solutions, alternate ways of addressing learning and talent management needs or new technologies generally by the Company and its competitors; continued acceptance of SaaS as an effective method for delivering learning and talent management solutions and other business management applications; the attraction and retention of qualified employees and key personnel; • The Company’s ability to protect and defend its intellectual property; costs associated with defending intellectual property infringement and other claims; events in the markets for the Company’s solution and alternatives to the Company’s solution, as well as in the United States and global markets generally; future regulatory, judicial and legislative changes in the Company’s industry; changes in the competitive environment in the Company’s industry and the markets in which the Company operates; and other factors discussed under “Risk Factors” and “Management’s Discussion and Analysis of Financial Condition and Results of Operations” in the Company’s periodic reports filed with the Securities and Exchange Commission (the “SEC”). Forward-looking statements speak only as of the date of this presentation. You should not put undue reliance on any forward-looking statement. The Company assumes no obligation to update any forward-looking statements to reflect actual results, changes in assumptions or changes in other factors affecting future performance or results, except to the extent required by applicable laws. If the Company updates one or more forward-looking statements, no inference should be drawn that it will make additional updates with respect to those or other forward-looking statements. In considering investing in the Company’s securities, you should read the documents the Company has filed with the SEC for more complete information about the Company. You may get these documents for free by visiting EDGAR on the SEC Web site at www.sec.gov. 2
  • 3.
  • 4.
  • 5.
  • 6.
  • 7.
    7Note: User andclient count figures exclude Growth Edition and Cornerstone for Salesforce. CLIENTS 2,600+ USERS 25M COUNTRIES 191 LANGUAGES 42 OFFICES 19 San Francisco Santa Monica Sunnyvale Sao Paulo Madrid Paris London Amsterdam Stockholm Dusseldorf Munich Tel Aviv Bangalore Mumbai Hong Kong Tokyo Sydney Auckland Today with Global Reach… As of March 31, 2016 New Delhi
  • 8.
    Acquired by Acquired by Acquiredby Acquired by Acquired by 8 …and an Organically-Grown Core Suite
  • 9.
    Cornerstone is theTalent Management Leader 9 Niche Players Visionaries Challengers Leaders Magic Quadrant for Talent Management Suites Lumesse COMPLETENESS OF VISION ABILITYTOEXECUTE Source: Gartner (August 2015) Deltek (HRsmart) Technomedia Haufe PeopleFluent SumTotal Halogen Software Saba Oracle (Talent Management Cloud) SAP (SuccessFactors) Talentsoft
  • 10.
    Bolstered by TierOne Global Partners 10 Select Alliances
  • 12.
    OVER TIME, MOREPEOPLE + MORE TO SELL LEARNING PERFORMANCE RECRUITING ANALYTICS Now with More People with More to Sell
  • 13.
    Strong Results 13 $11.0 $19.6 $29.3 $46.6 $75.5 $117.9 $185.1 $263.6 $339.7 $0 $50 $100 $150 $200 $250 $300 $350 2007 20082009 2010 2011 2012 2013 2014 2015 $15.0 $24.9 $34.5 $60.9 $97.6 $154.3 $231.7 $316.1 $400.5 $0 $60 $120 $180 $240 $300 $360 $420 2007 2008 2009 2010 2011 2012 2013 2014 2015 (in millions) (in millions) Revenue Bookings
  • 14.
    Growing ASPs AcrossAll Geographies 14 +48% +15% +44% North America Europe, Middle East & Africa Asia Pacific Note: ASP values reflect year-over-year growth for FY2015.
  • 15.
    Growth Across AllMetrics 15 $11.0 $19.6 $29.3 $46.6 $75.5 $117.9 $185.1 $263.6 $339.7 2007 2008 2009 2010 2011 2012 2013 2014 2015 Revenue Growth 105 168 280 481 805 1,237 1,631 2,153 2,595 2007 2008 2009 2010 2011 2012 2013 2014 2015 Client Growth 0.9 2.1 3.3 4.9 7.5 10.6 14.0 18.1 23.8 2007 2008 2009 2010 2011 2012 2013 2014 2015 User Growth (in millions) (in millions) Note: User and client count figures exclude Growth Edition and Cornerstone for Salesforce.
  • 16.
    Clear Path toProfitability 16 $(2.5) $(2.0) $4.1 $5.0 $12.8 $16.0 $34.0 ($10) $0 $10 $20 $30 $40 2010 2011 2012 2013 2014 2015 2016E (in millions) -21.9% -17.0% -13.4% -6.7% -6.4% -6.2% 0.5% -25% -20% -15% -10% -5% 0% 5% 2010 2011 2012 2013 2014 2015 2016E Non-GAAP Free Cash Flow Non-GAAP Net Loss Margin Note: 2016E values reflect the latest issued guidance. 2016E non-GAAP net loss margin uses the midpoint of the revenue guidance range of $428 - $434M.
  • 17.
    Long-Term Margin Improvement 17 2015Improvement 2018E Gross Margin 72% 2-3% 74-75% S&M (% of Rev.) 54% 10-14% 40-44% R&D (% of Rev.) 10% - 10% G&A (% of Rev.) 12% 2% 10% Operating Margin -4% 14%+ 10%+ Free Cash Flow Margin 5% 11%+ 16%+ Note: All values are non-GAAP metrics.
  • 18.
  • 19.
  • 20.
    The Market Needis Real 20 Ben Schiller | May 8, 2015 What Do Workers Want from the Boss? Walter Frick | November 3, 2015 When Treating Workers Well Leads to More Innovation Adam Miller | March 26, 2015 3 Things Millennials Want in a Career (hint: it’s not more money) Sylvia Voerhauser-Smith | October 15, 2015 Is HR Disconnected? Here’s How HR Can Reconnect and Embrace the Future Lauren Weber | September 30, 2015 How to Get More Women Into the Workforce
  • 21.
    The Market isHUGE 21 25.0M USERS ADDRESSABLE MARKET $31B 88MEST. USERS CURRENT MARKET 400MADDRESSABLE SEATS CORNERSTONE Source: Adapted from Gartner, IDC, US Census Bureau
  • 22.
    Opportunities Abound ü ContinuedCore Market Sales ü Global Expansion ü Market Segmentation ü Vertical Opportunity ü Installed Base Opportunity ü Extended Enterprise 22
  • 23.
    Accelerating Client Traction 23 2003-20052010 2012 20142008 2009 2011 2013 20152006-2007 Key Client Additions 12 21 44 73 105 168 280 481 805 1,237 1,631 2,153 2,595 0 400 800 1,200 1,600 2,000 2,400 2,800 2003 2004 2005 2006 2007 2008 2009 2010 2011 2012 2013 2014 2015
  • 24.
    Expanded Global Footprint 24 Europe,Middle East & Africa Select Notable Clients Select Notable Clients JAPAN CHINA AUSTRALIA JAPAN INDIACHINA Asia Pacific SWITZERLAND SPAIN NETHERLANDSFRANCEUNITED KINGDOM GERMANY 8 29 OFFICES LANGUAGES EST. USERS 7 9 1.9M OFFICES LANGUAGES EST. USERS 6.8M
  • 26.
    HAVE 2+ MODULES 2/3 Installed BasePenetration 2+ 2+ 2+ 2+ 2+ 2+ 2+ 2+ 2+ 2+ 2+ 2+ 2+ 2+ 2+ 2+ 2+ 2+ 2+ 2+ 3+ 3+ 3+ 3+ 3+ 3+ 3+ 3+ 3+ 3+ 3+ 3+ 3+ HAVE 3+ MODULES 1/2Nearly 26 More Than 2+
  • 27.
    Installed Base Opportunity 27 0 200 400 600 800 1,000 1,200 1,400 1,600 1,800 2,000 2,200 2,400 2,600 LearningPerformance Recruiting Analytics Existing Client Penetration Client Opportunity NumberofClients Four key pillars, each a suite, and half of it GREENFIELD Calculated based on 2,670 clients with approximately 9,400 users on average 60% penetration among other products results in nearly $800M opportunity
  • 28.
    Extended Enterprise Opportunity 28 Engage& enable the entire ecosystem • Training for profit • Partner enablement • Customer engagement • Crowdsourcing
  • 29.
  • 30.
    30 üFIRST to theCloud üFIRST to do Integrated Talent Management üFIRST to include Social Networking in Talent Management üFIRST to do client success management üFIRST to understand consumerization of the enterprise üFIRST to integrate full machine learning Cornerstone is Visionary
  • 31.
    Cornerstone has “MassiveData” 31 User ü Position ü Previous Position ü Education ü Skills ü Certifications ü Accomplishments ü Languages ü Organization ü Preferences Collaboration ü Connections ü Live Feed (Status) ü Feedback ü Actions ü Snapshot ü Teams ü Discussions ü Badges ü Likes ü Comments Talent Organization ü Transcript ü Performance ü Skills ü Goals ü Assessments ü Dev Plans ü Succession ü Compensation ü Applicants ü Applicant Status ü Industry ü Business Unit ü Department ü Division ü Region ü Groups ü Hierarchies ü Cost Center ü Grade ü Location 25.0M USERS | 191 COUNTRIES | DECADE OF DATA
  • 32.
    32 REPORT Cornerstone Reporting Standard & customreports embedded with Cornerstone DISCOVER Cornerstone View Highly visual dashboards that can easily slice/ dice talent information PLAN Cornerstone Planning Big data solution for workforce planning PREDICT Cornerstone Insights Predictive analytics for managing talent decisions Cornerstone Analytics 32
  • 33.
    33 IMPORT INTEGRATE Edge Import Easilymap and load data into Cornerstone Edge Integrate Easy build & manage integrations with 3rd-party apps BUILD Edge Build Create new apps using Edge APIs & developer tools
  • 34.
    The Power ofPlatform 34 Multi-tenant REST APIs Mobile-Ready Cornerstone Apps Partner Apps Custom Apps One unified suite to recruit, train, develop, & connect employees Marketplace of apps integrated & embedded within Cornerstone Client-specific applications designed & built by clients or partners
  • 35.