Facebook Inc is a social networking company that provides development tools and APIs to enable developers to integrate with Facebook. The report rates Facebook Inc a Buy due to robust revenue growth, a strong financial position with low debt, good cash flow, growing earnings per share, and expanding profit margins. Peer companies are analyzed based on revenue growth, EBITDA margins, earnings yield, and other financial metrics. The internet software and services industry is highly competitive with consolidation and pressure on margins.
1. Facebook was founded in 2004 and had its IPO in 2012, initially pricing shares at $38. It now has over 1.5 billion monthly active users and generates nearly all of its revenue from advertising.
2. Facebook has posted impressive revenue growth in recent years, driven by growth in mobile advertising, but greater operating costs have constrained profit growth.
3. The company is well-positioned for continued growth as it benefits from increasing global internet usage and engagement, especially on mobile. It is investing heavily to help new projects and acquisitions reach scale.
Electronic Arts reported stronger-than-expected revenue in Q2 driven by FIFA sales, but shares fell after hours as guidance did not fully reflect the upside. The analyst maintains a Buy rating due to EA's digital strategy and potential to monetize franchises on new platforms. Estimates were revised slightly upward for Q3 and FY2011 to account for the delayed NBA Elite title. The price target is $19 based on a higher forward PE multiple relative to EA's franchises and digital focus. Risks include title performance and macro factors.
Intact Financial Corporation is Canada's largest property and casualty insurer with a market share of approximately 17%. Over the past 10 years, IFC has consistently outperformed the industry in key metrics such as return on equity, premium growth, and combined ratio. IFC attributes its success to scale advantages, sophisticated pricing and underwriting, in-house claims expertise, and strategic capital management. IFC aims to continue growing organically and through acquisitions to capitalize on ongoing consolidation opportunities in the fragmented Canadian P&C insurance market.
The document analyzes Twitter and provides a price target of $23 for the end of 2014 based on comparable company analysis and a discounted cash flow valuation model. It finds that while Twitter is growing rapidly, it remains unprofitable and faces significant competition. Risks to the stock include challenges becoming profitable and potential decreases in tax benefits that help reduce costs.
The Blue Sky Report® - A Kerrigan Quarterly – First Quarter 2020 PreviewErin Kerrigan
- The first quarter of 2020 saw a 9.3% decline in completed dealership transactions compared to Q1 2019 due to the onset of the COVID-19 pandemic in mid-March.
- Dealership earnings were on track for record growth in 2020 before plummeting in March and April due to stay-at-home orders and showroom closures.
- However, auto retail has proven resilient during past crises and well-positioned for growth given efforts by OEMs, lenders, and government to support the industry during the pandemic. Investor interest and valuations in auto retail have rebounded sharply from March lows.
This document provides an investor presentation for Intact Financial Corporation, a leading property and casualty insurer in Canada. Some key points:
1) Intact has consistently outperformed the industry in terms of return on equity, combined ratio, premium growth, and market share over the past 10 years.
2) Intact aims to beat industry return on equity by 5 points annually through initiatives like pricing and segmentation, claims management, and capital management.
3) Intact has a strong financial position with excess capital, high credit ratings, and a track record of growth and profitability. Management sees opportunities for further industry consolidation.
SEA Group reported strong financial results for Q3 FY21, with 122% revenue growth. The CEO emphasized growing Free Fire's user base and onboarding more MSMEs to Shopee across countries. However, SEA Group's share price has dropped over 30% recently due to market volatility. The report analyzes SEA Group's gaming and e-commerce industries, projects financial growth drivers, and conducts a valuation analysis to determine if SEA Group is attractive for investment.
- Palantir reported strong Q3 2021 financial results, including 34 new customers and revenue growth of 36% year-over-year. However, its stock price dropped 15% after the earnings release.
- The author evaluates Palantir's financial projections and growth targets through 2027 to determine if its stock is mispriced or overvalued given the dilution from stock-based compensation.
- Using a DCF model, the author estimates Palantir's fair value at $20.75-$24.57 per share, implying the stock is fairly priced around its current price of $22.83 once dilution is accounted for. A sensitivity analysis supports this assessment.
Info Edge reported an 18% increase in revenue for the third quarter of FY2015. However, margins declined due to higher spending on new businesses. Specifically, recruitment revenues grew steadily at 19% but showed some weakness in business metrics. Meanwhile, the real estate business 99acres saw a sharp slowdown in growth to 20% due to lack of new projects and increased competition reducing prices. Going forward, continued investment in new businesses raises Info Edge's revenue growth threshold to sustain margins. The brokerage upgraded Info Edge to "Buy" based on intact long-term growth drivers and lower target price.
Csod investor deck second quarter finalircornerstone
Cornerstone provides a corporate overview and highlights of its second quarter 2016 performance. It discusses its evolution over the past 16 years from 4 employees to over 2,500 clients and 25 million users today. Cornerstone also reviews its strong financial results with continued growth in revenue, bookings, clients, and users. It outlines opportunities for further growth through continued core sales, global expansion, new market segments, industries, and maximizing its large installed base.
A research report recommends buying shares of Visa and issues a one-year price target of $253.77, representing 19.1% upside. The recommendation is based on Visa's potential for revenue growth from reopening of travel, inflation hedging through transaction fees, and an upcoming hike in swipe fees. Visa processes payments globally and is positioned for continued growth through expansion in Asia, investments in new technologies, and acquisitions in open banking and cross-border payments.
At the end of the year, we often reflect on the current state of the venture market in technology. We are sharing it with our broader community in the hope that someone will find it informative, interesting or at least entertaining.
Intact Financial Corporation is Canada's largest personal and commercial insurer. It has $6.5 billion in direct premiums written and is the number 1 insurer in several Canadian provinces. The presentation outlines Intact's scale advantages, consistent outperformance of industry metrics like combined ratio and return on equity, and strategic focus areas of enhancing its business mix, pursuing acquisitions, and returning capital to shareholders. Intact is well positioned for continued growth and outperformance relative to the Canadian property and casualty insurance industry.
This document provides an overview and strategic plan for Synacor, Inc. to achieve profitable growth over the next 3 years. Key points include:
- Synacor aims to transform its business and achieve $300 million in revenue and $30 million in EBITDA by 2019 through multiple growth avenues in recurring, fee-based services.
- Its primary sources of revenue are search and advertising revenues from portal experiences, email/collaboration solutions, video platforms, and advertising solutions.
- Growth strategies focus on winning new customers, expanding existing customer relationships, and developing new products and markets.
- Key customers and partners include AT&T, government agencies, and hundreds of publishers. Management believes these
Roth presentation jason tienor telkonetAdam Martin
This document provides an overview of an intelligent automation company. It discusses the company's history, leadership, financial performance, products, markets, growth strategy, and competitive advantages. The company has experienced significant revenue and profitability growth recently and aims to further penetrate existing markets and expand into new sectors through 2020. Key factors making it well-positioned for continued expansion include its technological capabilities, growing customer base, profitable financials, and experienced management team.
Mercer Capital's Value Focus: Auto Dealer Industry | Year-End 2018Mercer Capital
Mercer Capital's Auto Dealer Industry newsletter provides perspective on valuation issues. Each newsletter also includes macroeconomic trends, industry trends, and guideline public company metrics.
Presentation given by CEO Jeff Weiner, and CFO Steve Sordello, at LinkedIn Q4 2015 Earnings Call. For more information, check out http://investors.linkedin.com/.
Salesforce reported record quarterly revenue of over $1 billion and continued strong growth across key metrics like deferred revenue and customer retention rates. The company is making significant investments in technology, markets, and distribution to expand its total addressable market, especially in marketing automation through acquisitions like ExactTarget. Salesforce is developing the Salesforce1 platform to connect customers, partners, employees and devices through an "API first" approach.
Intact Financial Corporation is Canada's largest home, auto and business insurer with over $4 billion in annual direct premiums written. It has a dominant market share in Ontario, Quebec, Alberta and Nova Scotia. Intact has consistently outperformed the Canadian P&C insurance industry in terms of premium growth, combined ratios and returns on equity over the past 10 years. The company has a strong financial position with $8.2 billion in invested assets and excess capital of $766 million. Intact plans to continue growing organically through rate increases and expanding its broker relationships, direct and affinity brands. It also aims to participate in industry consolidation through its $1 billion acquisition capacity.
- Q1 earnings presentation for 2017 reported that the company achieved guidance on revenue and profits despite a tough consumer environment.
- Launched 17 new show concepts with many showing potential for growth. Improved key customer metrics including purchase frequency and growth in wearable category customers.
- Digital sales increased as a percentage of total sales and mobile sales increased as a percentage of digital sales. Engagement on social media and streaming platforms also improved.
This investor presentation provides an overview of Intact Financial Corporation (IFC), Canada's largest property and casualty insurer. Some key points:
1) IFC has consistently outperformed the industry on measures like return on equity, combined ratio, and premium growth over the past 10 years.
2) IFC aims to continue beating industry ROE by 500 bps annually and growing net operating income per share by 10% per year through initiatives like pricing segmentation, claims management, and acquisitions.
3) IFC has a strong capital position with $904 million in excess capital and a 215% Minimum Capital Test ratio as of Q1 2016. Management plans to continue increasing dividends and share buybacks
Intact Financial Corporation is Canada's largest property and casualty insurer with an estimated 17% market share. The presentation outlines Intact's consistent outperformance versus the industry through scale advantages, underwriting expertise, and acquisition strategy. Intact has achieved returns on equity 5 points higher than the industry average each year and targets net operating income per share growth of 10% annually. The company is well positioned for further growth through firming market conditions, developing existing platforms, Canadian market consolidation, and potential international expansion.
Shopify is an e-commerce platform with over 325,000 active merchants and $3.8 billion in gross merchandise volume (GMV) in Q3 2016. The company has a powerful business model with strong, consistent growth in revenue, monthly recurring revenue (MRR), and GMV driven by an increasing merchant base and expanding offerings. Shopify has a long-term focus on growth through additional solutions, channels, and international expansion while maintaining operating leverage through infrastructure investments.
Intact Financial Corporation is Canada's largest home, auto and business insurer, with a 17% market share in a fragmented industry. It has consistently outperformed the industry over 10 years in terms of premium growth, combined ratio, and return on equity. Intact has several competitive advantages including scale, sophisticated pricing and underwriting, in-house claims expertise, and broker relationships. The presentation outlines Intact's strategy to continue growing organically and through acquisitions to consolidate the Canadian property and casualty insurance market.
Intact Financial Corporation is Canada's largest personal and commercial property and casualty insurer, with $7 billion in annual premiums written. It has leading market shares in several Canadian provinces and consistently outperforms the industry on key metrics like combined ratio and return on equity. Intact has a diversified business mix across personal and commercial lines as well as regions. It expects to continue outperforming peers in 2013 through scale advantages, underwriting expertise, and a balanced investment portfolio.
This document is an investor presentation for Intact Financial Corporation, the largest property and casualty insurer in Canada. Some key points:
- Intact has over $7 billion in direct premiums written and is the largest P&C insurer in Canada.
- It has outperformed the P&C industry over the past 10 years in terms of premium growth, return on equity, and combined ratio.
- Intact aims to continue beating the industry ROE by 5 points annually through initiatives like pricing and claims management improvements.
Intact Financial Corporation is Canada's largest personal and commercial property and casualty insurer. Some key points from the document:
- Intact has over $7.3 billion in annual premiums and leads the market in several Canadian provinces.
- The company has a diversified business across personal and commercial lines as well as different distribution channels.
- Intact aims to outperform the industry in key metrics like return on equity by at least 500 basis points annually through initiatives like pricing segmentation, claims management, and investments.
- The company has an $13.4 billion investment portfolio and a strategy to generate higher returns than peers from active management and preferred exposures.
- Intact will pursue growth organically and through
August 2016 investor relations q2 2016 presentationXOGroup
The document is an investor presentation by XO Group Inc. summarizing the company's financial performance and growth strategies. It discusses XO Group achieving 7% revenue growth in the second quarter of 2016 compared to the previous year, with transaction revenue increasing 55%. Adjusted EBITDA also rose 13% year-over-year. The presentation outlines XO Group's plans to accelerate revenue growth through expanding its marketplace offerings and transactions business.
This document discusses insertion sort, including its basic idea of inserting unsorted elements into a sorted list one by one. An example is provided to illustrate how insertion sort works on an array of random numbers. Pseudocode is given for an insertion sort function, and example C code is provided to show how to insert an element into a sorted list. The document ends with questions about applications of insertion sort and alternative implementations.
Keynote (EN): Beyond Budgeting in Practice, at Quality & Excellence Conferenc...Gebhard Borck
The document discusses the need for a new management model beyond traditional budgeting and command-and-control hierarchies. It notes that the world has become more dynamic, complex, and customer-focused, requiring organizations to be more adaptive, decentralized, and responsive. It then outlines principles of the Beyond Budgeting model, which focuses on customer responsibility, devolved leadership, relative targets, transparency, and dynamic processes rather than annual planning and control. Examples are given of companies like Handelsbanken that have successfully implemented aspects of this new model.
Presentation to shareholders of the project Schoolies a project for School leavers, a youth exchange organized in Greece by Loutraki Youth Center and supported by Erasmus Plus and INEDIVIM.
Dokumen ini menjelaskan tentang produk dan strategi pemasaran kelompok E-Lifestyle yang menjual berbagai barang gaya hidup seperti pakaian dan aksesoris. Mereka memasarkan produknya melalui beberapa website seperti Facebook, Tokopedia, dan Tokobagus untuk mempromosikan produk sementara belum memiliki website sendiri. Saat ini mereka belum memperoleh keuntungan penjualan karena belum ada pelanggan yang membeli.
BDPA Chapter Building Workshop - Week #3
Everything You Always Wanted to Know About BDPA, But Were Afraid to Ask!
One hour each week devoted to sharing information with current and future BDPA leaders on what it takes to run a successful BDPA chapter. We will discuss every aspect of the BDPA experience ... both tactical and strategic.
There will be a lesson plan for each session ... however, we will be flexible enough to provide you with answers to questions that are on your mind. Our goal is to eventually ensure that each and every chapter is functioning and successful.
Attendees should include anyone who is currently in a leadership role ... and anyone who is currently thinking about entering a leadership role in a BDPA chapter, region or national office.
Week #3 - held on November 4, 2014. Agenda focused on national BDPA awards program
The document provides information about Central Elementary School to parents and students. It includes a welcome message from the principal, announcements about upcoming events, and details about classroom activities and learning objectives for each grade. The principal emphasizes working together as a team to promote learning and academic excellence in a supportive environment.
Operators are symbols that instruct a compiler to perform specific mathematical or logical manipulations. There are several types of operators including arithmetic, relational, logical, assignment, increment/decrement, conditional, bitwise, and special operators. Arithmetic operators perform numeric calculations like addition and multiplication. Relational operators compare values. Logical operators combine conditional tests.
The article discusses managing change in large organizations and the public sector. It identifies some key differences between managing change in the public versus private sector. The public sector faces unique challenges to change initiatives due to political pressures, risk aversion, and decentralized structures. Successful change management requires understanding resistance, developing a clear vision and plan, strong leadership, communication, and an inclusive approach involving all stakeholders.
The document calls for evidence-based guidelines for unseen invigilated examinations in higher education. It discusses three objectives for quality student assessment: guiding learning approaches, valid and reliable measurement of learning outcomes including higher-order thinking, and standards that define and protect academic achievement. Research evidence is presented showing higher average marks and fewer failures on modules using only coursework compared to only examinations. The document considers tensions between assessment for learning through coursework versus assessment of learning through examinations, and how to structure exam questions to demonstrate higher-level thinking skills. It proposes strategies for "blueprinting" exams and allowing reference materials to optimize student learning and quality of answers.
The document summarizes the results of an audience feedback questionnaire about a documentary on tanning. Respondents generally rated the information, entertainment value, production quality, sound, editing and continuity of the documentary positively. Most said they would continue watching after 5 minutes and liked the documentary. Suggested areas for improvement included longer cutaways, improved sound balancing, and representing both benefits and negatives of tanning. Feedback on radio spots, print ads and how well the promotional elements worked together to promote the documentary was also positive overall.
This document discusses transaction monitoring from May 16-20, 2010. It focuses on monitoring on-the-network applications, tracking synthetic transaction performance and errors, and integrating system and application metrics to determine what problems occurred during that period.
- The report provides an analysis of Apple Inc. (AAPL) stock and recommends it as a Buy. Key strengths noted include revenue growth, strong return on equity, expanding profit margins, increasing net income and earnings per share.
- AAPL designs consumer electronics like the iPhone, iPad, and Mac computers. It has a market capitalization of $562.8 billion and pays an annual dividend of $2.08, for a yield of 2.04%.
- The analysis provides details on AAPL's financial performance, valuation metrics, peers in the computers and peripherals industry, and risks including dependence on new product launches and competition from other technology companies.
apidays LIVE Singapore 2021 - Building the next generation of financial servi...apidays
apidays LIVE Singapore 2021 - Digitisation, Connected Services and Embedded Finance
April 21 & 22, 2021
Building the next generation of financial services through an API first approach
Bijon Mehta, Global Head of Financial Services at Twilio
------
Check out our conferences at https://www.apidays.global/
Do you want to sponsor or talk at one of our conferences?
https://apidays.typeform.com/to/ILJeAaV8
Learn more on APIscene, the global media made by the community for the community:
https://www.apiscene.io
Explore the API ecosystem with the API Landscape:
https://apilandscape.apiscene.io/
A report on technology trends in 2017. Overview of activity by the big 5 (Alphabet, Apple, Amazon, Microsoft, Facebook) and the next 20 companies and Chinese challengers.
Analysis of recent transactions in System Software Industry detailing on Transaction Multiples (Revenue & EBITDA), Multiples Chart, Active Buyers & Transaction Data. A goldmine of resource for Entrepreneurs.
This document brings together a set
of latest data points and publicly
available information relevant for
Business Services Industry. We are
very excited to share this content and
believe that readers will benefit from
this periodic publication immensely.
Salesforce.com is a cloud computing company that offers web-based enterprise applications and platforms. Founded in 1999, it has over 47,700 customers including Cisco and Google. It generates revenue through subscription fees and professional services. While a leader in customer relationship management software, it faces competition from Microsoft, Oracle, and other enterprise software companies. Looking ahead, future growth is expected from integrating acquisitions, partnerships, and expanding into new markets and products.
2020 Software Company Benchmark Report - 132 CompaniesKelly Thomas
This is the 2020-1 version. This will be updated regularly throughout the year based on new financials and market cap information.
Benchmark analysis of 132 publicly-traded software companies. Includes growth rates, gross margin, market capitalization, EBITDA, sales and marketing investment, R&D investment, G&A, stock compensation, operating income, revenue per employee, historical analysis, IPO analysis, free cash flow, and cash position, along with market cap correlation analysis and many others.
This document brings together a set
of latest data points and publicly
available information relevant for
IoT & AR Services Industry. We are
very excited to share this content and
believe that readers will benefit from
this periodic publication immensely.
Einstein
Analytics: Einstein Analytics
Commerce: Commerce Cloud
Marketing: Marketing Cloud
Service: Service Cloud
Platform: AppExchange, Heroku, Lightning
Sales: Sales Cloud
13
Our Product Suite is Growing
Add-on pro
Symantec investor presentation november 2014 finalInvestorSymantec
The presentation provides an overview of Symantec's business and financial results:
- Symantec plans to separate into two independent publicly traded companies focused on security and information management.
- In Q2 2015, Symantec exceeded guidance for operating margin and EPS while revenue was in-line. Security services and backup appliances drove growth.
- Symantec leverages the largest civilian cyber threat intelligence network to provide market-leading security and information management solutions across industries.
The document is the transcript from PAX Global Technology Ltd's 2021 annual earnings call. It provides an overview of the company's financial highlights for 2021, including a 27.3% increase in revenue to HKD7.2 billion and a 20.8% increase in net profit surpassing HKD1 billion. PAX's CFO discusses their achievements, financial performance, dividend increases, and construction projects. The Chairman and CEO then discuss PAX's strong growth in key regions like EMEA and North America, the importance of Android terminals, and financial targets for 2022 with 15% revenue growth. In the Q&A, management addresses questions about the impact of an FBI investigation of PAX's US subsidiary in 2021, stating it had
Software Industry Financial Report - AltQuest GroupMichael Herlache
About AltQuest Group
Software Industry Macroeconomics
Public Software Financial and Valuation Performance
Public SAAS Company Financial and Valuation Performance
Public Internet Company Financial and Valuation Performance
Software Industry M&A Market Update
The OLB Group is a FinTech company offering a suite of product
solutions in the merchant services and payment facilitator verticals,
including a cloud-based omni-channel commerce platform for SMBs,
electronic payment processing, and crowd funding services for
issuers and broker/dealers.
The document provides an investor update from Salesforce for October 2018. It discusses Salesforce's durable growth powered by competitive advantages including its focus on customer success, consistent innovation, and being the leading cloud platform. Salesforce highlights its consistent revenue growth and increasing profitability. It also outlines its large total addressable markets and opportunities across core products like sales, service, marketing, and its platform.
The OLB Group is a FinTech company offering a suite of product
solutions in the merchant services and payment facilitator verticals,
including a cloud-based omni-channel commerce platform for SMBs,
electronic payment processing, and crowd funding services for
issuers and broker/dealers.
Software 2018: Where Are We Now and Where Are We Going?Battery Ventures
Initially presented at CloudNY as follow up to last year’s Software 2017, this year’s presentation—authored by Battery’s Neeraj Agrawal and Logan Bartlett–provides an update on the shifting software landscape and just where things are headed.
- A10 Networks presented its investor presentation for August 2016, which contained forward-looking statements regarding expected financial results, plans and strategy.
- The presentation discussed A10's competitive advantages, including its high-performance application delivery platform and expanding security product portfolio. It also summarized strong Q2 2016 results and long-term targets.
- A10 aims to extend its platform into new markets, expand its global sales footprint, and enhance partnerships to drive continued growth.
Facebook updated its mobile profile design, added Reactions, improved Groups and Video features. It reported 2.5 million active advertisers and 45 million small and medium sized businesses using Facebook pages. Facebook is focusing on its next generation platforms like Instagram, Messenger and WhatsApp. It is also working on initiatives like Internet.org, Aquila, and the Oculus virtual reality headset to drive innovation.
ASML Holding NV is rated a buy based on its revenue growth, reasonable debt levels, growth in earnings per share, increased net income, and strong cash flow. The company's revenue grew 28.6% compared to a industry average of 12.9%. It has a low debt-to-equity ratio of 0.14 and high liquidity. Earnings per share increased 49.1% in the last quarter and the company has demonstrated consistent earnings growth. The recommendation is driven by these financial strengths which outweigh the stock's lackluster performance.
Intel Corporation designs and manufactures integrated digital technology platforms. The report rates Intel stock a "Buy" based on its largely solid financial position, attractive valuation, notable return on equity, good cash flow, and expanding profit margins. It has reasonable debt levels, a high quick ratio, and stable operating cash flow. While its gross profit margin has declined, Intel's net profit margin remains above industry average. The report recommends Intel as an investment that should outperform most other rated stocks.
ASML reports Q3 results in line with guidance and remains on track for record 2015 sales. Two new lithography scanners were launched. Q3 sales were €1.549 billion with a gross margin of 45.4% and net bookings of €904 million. Memory demand accounted for over 50% of system sales. ASML expects Q4 net sales of approximately €1.4 billion and gross margin around 45%.
Intel reported third quarter revenue of $14.5 billion, up 10% sequentially but flat year-over-year. Net income was $3.1 billion. Client Computing Group revenue declined 7% year-over-year but growth in Data Center Group, Internet of Things Group, and non-volatile memory offset this. The results demonstrated customer enthusiasm for Intel's new 6th Generation Intel Core processors.
ASML HOLDINGS is a lithography machine company with a vision to make affordable microelectronics that improve quality of life. Their mission is to develop lithography machines, metrology systems, and software that allow customers to follow Moore's Law and produce smaller, cheaper, more powerful semiconductors. Lithography is important because it is the key technology that allows manufacturers to make transistors on chips smaller, driving continued advancement.
Expanding Access to Affordable At-Home EV Charging by Vanessa WarheitForth
Vanessa Warheit, Co-Founder of EV Charging for All, gave this presentation at the Forth Addressing The Challenges of Charging at Multi-Family Housing webinar on June 11, 2024.
Welcome to ASP Cranes, your trusted partner for crane solutions in Raipur, Chhattisgarh! With years of experience and a commitment to excellence, we offer a comprehensive range of crane services tailored to meet your lifting and material handling needs.
At ASP Cranes, we understand the importance of reliable and efficient crane operations in various industries, from construction and manufacturing to logistics and infrastructure development. That's why we strive to deliver top-notch solutions that enhance productivity, safety, and cost-effectiveness for our clients.
Our services include:
Crane Rental: Whether you need a crawler crane for heavy lifting or a hydraulic crane for versatile operations, we have a diverse fleet of well-maintained cranes available for rent. Our rental options are flexible and can be customized to suit your project requirements.
Crane Sales: Looking to invest in a crane for your business? We offer a wide selection of new and used cranes from leading manufacturers, ensuring you find the perfect equipment to match your needs and budget.
Crane Maintenance and Repair: To ensure optimal performance and safety, regular maintenance and timely repairs are essential for cranes. Our team of skilled technicians provides comprehensive maintenance and repair services to keep your equipment running smoothly and minimize downtime.
Crane Operator Training: Proper training is crucial for safe and efficient crane operation. We offer specialized training programs conducted by certified instructors to equip operators with the skills and knowledge they need to handle cranes effectively.
Custom Solutions: We understand that every project is unique, which is why we offer custom crane solutions tailored to your specific requirements. Whether you need modifications, attachments, or specialized equipment, we can design and implement solutions that meet your needs.
At ASP Cranes, customer satisfaction is our top priority. We are dedicated to delivering reliable, cost-effective, and innovative crane solutions that exceed expectations. Contact us today to learn more about our services and how we can support your project in Raipur, Chhattisgarh, and beyond. Let ASP Cranes be your trusted partner for all your crane needs!
Understanding Catalytic Converter Theft:
What is a Catalytic Converter?: Learn about the function of catalytic converters in vehicles and why they are targeted by thieves.
Why are They Stolen?: Discover the valuable metals inside catalytic converters (such as platinum, palladium, and rhodium) that make them attractive to criminals.
Steps to Prevent Catalytic Converter Theft:
Parking Strategies: Tips on where and how to park your vehicle to reduce the risk of theft, such as parking in well-lit areas or secure garages.
Protective Devices: Overview of various anti-theft devices available, including catalytic converter locks, shields, and alarms.
Etching and Marking: The benefits of etching your vehicle’s VIN on the catalytic converter or using a catalytic converter marking kit to make it traceable and less appealing to thieves.
Surveillance and Monitoring: Recommendations for using security cameras and motion-sensor lights to deter thieves.
Statistics and Insights:
Theft Rates by Borough: Analysis of data to determine which borough in NYC experiences the highest rate of catalytic converter thefts.
Recent Trends: Current trends and patterns in catalytic converter thefts to help you stay aware of emerging hotspots and tactics used by thieves.
Benefits of This Presentation:
Awareness: Increase your awareness about catalytic converter theft and its impact on vehicle owners.
Practical Tips: Gain actionable insights and tips to effectively prevent catalytic converter theft.
Local Insights: Understand the specific risks in different NYC boroughs, helping you take targeted preventive measures.
This presentation aims to equip you with the knowledge and tools needed to protect your vehicle from catalytic converter theft, ensuring you are prepared and proactive in safeguarding your property.
EV Charging at MFH Properties by Whitaker JamiesonForth
Whitaker Jamieson, Senior Specialist at Forth, gave this presentation at the Forth Addressing The Challenges of Charging at Multi-Family Housing webinar on June 11, 2024.
Dahua provides a comprehensive guide on how to install their security camera systems. Learn about the different types of cameras and system components, as well as the installation process.
Charging and Fueling Infrastructure Grant: Round 2 by Brandt HertensteinForth
Brandt Hertenstein, Program Manager of the Electrification Coalition gave this presentation at the Forth and Electrification Coalition CFI Grant Program - Overview and Technical Assistance webinar on June 12, 2024.
Implementing ELDs or Electronic Logging Devices is slowly but surely becoming the norm in fleet management. Why? Well, integrating ELDs and associated connected vehicle solutions like fleet tracking devices lets businesses and their in-house fleet managers reap several benefits. Check out the post below to learn more.
Charging Fueling & Infrastructure (CFI) Program Resources by Cat PleinForth
Cat Plein, Development & Communications Director of Forth, gave this presentation at the Forth and Electrification Coalition CFI Grant Program - Overview and Technical Assistance webinar on June 12, 2024.
Charging Fueling & Infrastructure (CFI) Program by Kevin MillerForth
Kevin Miller, Senior Advisor, Business Models of the Joint Office of Energy and Transportation gave this presentation at the Forth and Electrification Coalition CFI Grant Program - Overview and Technical Assistance webinar on June 12, 2024.
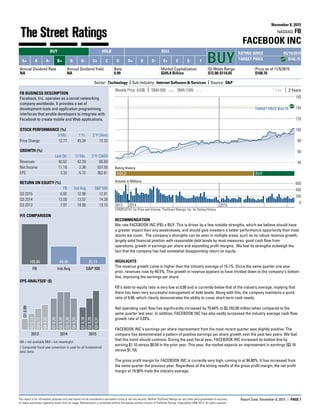
1. FACEBOOK INC
FBNASDAQ:
November 8, 2015
BUY HOLD SELL
BUYBUYBUYBUYBUY
RATING SINCE 05/19/2015
TARGET PRICE $142.75A+ A A- B+ B B- C+ C C- D+ D D- E+ E E- F
Annual Dividend Rate
NA
Annual Dividend Yield
NA
Beta
0.99
Market Capitalization
$245.8 Billion
52-Week Range
$72.00-$110.65
Price as of 11/5/2015
$108.76
Sector: Technology Sub-Industry: Internet Software & Services Source: S&P
This report is for information purposes only and should not be considered a solicitation to buy or sell any security. Neither TheStreet Ratings nor any other party guarantees its accuracy
or makes warranties regarding results from its usage. Redistribution is prohibited without the express written consent of TheStreet Ratings. Copyright(c) 2006-2015. All rights reserved.
PAGE 1Report Date: November 8, 2015
FB BUSINESS DESCRIPTION
Facebook, Inc. operates as a social networking
company worldwide. It provides a set of
development tools and application programming
interfaces that enable developers to integrate with
Facebook to create mobile and Web applications.
STOCK PERFORMANCE (%)
3 Mo. 1 Yr. 3 Yr (Ann)
Price Change 12.77 45.34 72.33
GROWTH (%)
Last Qtr 12 Mo. 3 Yr CAGR
Revenues 40.52 42.29 65.69
Net Income 11.16 2.38 537.50
EPS 3.33 -5.72 362.61
RETURN ON EQUITY (%)
FB Ind Avg S&P 500
Q3 2015 6.82 12.98 12.91
Q3 2014 13.00 13.52 14.28
Q3 2013 7.97 14.58 13.75
P/E COMPARISON
109.86
FB
49.90
Ind Avg
22.13
S&P 500
EPS ANALYSIS¹ ($)
2015
Q30.31
Q20.25
Q10.18
2014
Q40.25
Q30.30
Q20.30
Q10.25
2013
Q40.20
Q30.17
Q20.13
Q10.09
NA = not available NM = not meaningful
1 Compustat fiscal year convention is used for all fundamental
data items.
Weekly Price: (US$) SMA (50) SMA (100) 2 Years1 Year
2013 2014 2015
40
60
80
100
120
140
160
TARGET PRICE $142.75TARGET PRICE $142.75TARGET PRICE $142.75TARGET PRICE $142.75TARGET PRICE $142.75
Rating History
HOLD BUY
0
200
400
600
Volume in Millions
COMPUSTAT for Price and Volume, TheStreet Ratings, Inc. for Rating History
RECOMMENDATION
We rate FACEBOOK INC (FB) a BUY. This is driven by a few notable strengths, which we believe should have
a greater impact than any weaknesses, and should give investors a better performance opportunity than most
stocks we cover. The company's strengths can be seen in multiple areas, such as its robust revenue growth,
largely solid financial position with reasonable debt levels by most measures, good cash flow from
operations, growth in earnings per share and expanding profit margins. We feel its strengths outweigh the
fact that the company has had somewhat disappointing return on equity.
HIGHLIGHTS
The revenue growth came in higher than the industry average of 15.1%. Since the same quarter one year
prior, revenues rose by 40.5%. This growth in revenue appears to have trickled down to the company's bottom
line, improving the earnings per share.
FB's debt-to-equity ratio is very low at 0.00 and is currently below that of the industry average, implying that
there has been very successful management of debt levels. Along with this, the company maintains a quick
ratio of 9.96, which clearly demonstrates the ability to cover short-term cash needs.
Net operating cash flow has significantly increased by 75.64% to $2,192.00 million when compared to the
same quarter last year. In addition, FACEBOOK INC has also vastly surpassed the industry average cash flow
growth rate of 3.03%.
FACEBOOK INC's earnings per share improvement from the most recent quarter was slightly positive. The
company has demonstrated a pattern of positive earnings per share growth over the past two years. We feel
that this trend should continue. During the past fiscal year, FACEBOOK INC increased its bottom line by
earning $1.10 versus $0.59 in the prior year. This year, the market expects an improvement in earnings ($2.16
versus $1.10).
The gross profit margin for FACEBOOK INC is currently very high, coming in at 94.80%. It has increased from
the same quarter the previous year. Regardless of the strong results of the gross profit margin, the net profit
margin of 19.90% trails the industry average.
2. FACEBOOK INC
FBNASDAQ:
November 8, 2015
Sector: Technology Internet Software & Services Source: S&P
Annual Dividend Rate
NA
Annual Dividend Yield
NA
Beta
0.99
Market Capitalization
$245.8 Billion
52-Week Range
$72.00-$110.65
Price as of 11/5/2015
$108.76
This report is for information purposes only and should not be considered a solicitation to buy or sell any security. Neither TheStreet Ratings nor any other party guarantees its accuracy
or makes warranties regarding results from its usage. Redistribution is prohibited without the express written consent of TheStreet Ratings. Copyright(c) 2006-2015. All rights reserved.
PAGE 2Report Date: November 8, 2015
PEER GROUP ANALYSIS
REVENUE GROWTH AND EBITDA MARGIN*
EBITDA Margin (TTM)
RevenueGrowth(TTM)
0%160%
70%-10%
FAVORABLE
UNFAVORABLE
VRSNVRSNVRSNVRSNVRSN
BIDUBIDUBIDUBIDUBIDU
GOOGLGOOGLGOOGLGOOGLGOOGL GOOGGOOGGOOGGOOGGOOG
YHOOYHOOYHOOYHOOYHOO
LNKDLNKDLNKDLNKDLNKD
BABABABABABABABABABA
TWTRTWTRTWTRTWTRTWTR
NTESNTESNTESNTESNTES
AKAMAKAMAKAMAKAMAKAM
FBFBFBFBFB
Companies with higher EBITDA margins and
revenue growth rates are outperforming companies
with lower EBITDA margins and revenue growth
rates. Companies for this scatter plot have a market
capitalization between $9.1 Billion and $474.3 Billion.
Companies with NA or NM values do not appear.
*EBITDA – Earnings Before Interest, Taxes, Depreciation and
Amortization.
REVENUE GROWTH AND EARNINGS YIELD
Earnings Yield (TTM)
RevenueGrowth(TTM)
0%160%
5%-3%
FAVORABLE
UNFAVORABLE
VRSNVRSNVRSNVRSNVRSN
BIDUBIDUBIDUBIDUBIDU
GOOGLGOOGLGOOGLGOOGLGOOGL GOOGGOOGGOOGGOOGGOOG
YHOOYHOOYHOOYHOOYHOO
LNKDLNKDLNKDLNKDLNKD
BABABABABABABABABABA
TWTRTWTRTWTRTWTRTWTR
NTESNTESNTESNTESNTES
AKAMAKAMAKAMAKAMAKAM
FBFBFBFBFB
Companies that exhibit both a high earnings yield
and high revenue growth are generally more
attractive than companies with low revenue growth
and low earnings yield. Companies for this scatter
plot have revenue growth rates between 4.3% and
157.1%. Companies with NA or NM values do not
appear.
INDUSTRY ANALYSIS
The US internet software and services industry includes companies that develop and market internet
software and provide services such as online databases, interactive services, web address registration,
database construction, and website design. The industry is highly competitive and characterized by rapid
technological changes, evolving industry standards, and frequent new product and service developments.
The industry includes about 4,000 companies, with combined annual revenue of approximately $30 billion.
Google (GOOG), eBay (EBAY), and Yahoo (YHOO) are major players.
Over the past decade, consumers have embraced the online channel to purchase goods and services. The
number of worldwide consumers becoming more comfortable in using the internet to purchase goods or
services is expected to continue to grow. Increasing online availability of services and declines in broadband
tariffs and associated hardware prices will continue to drive robust growth.
There is an on-going trend toward industry consolidation as leading companies seek access to new
technology and customer bases developed by recent start-ups in order to increase market share. Recent
acquisitions by large and well-capitalized technology companies have altered the competitive landscape.
Profitability of individual companies depends largely on volume and efficient operations and small companies
compete by serving niche segments or by providing technical expertise.
The industry is highly competitive, particularly in the advertising segment. This competition has intensified as
a result of consolidation and low entry barriers, which has caused price reductions for advertising space,
implying a drop in margins. Another challenge facing the industry is related to secure transmission of
personal information over public networks. These networks are vulnerable to unauthorized access by
hackers and computer viruses. Allowing unauthorized access to users’ information subjects a company to
reputational, financial, and legal risks.
Looking forward, companies’ success will depend on their ability to adopt rapidly evolving technologies, alter
services to meet industry standards, and improve the performance and reliability of services. Investment in
research and development will continue to be an integral part of company and industry success.
PEER GROUP: Internet Software & Services
Recent Market Price/ Net Sales Net Income
Ticker Price ($)Company Name Cap ($M) Earnings TTM ($M) TTM ($M)
FB 108.76FACEBOOK INC 245,769 109.86 15,938.00 2,828.00
VRSN 81.30VERISIGN INC 9,066 32.01 1,042.66 339.18
BIDU 198.91BAIDU INC 54,861 37.46 9,705.78 1,911.60
GOOGL 760.67ALPHABET INC 474,254 35.78 71,763.00 16,182.00
GOOG 731.25ALPHABET INC 474,254 34.44 71,763.00 16,182.00
YHOO 35.12YAHOO INC 33,062 140.48 4,947.98 242.25
LNKD 249.74LINKEDIN CORP 28,836 NM 2,772.45 -147.82
BABA 85.38ALIBABA GROUP HLDG 214,511 22.23 13,655.57 9,832.56
TWTR 28.66TWITTER INC 19,383 NM 1,986.64 -556.15
NTES 144.87NETEASE INC 19,061 23.11 2,388.23 825.69
AKAM 61.70AKAMAI TECHNOLOGIES INC 10,983 33.72 2,154.58 330.09
The peer group comparison is based on Major Internet Software & Services companies of comparable size.
3. FACEBOOK INC
FBNASDAQ:
November 8, 2015
Sector: Technology Internet Software & Services Source: S&P
Annual Dividend Rate
NA
Annual Dividend Yield
NA
Beta
0.99
Market Capitalization
$245.8 Billion
52-Week Range
$72.00-$110.65
Price as of 11/5/2015
$108.76
This report is for information purposes only and should not be considered a solicitation to buy or sell any security. Neither TheStreet Ratings nor any other party guarantees its accuracy
or makes warranties regarding results from its usage. Redistribution is prohibited without the express written consent of TheStreet Ratings. Copyright(c) 2006-2015. All rights reserved.
PAGE 3Report Date: November 8, 2015
COMPANY DESCRIPTION
Facebook, Inc. operates as a social networking company
worldwide. It provides a set of development tools and
application programming interfaces that enable
developers to integrate with Facebook to create mobile
and Web applications. The company's products include
Facebook mobile app and Website that enable people to
connect, share, discover, and communicate with each
other on mobile devices and personal computers;
Messenger, a mobile-to-mobile messaging application
available on Android, iOS, and Windows phone devices;
Instagram, a mobile application that enable people to
take photos or videos, customize them with filter effects,
and share them with friends and followers in a photo
feed or send them directly to friends; and WhatsApp
Messenger, a cross-platform mobile messaging
application that allows people to exchange messages on
iOS, Android, BlackBerry, Windows phone, and Nokia
devices. As of December 31, 2014, it had 1.19 billion
monthly active users and 890 million daily active users.
Facebook, Inc. was founded in 2004 and is
headquartered in Menlo Park, California.
FACEBOOK INC
1601 Willow Road
Menlo Park, CA 94025
USA
Phone: 650-543-4800
http://www.facebook.com
STOCK-AT-A-GLANCE
Below is a summary of the major fundamental and technical factors we consider when determining our
overall recommendation of FB shares. It is provided in order to give you a deeper understanding of our rating
methodology as well as to paint a more complete picture of a stock's strengths and weaknesses. It is
important to note, however, that these factors only tell part of the story. To gain an even more comprehensive
understanding of our stance on the stock, these factors must be assessed in combination with the stock’s
valuation. Please refer to our Valuation section on page 5 for further information.
FACTOR SCORE
Growth out of 5 stars5.0
Measures the growth of both the company's income statement and
cash flow. On this factor, FB has a growth score better than 90% of the
stocks we rate.
weak strong
Total Return out of 5 stars5.0
Measures the historical price movement of the stock. The stock
performance of this company has beaten 90% of the companies we
cover.
weak strong
Efficiency out of 5 stars4.0
Measures the strength and historic growth of a company's return on
invested capital. The company has generated more income per dollar of
capital than 70% of the companies we review.
weak strong
Price volatility out of 5 stars5.0
Measures the volatility of the company's stock price historically. The
stock is less volatile than 90% of the stocks we monitor.
weak strong
Solvency out of 5 stars5.0
Measures the solvency of the company based on several ratios. The
company is more solvent than 90% of the companies we analyze.
weak strong
Income out of 5 stars0.5
Measures dividend yield and payouts to shareholders. This company
pays no dividends.
weak strong
THESTREET RATINGS RESEARCH METHODOLOGY
TheStreet Ratings' stock model projects a stock's total return potential over a 12-month period including both
price appreciation and dividends. Our Buy, Hold or Sell ratings designate how we expect these stocks to
perform against a general benchmark of the equities market and interest rates. While our model is
quantitative, it utilizes both subjective and objective elements. For instance, subjective elements include
expected equities market returns, future interest rates, implied industry outlook and forecasted company
earnings. Objective elements include volatility of past operating revenues, financial strength, and company
cash flows.
Our model gauges the relationship between risk and reward in several ways, including: the pricing drawdown
as compared to potential profit volatility, i.e.how much one is willing to risk in order to earn profits; the level of
acceptable volatility for highly performing stocks; the current valuation as compared to projected earnings
growth; and the financial strength of the underlying company as compared to its stock's valuation as
compared to projected earnings growth; and the financial strength of the underlying company as compared
to its stock's performance. These and many more derived observations are then combined, ranked, weighted,
and scenario-tested to create a more complete analysis. The result is a systematic and disciplined method of
selecting stocks.
4. FACEBOOK INC
FBNASDAQ:
November 8, 2015
Sector: Technology Internet Software & Services Source: S&P
Annual Dividend Rate
NA
Annual Dividend Yield
NA
Beta
0.99
Market Capitalization
$245.8 Billion
52-Week Range
$72.00-$110.65
Price as of 11/5/2015
$108.76
This report is for information purposes only and should not be considered a solicitation to buy or sell any security. Neither TheStreet Ratings nor any other party guarantees its accuracy
or makes warranties regarding results from its usage. Redistribution is prohibited without the express written consent of TheStreet Ratings. Copyright(c) 2006-2015. All rights reserved.
PAGE 4Report Date: November 8, 2015
Consensus EPS Estimates² ($)
IBES consensus estimates are provided by Thomson Financial
0.67
Q4 FY15
2.16 E
2015(E)
2.83 E
2016(E)
INCOME STATEMENT
Q3 FY15 Q3 FY14
Net Sales ($mil) 4,501.00 3,203.00
EBITDA ($mil) 1,945.00 1,704.00
EBIT ($mil) 1,459.00 1,415.00
Net Income ($mil) 896.00 806.00
BALANCE SHEET
Q3 FY15 Q3 FY14
Cash & Equiv. ($mil) 15,834.00 14,250.00
Total Assets ($mil) 46,469.00 24,188.00
Total Debt ($mil) 126.00 278.00
Equity ($mil) 41,420.00 21,238.00
PROFITABILITY
Q3 FY15 Q3 FY14
Gross Profit Margin 94.80% 91.23%
EBITDA Margin 43.21% 53.20%
Operating Margin 32.42% 44.18%
Sales Turnover 0.34 0.46
Return on Assets 6.08% 11.41%
Return on Equity 6.82% 13.00%
DEBT
Q3 FY15 Q3 FY14
Current Ratio 10.68 13.06
Debt/Capital 0.00 0.01
Interest Expense NA NA
Interest Coverage NA NA
SHARE DATA
Q3 FY15 Q3 FY14
Shares outstanding (mil) 2,814 2,608
Div / share 0.00 0.00
EPS 0.31 0.30
Book value / share 14.72 8.14
Institutional Own % NA NA
Avg Daily Volume 30,321,569 27,893,934
2 Sum of quarterly figures may not match annual estimates due to
use of median consensus estimates.
FINANCIAL ANALYSIS
FACEBOOK INC's gross profit margin for the third quarter of its fiscal year 2015 is essentially unchanged when
compared to the same period a year ago. Sales and net income have grown, and although the growth in
revenues has outpaced the average competitor within the industry, the net income growth has not.
FACEBOOK INC is extremely liquid. Currently, the Quick Ratio is 9.96 which clearly shows the ability to cover
any short-term cash needs. The company's liquidity has decreased from the same period last year.
At the same time, stockholders' equity ("net worth") has greatly increased by 95.02% from the same quarter
last year. Overall, the key liquidity measurements indicate that the company is very unlikely to face financial
difficulties in the near future.
STOCKS TO BUY: TheStreet Quant Ratings has identified a handful of stocks that can potentially TRIPLE in the
next 12-months. To learn more visit www.TheStreetRatings.com.
5. FACEBOOK INC
FBNASDAQ:
November 8, 2015
Sector: Technology Internet Software & Services Source: S&P
Annual Dividend Rate
NA
Annual Dividend Yield
NA
Beta
0.99
Market Capitalization
$245.8 Billion
52-Week Range
$72.00-$110.65
Price as of 11/5/2015
$108.76
This report is for information purposes only and should not be considered a solicitation to buy or sell any security. Neither TheStreet Ratings nor any other party guarantees its accuracy
or makes warranties regarding results from its usage. Redistribution is prohibited without the express written consent of TheStreet Ratings. Copyright(c) 2006-2015. All rights reserved.
PAGE 5Report Date: November 8, 2015
RATINGS HISTORY
Our rating for FACEBOOK INC has not changed
since 5/19/2015. As of 11/5/2015, the stock was
trading at a price of $108.76 which is 1.7% below its
52-week high of $110.65 and 51.1% above its
52-week low of $72.00.
2 Year Chart
2014
$60
$80
$100
$120
BUY:$80.63
HOLD:$50.10
MOST RECENT RATINGS CHANGES
Date Price Action From To
5/19/15 $80.63 Upgrade Hold Buy
11/5/13 $50.10 No Change Hold Hold
Price reflects the closing price as of the date listed, if available
RATINGS DEFINITIONS &
DISTRIBUTION OF THESTREET RATINGS
(as of 11/5/2015)
38.98% Buy - We believe that this stock has the
opportunity to appreciate and produce a total return of
more than 10% over the next 12 months.
33.28% Hold - We do not believe this stock offers
conclusive evidence to warrant the purchase or sale of
shares at this time and that its likelihood of positive total
return is roughly in balance with the risk of loss.
27.74% Sell - We believe that this stock is likely to
decline by more than 10% over the next 12 months, with
the risk involved too great to compensate for any
possible returns.
TheStreet Ratings
14 Wall Street, 15th Floor
New York, NY 10005
www.thestreet.com
Research Contact: 212-321-5381
Sales Contact: 866-321-8726
VALUATION
BUY. FACEBOOK INC's P/E ratio indicates a significant premium compared to an average of 49.90 for the
Internet Software & Services industry and a significant premium compared to the S&P 500 average of 22.13.
For additional comparison, its price-to-book ratio of 7.39 indicates a significant premium versus the S&P 500
average of 2.79 and a significant premium versus the industry average of 5.54. The price-to-sales ratio is well
above both the S&P 500 average and the industry average, indicating a premium. Upon assessment of these
and other key valuation criteria, FACEBOOK INC proves to trade at a premium to investment alternatives
within the industry.
1 2 3 4 5Price/Earnings
premium discount
FB 109.86 Peers 49.90
• Premium. A higher P/E ratio than its peers can
signify a more expensive stock or higher growth
expectations.
• FB is trading at a significant premium to its peers.
1 2 3 4 5Price/CashFlow
premium discount
FB 43.21 Peers 27.72
• Premium. The P/CF ratio, a stock’s price divided by
the company's cash flow from operations, is useful
for comparing companies with different capital
requirements or financing structures.
• FB is trading at a significant premium to its peers.
1 2 3 4 5Price/Projected Earnings
premium discount
FB 38.43 Peers 24.14
• Premium. A higher price-to-projected earnings ratio
than its peers can signify a more expensive stock
or higher future growth expectations.
• FB is trading at a significant premium to its peers.
1 2 3 4 5Price to Earnings/Growth
premium discount
FB 1.15 Peers 0.35
• Premium. The PEG ratio is the stock’s P/E divided by
the consensus estimate of long-term earnings
growth. Faster growth can justify higher price
multiples.
• FB trades at a significant premium to its peers.
1 2 3 4 5Price/Book
premium discount
FB 7.39 Peers 5.54
• Premium. A higher price-to-book ratio makes a
stock less attractive to investors seeking stocks
with lower market values per dollar of equity on the
balance sheet.
• FB is trading at a significant premium to its peers.
1 2 3 4 5Earnings Growth
lower higher
FB -5.72 Peers 6.51
• Lower. Elevated earnings growth rates can lead to
capital appreciation and justify higher
price-to-earnings ratios.
• However, FB is expected to significantly trail its
peers on the basis of its earnings growth rate.
1 2 3 4 5Price/Sales
premium discount
FB 19.20 Peers 9.79
• Premium. In the absence of P/E and P/B multiples,
the price-to-sales ratio can display the value
investors are placing on each dollar of sales.
• FB is trading at a significant premium to its industry.
1 2 3 4 5Sales Growth
lower higher
FB 42.29 Peers 38.52
• Average. Comparing a company's sales growth to
its industry helps to determine if the company is
adding or losing market share.
• FB is keeping pace with its peers on the basis of
sales growth.
DISCLAIMER:
The opinions and information contained herein have been obtained or derived from sources believed to be reliable, but
TheStreet Ratings cannot guarantee its accuracy and completeness, and that of the opinions based thereon. Data is provided
via the COMPUSTAT® Xpressfeed product from Standard &Poor's, a division of The McGraw-Hill Companies, Inc., as well as
other third-party data providers.
TheStreet Ratings is a division of TheStreet, Inc., which is a publisher. This research report contains opinions and is provided
for informational purposes only. You should not rely solely upon the research herein for purposes of transacting securities or
other investments, and you are encouraged to conduct your own research and due diligence, and to seek the advice of a
qualified securities professional, before you make any investment. None of the information contained in this report constitutes,
or is intended to constitute a recommendation by TheStreet Ratings of any particular security or trading strategy or a
determination by TheStreet Ratings that any security or trading strategy is suitable for any specific person. To the extent any of
the information contained herein may be deemed to be investment advice, such information is impersonal and not tailored to the
investment needs of any specific person. Your use of this report is governed by TheStreet, Inc.'s Terms of Use found at
http://www.thestreet.com/static/about/terms-of-use.html.