Download as PDF, PPTX


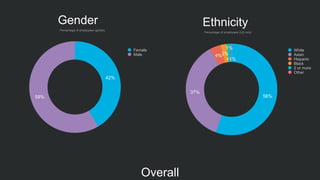
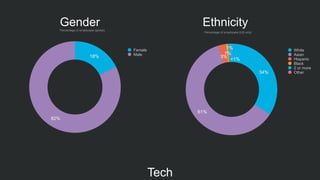
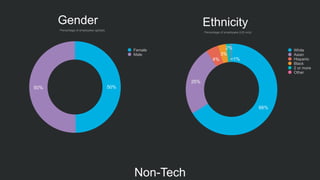


The document provides statistics on workforce diversity in 2015, highlighting gender representation with females comprising 42% and males 58% globally. It also presents ethnicity breakdowns for U.S. employees, with a majority being white. Additionally, the tech and non-tech sectors show differing gender ratios, with technology being 18% female and 82% male.


![Freelancers Are LinkedIn Power Users [Infographic]](https://cdn.slidesharecdn.com/ss_thumbnails/linkedinfreelancepowerusers-151020201935-lva1-app6892-thumbnail.jpg?width=640&height=640&fit=bounds)
![Top Industries for Freelancers on LinkedIn [Infographic]](https://cdn.slidesharecdn.com/ss_thumbnails/topfreelanceindustries-151020195404-lva1-app6892-thumbnail.jpg?width=640&height=640&fit=bounds)


