This document provides a lesson on linear relations and lines. It includes the following key points:
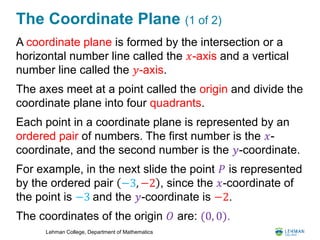
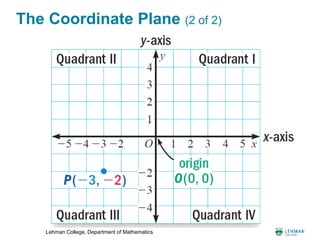
- It introduces the coordinate plane and how points are represented by ordered pairs.
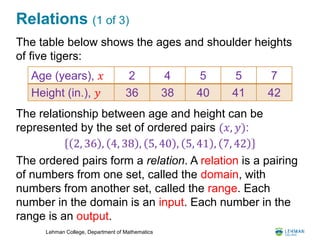
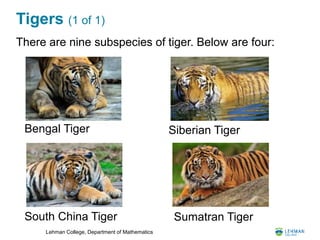
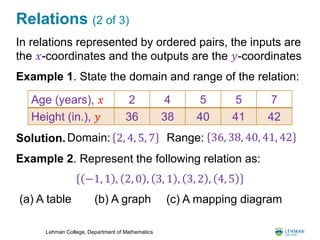
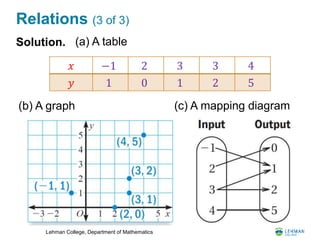
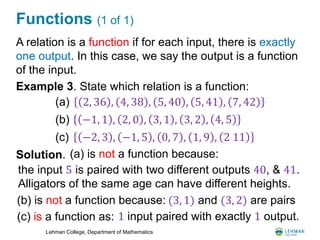
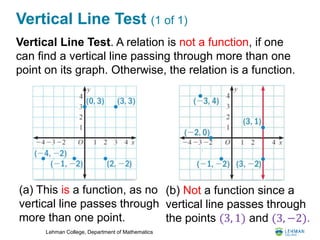
- It discusses relations and functions, including how to represent them using tables, graphs, and mapping diagrams. It also discusses the vertical line test for identifying functions.
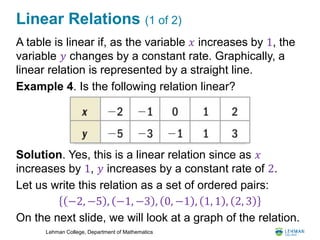
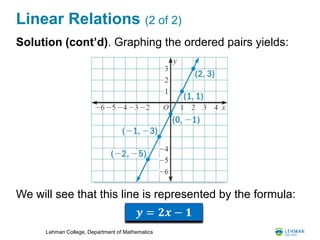
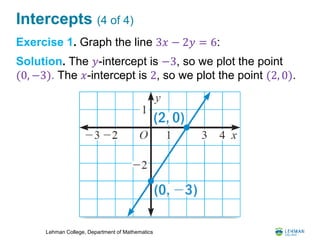
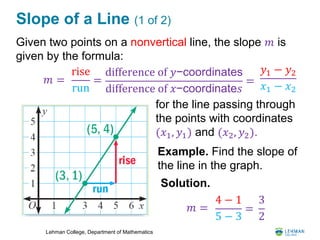
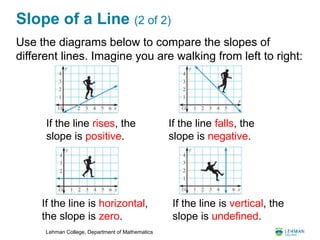
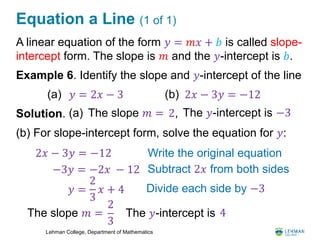
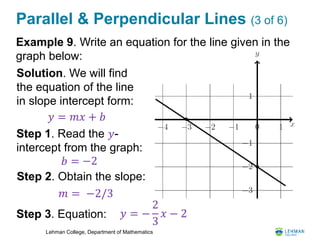
- It covers linear relations and how their graphs form straight lines. It shows how to find the slope and equation of a line.
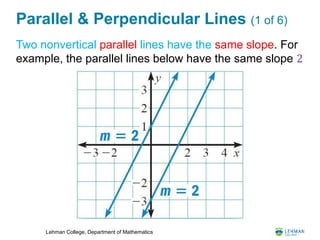
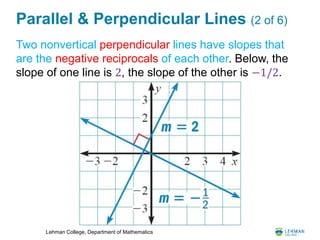
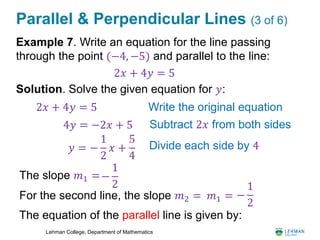
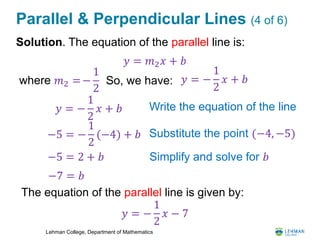
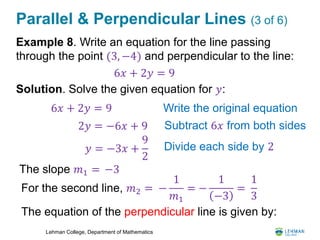
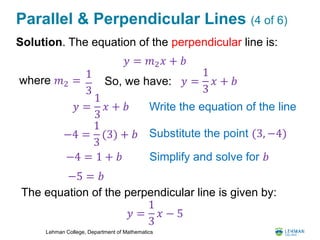
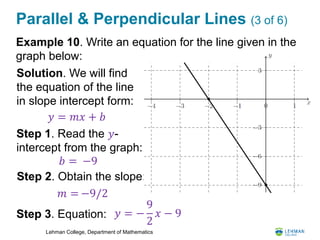
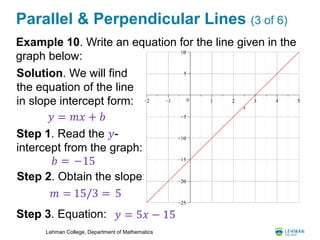
- It examines parallel and perpendicular lines, including how to find the equation of a line parallel or perpendicular to another given line.


![谷歌留痕技术 [ 𝙩𝙤𝙥 𝟮𝟯𝟯. 𝙘 𝙤𝙢 ]](https://cdn.slidesharecdn.com/ss_thumbnails/top233-260130174328-3833018c-thumbnail.jpg?width=640&height=640&fit=bounds)


