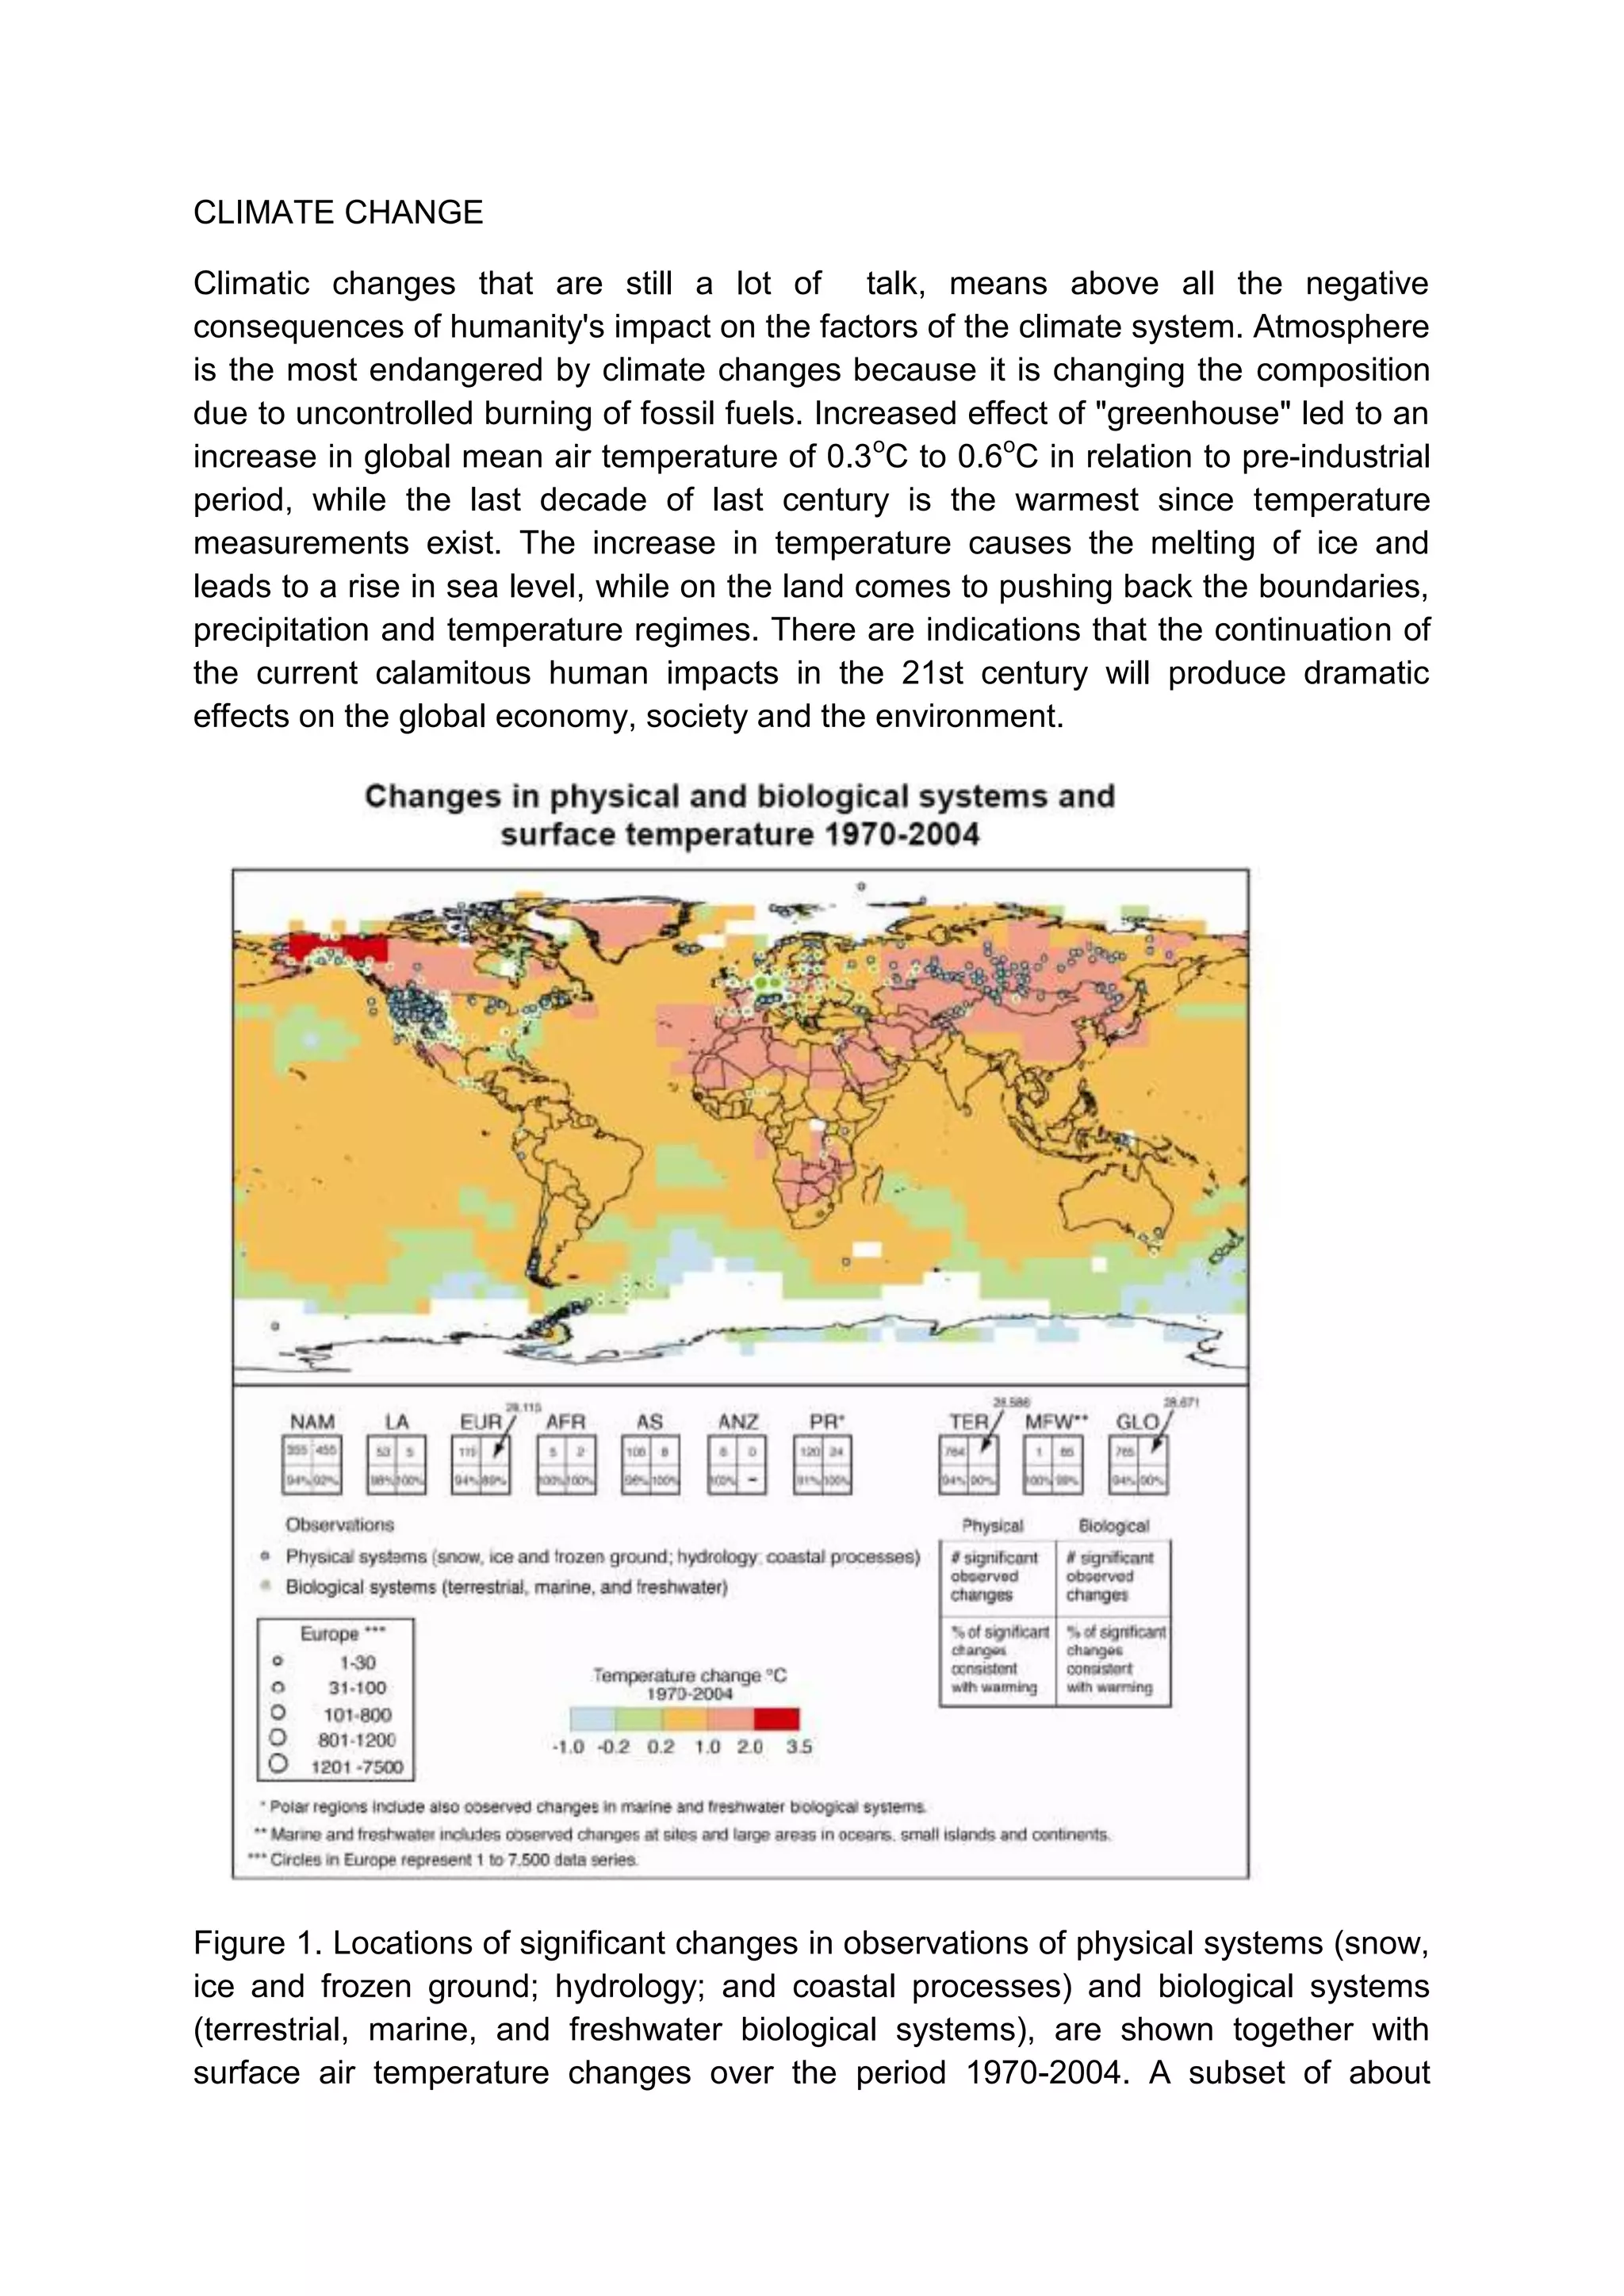
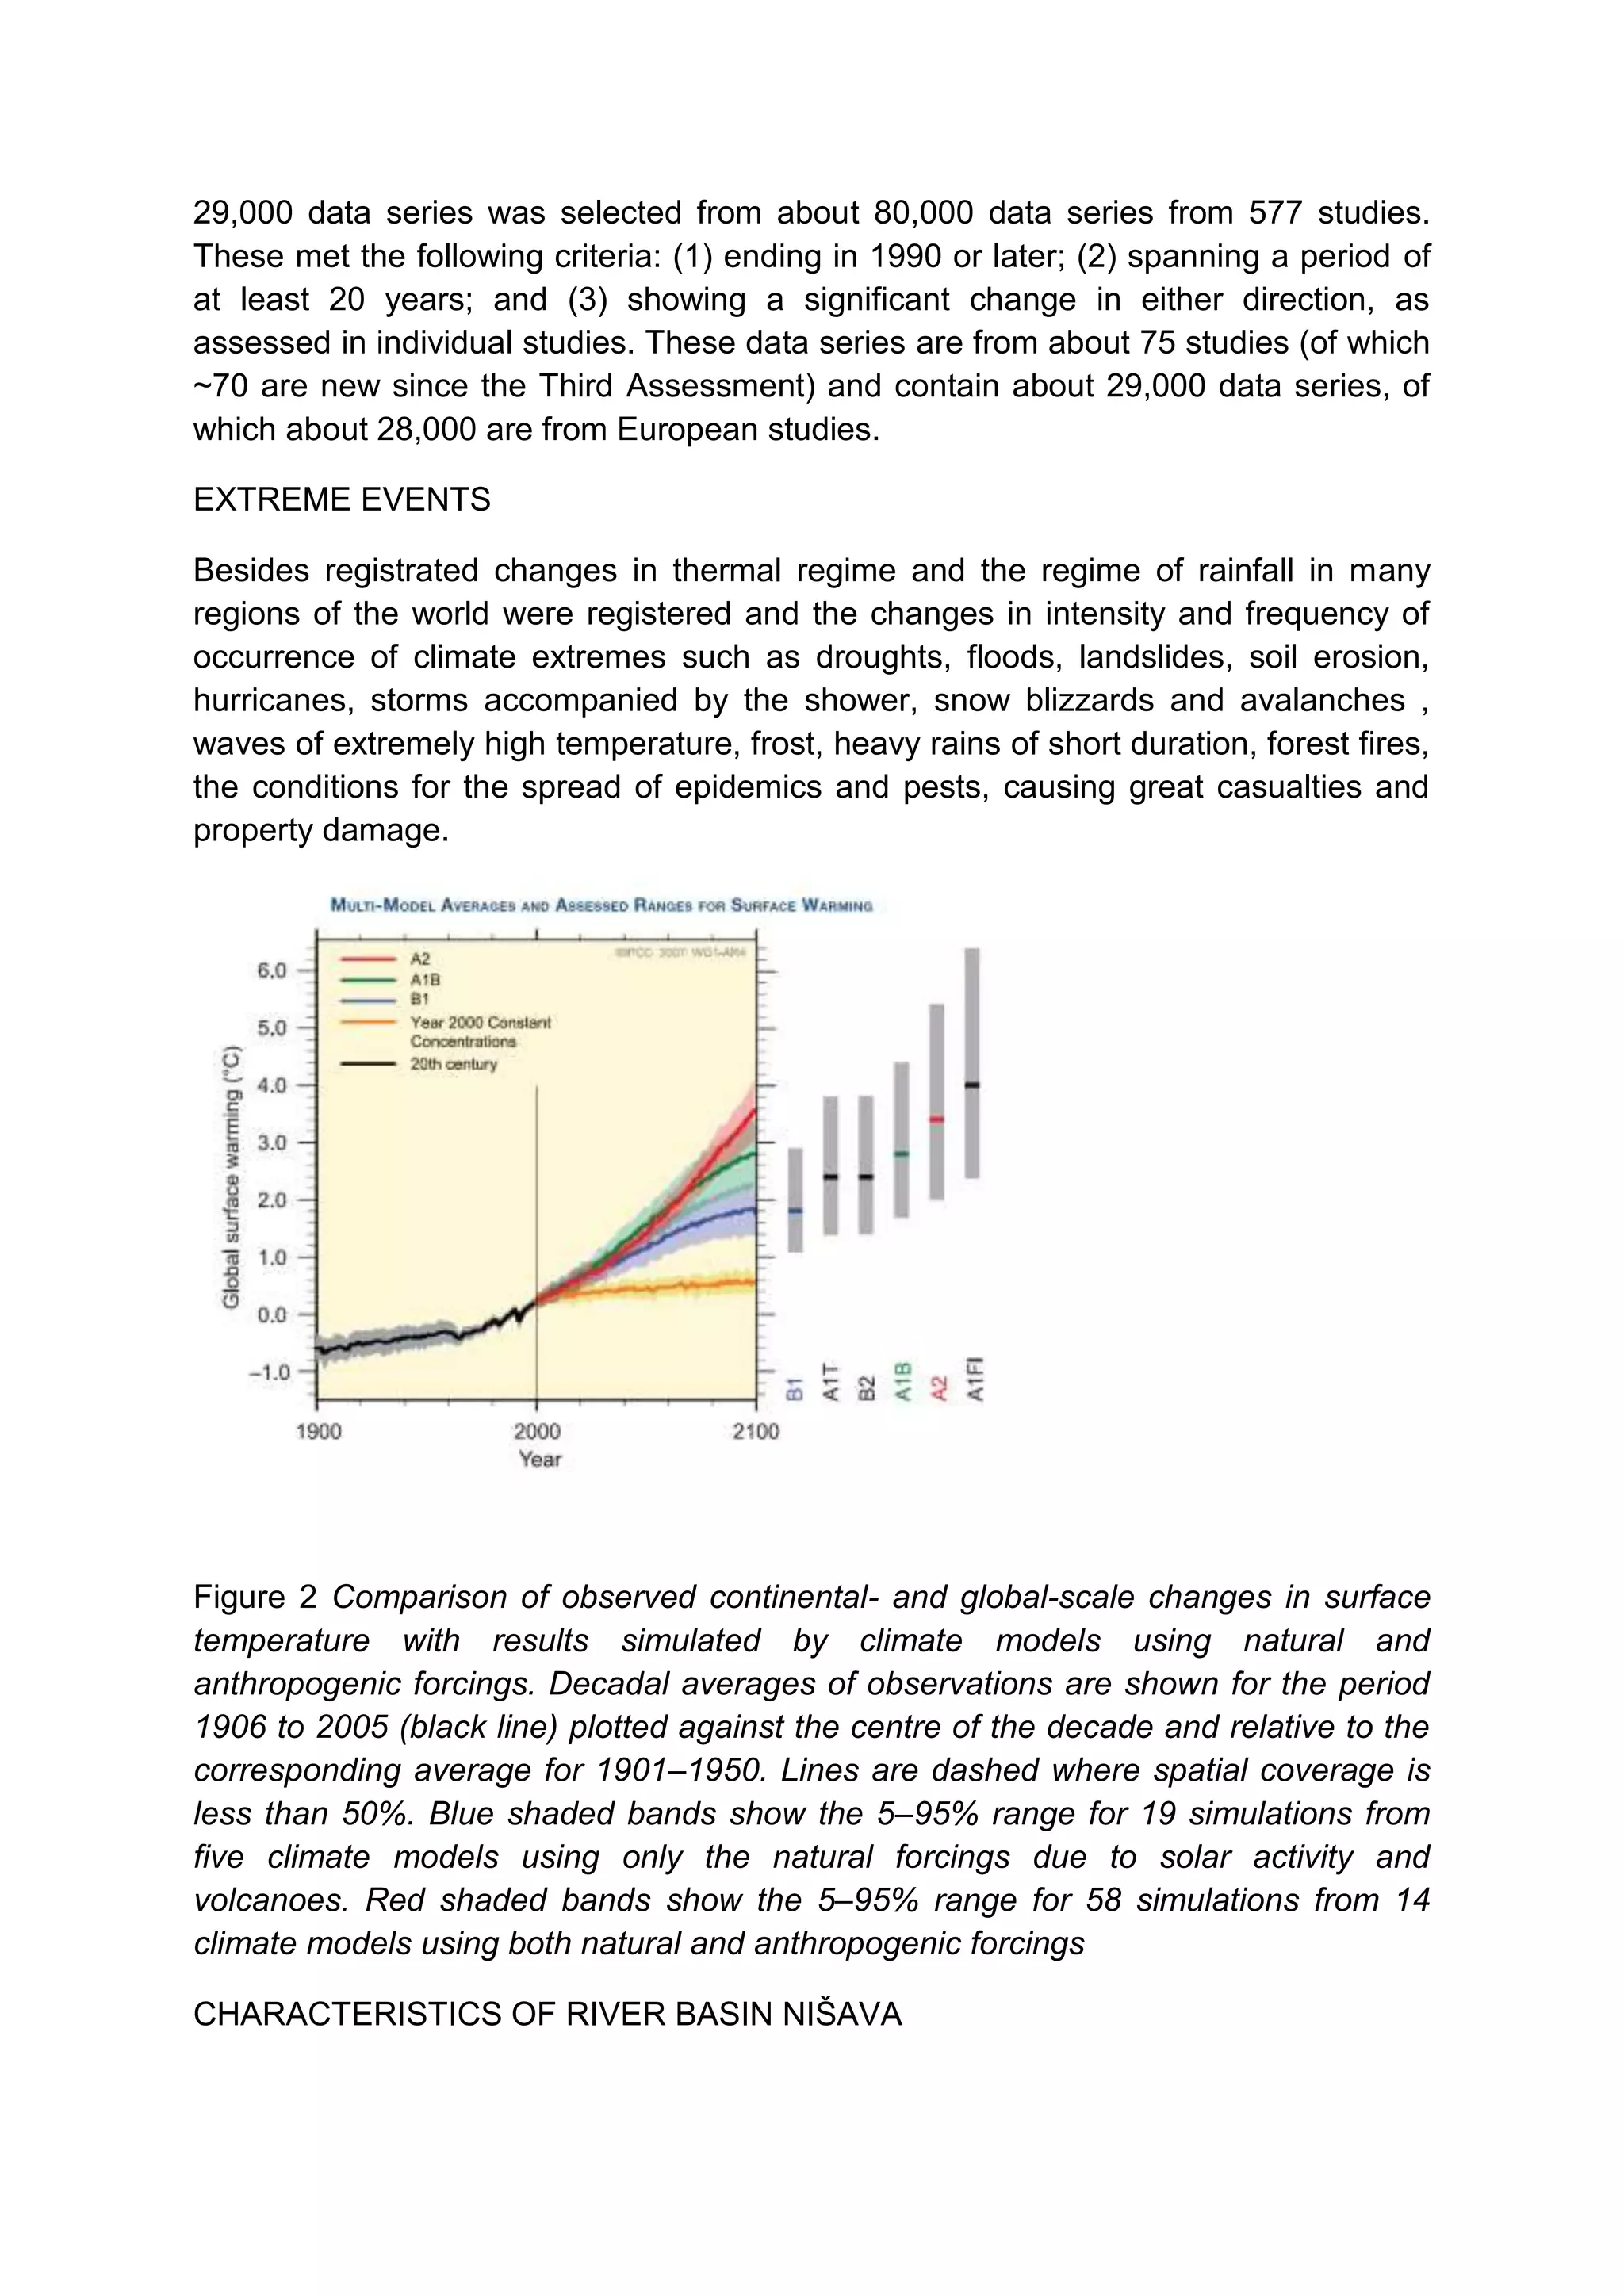
CLIMATE CHANGE

Climatic changes that are still a lot of talk, means above all the negative
consequences of humanity's impact on the factors of the climate system. Atmosphere
is the most endangered by climate changes because it is changing the composition
due to uncontrolled burning of fossil fuels. Increased effect of "greenhouse" led to an
increase in global mean air temperature of 0.3oC to 0.6oC in relation to pre-industrial
period, while the last decade of last century is the warmest since temperature
measurements exist. The increase in temperature causes the melting of ice and
leads to a rise in sea level, while on the land comes to pushing back the boundaries,
precipitation and temperature regimes. There are indications that the continuation of
the current calamitous human impacts in the 21st century will produce dramatic
effects on the global economy, society and the environment.


Figure 1. Locations of significant changes in observations of physical systems (snow,
ice and frozen ground; hydrology; and coastal processes) and biological systems
(terrestrial, marine, and freshwater biological systems), are shown together with
surface air temperature changes over the period 1970-2004. A subset of about
29,000 data series was selected from about 80,000 data series from 577 studies.
These met the following criteria: (1) ending in 1990 or later; (2) spanning a period of
at least 20 years; and (3) showing a significant change in either direction, as
assessed in individual studies. These data series are from about 75 studies (of which
~70 are new since the Third Assessment) and contain about 29,000 data series, of
which about 28,000 are from European studies.

EXTREME EVENTS

Besides registrated changes in thermal regime and the regime of rainfall in many
regions of the world were registered and the changes in intensity and frequency of
occurrence of climate extremes such as droughts, floods, landslides, soil erosion,
hurricanes, storms accompanied by the shower, snow blizzards and avalanches ,
waves of extremely high temperature, frost, heavy rains of short duration, forest fires,
the conditions for the spread of epidemics and pests, causing great casualties and
property damage.


Figure 2 Comparison of observed continental- and global-scale changes in surface
temperature with results simulated by climate models using natural and
anthropogenic forcings. Decadal averages of observations are shown for the period
1906 to 2005 (black line) plotted against the centre of the decade and relative to the
corresponding average for 1901–1950. Lines are dashed where spatial coverage is
less than 50%. Blue shaded bands show the 5–95% range for 19 simulations from
five climate models using only the natural forcings due to solar activity and
volcanoes. Red shaded bands show the 5–95% range for 58 simulations from 14
climate models using both natural and anthropogenic forcings

CHARACTERISTICS OF RIVER BASIN NIŠAVA
Nišava enters Serbia 6 km upstream from Dimitrovgrad. On that place it is wide 8-10
m and deep 30 - 50 cm. Furthermore it flows through the composite valley,
composed of several basins that are connected by gorges. These are Pirot’s basin,
Sopot’s defile, Đurđevpolje’s valley, Sveti Otac’s defile, Bela Palanka’s valley,
Sicevo’s gorge and Nis’ valley. Pirot’s Valley is 14 km long and 3 - 5 km wide.
Nisava is channeled trough Pirot in length of 2 - 2.5 km and covered with stone tiles.
Around the riverbed are embankments, which protect the city from floods that have
strucked it before. Bela Palanka’s field is longer (16 km), but two times narrower from
Pirot’s field. At this place river is up to 60 m wide, and up to 2 m deep. At the time of
high water, part of Bela Palanka’s valley is often flooded, although embankments are
raised beside the riverbed.

Nišava basin has a continental climate with very hot and dry summers and long, cold
winters. Temperature and humidity are inversely proportional. In winter, when the
temperature is lowest humidity is highest, and in the summer the air is driest.

The lowest temperatures are in January and February, and it is expressed altitude of
meteorological stations. The lowest temperatures were recorded in Nis in February -
21.6 ° C, -25.5 ° C in Pirot, and -25.6 ° C in Dimitrovgrad. Winter temperatures drop
even lower in mountainous regions. The last frosts occur in May, but much less
frequently, while in April, constantly. These late frosts present major threat to
agricultural production.

The hottest months are July and August. Niš is the hottest and lowest with
temperatures 19.4-26.5 ° C, Dimitrovgrad is the coldest and highest with maximum
temperatures 17.4-23.8 ° C. In these months, humidity varies within the limits of 41-
72% in Nis, and 48-77% in Dimitrovgrad. This is logical because the relative humidity
is caused by average air temperature and precipitation. When altitude increases, air
temperature decreases and the amount of rainfall increases, which causes an
increase in relative humidity. The occurrence of natural coniferous forests on the
Stara Planina mountains at elevations over 900 m asl is explained by increased
humidity. Other parts of the basin, which are protected from cold north-east winds
with Suva planina’s massive, and often for other reasons, have a small amount of
water sediment, thus in these areas is lower relative humidity and coniferous forests
do not appear.

Table 3.1 shows average monthly rainfall at stations in the Nišava basin for the
period 1947-1961.

Table 3.1 Average monthly and annual precipitation sums

Meteorologic Months                                                                  Yea
al                                                                                   r

station        I     II   III   IV   V      VI     VII   VIII IX    X     XI   XII
Dimitrovgrad 39.2 39.2 43.7 52.4 79.2 85.8              55.5 43.5 39.1 43.3 58.9 48.8 629

Dojkinci       71.2 74.3 52.6 80.4 108.0 108.8 80.3 61.0 60.4 59.1 89.6 77.6 917

Smilovci       47.0 50.4 45.2 49.3 76.0 84.3            57.6 49.3 44.9 45.3 66.9 51.9 668

Temska         50.5 53.2 47.2 51.6 72.0 78.4            56.0 44.8 47.1 42.7 63.5 55.6 663

V. Lukanja     58.1 48.1 51.0 58.5 78.5 88.5            64.6 45.6 51.0 43.6 68.5 64.3 720

Topli Do       50.3 56.8 47.9 55.3 73.1 86.9            60.2 47.9 48.4 41.6 64.6 59.8 693

Niš            38.6 38.3 39.8 51.6 64.5 63.4            43.3 41.8 41.0 40.0 57.8 51.6 571


Table 3.2 shows average monthly air temperatures in the basin of the river Nišava for
cities Dimitrovgrad, Pirot and Nis, where it is shown that Niš is the warmest since it is
the lowest.

Table 3.2 Average monthly and annual air temperatures (for the period 1946. to
1991.)

Meteorologic Months                                                                     Year
al
             I    II        III     IV    V     VI    VII   VIII IX     X    XI   XII
station

Dimitrovgrad -1.1 0.8 4.8           10.1 14.6 17.8 19.8 19.5 15.8 10.4 5.4        1. 0 9.9

Niš            0.1    2.3 6.7       12.1 16.8 20.0 22.0 21.5 17.8 12.0 6.9        2.2   11.7

Pirot          -0.6 0.6 5.8         11.8 16.5 20.0 22.6 21.6 18.0 13.5 8.2        1.1   11.6


Table 3.3 shows average monthly and annual relative humidity for the cities of Nis
and Dimitrovgrad, which confirms the relationships of altitude, rainfall and relative
humidity.

Table 3.3 Average values of mean monthly and annual relative humidity (%)

Meteorological Months                                                                   Year

station          I     II     III    IV   V      VI   VII   VIII   IX   X    XI   XII

Dimitrovgrad     80    77     70     66       70 71   67    65     69   73   79   81    72
Niš               80   76   68     64   67    67     64     63     68     72     78   81     71


   Monthly distribution of rainfall is uneven and can be seen from Table 3.1 that the
   amount of rainfall during the period April-June, and November to December at all
   stations is significantly increased. Some stations (areas) have increased rainfall in
   some other summer months, depending on terrain, vegetation and air flow. In the
   winter months a minimum deposit is recorded at all stations. There are very little
   precipitate from July to September, and this quantity increases from September to
   Novembee, but less than in the spring months.

   However it can be particularly seen that climate change is expressed in our area in
   recent years. This change in climate is reflected in the fact that in recent years Niš
   became the hottest city in the country with extreme temperatures over 40 0C.

                          Jan Feb Mar Apr May Jun Jul                  Aug Sep Oct Nov Dec year

TEMPERATURE ° C

Mean maximum              2,9 5,7 10,8 16,5 21,3 24,3 26,7 26,9 23,5 17,6 10,5 4,6 15,9

Mean minumum              -4,8 -2,8 0,1    4,3    8,5    11,5 12,6 12,4 9,4          5,1      1,2 -2,6 4,6

Normal value              -1,3 0,9 4,9     10,0 14,6 17,5 19,3 19,0 15,4 10,4 5,2 0,7 9,7

The absolute maximum      17,8 23,0 26,8 31,4 33,4 37,8 39,3 37,4 35,4 32,7 25,8 20,0 39,3

The absolute minimum      -29,3 -22,3 -16,8 -5,5 -2,3 1,5       4,5    2,4    -3,5 -7,9 -17,0 -18,0 -29,3

Mean no. frosty days      25,5 19,3 14,2 3,2      0,2    0,0    0,0    0,0    0,3    4,0      11,4 20,9 99,0

Mean no. tropical days    0,0 0,0 0,0      0,1    0,7    2,4    7,2    8,7    2,3    0,1      0,0 0,0 21,5

RELATIVE HUMIDITY (%)

Average                   79,4 76,5 69,9 65,9 69,0 70,8 66,7 65,9 69,2 72,4 78,5 81,5 72,1

The amount of sunshine

                                      137, 170, 225, 251, 302, 287, 226, 173,           2104,
Average                   76,2 92,9                                           97,5 63,0
                                      0    8    2    3    6    5    9    4              3

number of clear days      3,0 2,7 4,5      4,0    4,3    5,3    10,5 12,6 10,8 8,4            4,0 2,3 72,4

number of cloudy days     14,8 12,3 12,0 9,5      7,0    4,9    3,0    3,1    3,7    7,1      11,1 15,4 103,9

Participation (mm)

Mean monthly sum          42,2 40,5 46,5 51,1 74,9 87,1 60,7 44,1 38,9 39,1 61,4 49,0 635,5
Max. daily sum           40,8 47,9 40,8 46,4 41,5 44,8 91,8 39,3 36,8 49,1 33,9 38,4 91,8

Mean. no. days> = 0.1    13,6 12,5 12,6 13,1 13,7 14,1 9,7       8,2   7,5   8,0   11,0 13,8 137,8

Mean. no. days >= 10.0
                       0,9 0,8 1,3       1,2   2,5   2,9   1,8   1,4   1,4   1,2   2,1 1,2 18,7
mm

Occurrence (number of days with ....)

snow                     10,9 9,3 7,1    1,0   0,0   0,0   0,0   0,0   0,0   0,3   3,5 8,8 40,9

snow cover               18,2 12,6 6,3   0,3   0,0   0,0   0,0   0,0   0,0   0,2   4,9 12,9 55,4

mist                     1,1 0,5 0,3     0,3   1,0   0,8   0,9   0,7   1,1   1,4   1,2 1,5 10,8

shower                   0,0 0,0 0,0     0,3   0,7   0,6   0,2   0,1   0,1   0,1   0,0 0,0 2,1


   CONCLUSION

   If that trend continued, by the accepted scenario, in the future there would be a
   permanent increase in average temperatures. Some experts believe that there are
   several scenarios for increasing global warming. Experts estimate that it is very bad
   scenario the increase in mean annual temperature of 1.5 0C, and catastrophic the
   increase in mean annual temperature of 1.50 to 5 0C. From the standpoint of water
   management, these temperature changes would cause the significant adverse
   modification of the hydrological cycle of rainfall (reduction in medium rainfall,
   worsening of spatial and temporal variation and increase of extremum) which would
   be manifested in increased variation of surface and ground water, droughts would
   have more intense and longer duration, and would significantly increase the part of
   Serbia with an average annual rainfall of less than 650 mm. Also, due to the
   deterioration of the spatial and temporal variation of rainfall and increasing of
   extremumm, it will come to an intensification of the process of soil erosion and
   frequent occurrence of catastrophic flash floods.

Cliamte change en

  • 1.
    CLIMATE CHANGE Climatic changesthat are still a lot of talk, means above all the negative consequences of humanity's impact on the factors of the climate system. Atmosphere is the most endangered by climate changes because it is changing the composition due to uncontrolled burning of fossil fuels. Increased effect of "greenhouse" led to an increase in global mean air temperature of 0.3oC to 0.6oC in relation to pre-industrial period, while the last decade of last century is the warmest since temperature measurements exist. The increase in temperature causes the melting of ice and leads to a rise in sea level, while on the land comes to pushing back the boundaries, precipitation and temperature regimes. There are indications that the continuation of the current calamitous human impacts in the 21st century will produce dramatic effects on the global economy, society and the environment. Figure 1. Locations of significant changes in observations of physical systems (snow, ice and frozen ground; hydrology; and coastal processes) and biological systems (terrestrial, marine, and freshwater biological systems), are shown together with surface air temperature changes over the period 1970-2004. A subset of about
  • 2.
    29,000 data serieswas selected from about 80,000 data series from 577 studies. These met the following criteria: (1) ending in 1990 or later; (2) spanning a period of at least 20 years; and (3) showing a significant change in either direction, as assessed in individual studies. These data series are from about 75 studies (of which ~70 are new since the Third Assessment) and contain about 29,000 data series, of which about 28,000 are from European studies. EXTREME EVENTS Besides registrated changes in thermal regime and the regime of rainfall in many regions of the world were registered and the changes in intensity and frequency of occurrence of climate extremes such as droughts, floods, landslides, soil erosion, hurricanes, storms accompanied by the shower, snow blizzards and avalanches , waves of extremely high temperature, frost, heavy rains of short duration, forest fires, the conditions for the spread of epidemics and pests, causing great casualties and property damage. Figure 2 Comparison of observed continental- and global-scale changes in surface temperature with results simulated by climate models using natural and anthropogenic forcings. Decadal averages of observations are shown for the period 1906 to 2005 (black line) plotted against the centre of the decade and relative to the corresponding average for 1901–1950. Lines are dashed where spatial coverage is less than 50%. Blue shaded bands show the 5–95% range for 19 simulations from five climate models using only the natural forcings due to solar activity and volcanoes. Red shaded bands show the 5–95% range for 58 simulations from 14 climate models using both natural and anthropogenic forcings CHARACTERISTICS OF RIVER BASIN NIŠAVA
  • 3.
    Nišava enters Serbia6 km upstream from Dimitrovgrad. On that place it is wide 8-10 m and deep 30 - 50 cm. Furthermore it flows through the composite valley, composed of several basins that are connected by gorges. These are Pirot’s basin, Sopot’s defile, Đurđevpolje’s valley, Sveti Otac’s defile, Bela Palanka’s valley, Sicevo’s gorge and Nis’ valley. Pirot’s Valley is 14 km long and 3 - 5 km wide. Nisava is channeled trough Pirot in length of 2 - 2.5 km and covered with stone tiles. Around the riverbed are embankments, which protect the city from floods that have strucked it before. Bela Palanka’s field is longer (16 km), but two times narrower from Pirot’s field. At this place river is up to 60 m wide, and up to 2 m deep. At the time of high water, part of Bela Palanka’s valley is often flooded, although embankments are raised beside the riverbed. Nišava basin has a continental climate with very hot and dry summers and long, cold winters. Temperature and humidity are inversely proportional. In winter, when the temperature is lowest humidity is highest, and in the summer the air is driest. The lowest temperatures are in January and February, and it is expressed altitude of meteorological stations. The lowest temperatures were recorded in Nis in February - 21.6 ° C, -25.5 ° C in Pirot, and -25.6 ° C in Dimitrovgrad. Winter temperatures drop even lower in mountainous regions. The last frosts occur in May, but much less frequently, while in April, constantly. These late frosts present major threat to agricultural production. The hottest months are July and August. Niš is the hottest and lowest with temperatures 19.4-26.5 ° C, Dimitrovgrad is the coldest and highest with maximum temperatures 17.4-23.8 ° C. In these months, humidity varies within the limits of 41- 72% in Nis, and 48-77% in Dimitrovgrad. This is logical because the relative humidity is caused by average air temperature and precipitation. When altitude increases, air temperature decreases and the amount of rainfall increases, which causes an increase in relative humidity. The occurrence of natural coniferous forests on the Stara Planina mountains at elevations over 900 m asl is explained by increased humidity. Other parts of the basin, which are protected from cold north-east winds with Suva planina’s massive, and often for other reasons, have a small amount of water sediment, thus in these areas is lower relative humidity and coniferous forests do not appear. Table 3.1 shows average monthly rainfall at stations in the Nišava basin for the period 1947-1961. Table 3.1 Average monthly and annual precipitation sums Meteorologic Months Yea al r station I II III IV V VI VII VIII IX X XI XII
  • 4.
    Dimitrovgrad 39.2 39.243.7 52.4 79.2 85.8 55.5 43.5 39.1 43.3 58.9 48.8 629 Dojkinci 71.2 74.3 52.6 80.4 108.0 108.8 80.3 61.0 60.4 59.1 89.6 77.6 917 Smilovci 47.0 50.4 45.2 49.3 76.0 84.3 57.6 49.3 44.9 45.3 66.9 51.9 668 Temska 50.5 53.2 47.2 51.6 72.0 78.4 56.0 44.8 47.1 42.7 63.5 55.6 663 V. Lukanja 58.1 48.1 51.0 58.5 78.5 88.5 64.6 45.6 51.0 43.6 68.5 64.3 720 Topli Do 50.3 56.8 47.9 55.3 73.1 86.9 60.2 47.9 48.4 41.6 64.6 59.8 693 Niš 38.6 38.3 39.8 51.6 64.5 63.4 43.3 41.8 41.0 40.0 57.8 51.6 571 Table 3.2 shows average monthly air temperatures in the basin of the river Nišava for cities Dimitrovgrad, Pirot and Nis, where it is shown that Niš is the warmest since it is the lowest. Table 3.2 Average monthly and annual air temperatures (for the period 1946. to 1991.) Meteorologic Months Year al I II III IV V VI VII VIII IX X XI XII station Dimitrovgrad -1.1 0.8 4.8 10.1 14.6 17.8 19.8 19.5 15.8 10.4 5.4 1. 0 9.9 Niš 0.1 2.3 6.7 12.1 16.8 20.0 22.0 21.5 17.8 12.0 6.9 2.2 11.7 Pirot -0.6 0.6 5.8 11.8 16.5 20.0 22.6 21.6 18.0 13.5 8.2 1.1 11.6 Table 3.3 shows average monthly and annual relative humidity for the cities of Nis and Dimitrovgrad, which confirms the relationships of altitude, rainfall and relative humidity. Table 3.3 Average values of mean monthly and annual relative humidity (%) Meteorological Months Year station I II III IV V VI VII VIII IX X XI XII Dimitrovgrad 80 77 70 66 70 71 67 65 69 73 79 81 72
  • 5.
    Niš 80 76 68 64 67 67 64 63 68 72 78 81 71 Monthly distribution of rainfall is uneven and can be seen from Table 3.1 that the amount of rainfall during the period April-June, and November to December at all stations is significantly increased. Some stations (areas) have increased rainfall in some other summer months, depending on terrain, vegetation and air flow. In the winter months a minimum deposit is recorded at all stations. There are very little precipitate from July to September, and this quantity increases from September to Novembee, but less than in the spring months. However it can be particularly seen that climate change is expressed in our area in recent years. This change in climate is reflected in the fact that in recent years Niš became the hottest city in the country with extreme temperatures over 40 0C. Jan Feb Mar Apr May Jun Jul Aug Sep Oct Nov Dec year TEMPERATURE ° C Mean maximum 2,9 5,7 10,8 16,5 21,3 24,3 26,7 26,9 23,5 17,6 10,5 4,6 15,9 Mean minumum -4,8 -2,8 0,1 4,3 8,5 11,5 12,6 12,4 9,4 5,1 1,2 -2,6 4,6 Normal value -1,3 0,9 4,9 10,0 14,6 17,5 19,3 19,0 15,4 10,4 5,2 0,7 9,7 The absolute maximum 17,8 23,0 26,8 31,4 33,4 37,8 39,3 37,4 35,4 32,7 25,8 20,0 39,3 The absolute minimum -29,3 -22,3 -16,8 -5,5 -2,3 1,5 4,5 2,4 -3,5 -7,9 -17,0 -18,0 -29,3 Mean no. frosty days 25,5 19,3 14,2 3,2 0,2 0,0 0,0 0,0 0,3 4,0 11,4 20,9 99,0 Mean no. tropical days 0,0 0,0 0,0 0,1 0,7 2,4 7,2 8,7 2,3 0,1 0,0 0,0 21,5 RELATIVE HUMIDITY (%) Average 79,4 76,5 69,9 65,9 69,0 70,8 66,7 65,9 69,2 72,4 78,5 81,5 72,1 The amount of sunshine 137, 170, 225, 251, 302, 287, 226, 173, 2104, Average 76,2 92,9 97,5 63,0 0 8 2 3 6 5 9 4 3 number of clear days 3,0 2,7 4,5 4,0 4,3 5,3 10,5 12,6 10,8 8,4 4,0 2,3 72,4 number of cloudy days 14,8 12,3 12,0 9,5 7,0 4,9 3,0 3,1 3,7 7,1 11,1 15,4 103,9 Participation (mm) Mean monthly sum 42,2 40,5 46,5 51,1 74,9 87,1 60,7 44,1 38,9 39,1 61,4 49,0 635,5
  • 6.
    Max. daily sum 40,8 47,9 40,8 46,4 41,5 44,8 91,8 39,3 36,8 49,1 33,9 38,4 91,8 Mean. no. days> = 0.1 13,6 12,5 12,6 13,1 13,7 14,1 9,7 8,2 7,5 8,0 11,0 13,8 137,8 Mean. no. days >= 10.0 0,9 0,8 1,3 1,2 2,5 2,9 1,8 1,4 1,4 1,2 2,1 1,2 18,7 mm Occurrence (number of days with ....) snow 10,9 9,3 7,1 1,0 0,0 0,0 0,0 0,0 0,0 0,3 3,5 8,8 40,9 snow cover 18,2 12,6 6,3 0,3 0,0 0,0 0,0 0,0 0,0 0,2 4,9 12,9 55,4 mist 1,1 0,5 0,3 0,3 1,0 0,8 0,9 0,7 1,1 1,4 1,2 1,5 10,8 shower 0,0 0,0 0,0 0,3 0,7 0,6 0,2 0,1 0,1 0,1 0,0 0,0 2,1 CONCLUSION If that trend continued, by the accepted scenario, in the future there would be a permanent increase in average temperatures. Some experts believe that there are several scenarios for increasing global warming. Experts estimate that it is very bad scenario the increase in mean annual temperature of 1.5 0C, and catastrophic the increase in mean annual temperature of 1.50 to 5 0C. From the standpoint of water management, these temperature changes would cause the significant adverse modification of the hydrological cycle of rainfall (reduction in medium rainfall, worsening of spatial and temporal variation and increase of extremum) which would be manifested in increased variation of surface and ground water, droughts would have more intense and longer duration, and would significantly increase the part of Serbia with an average annual rainfall of less than 650 mm. Also, due to the deterioration of the spatial and temporal variation of rainfall and increasing of extremumm, it will come to an intensification of the process of soil erosion and frequent occurrence of catastrophic flash floods.