
Recommended
More Related Content
Similar to 3.-Weather-and-climate in great detail.pptx
Similar to 3.-Weather-and-climate in great detail.pptx (20)
More from mihajlokarna1
More from mihajlokarna1 (12)
Recently uploaded
Recently uploaded (20)
3.-Weather-and-climate in great detail.pptx
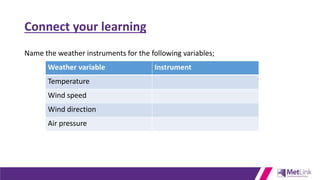
- 1. Connect your learning Name the weather instruments for the following variables; Weather variable Instrument Temperature Wind speed Wind direction Air pressure
- 3. Weather and climate Objectives • To be able to distinguish between WEATHER and CLIMATE • To understand and be able to PLOT a climate graph • To be able to INTERPRET climate graphs for different places and make COMPARISONS Outcomes • Sentences contrasting weather and climate • A completed climate graph for Dalwhinnie in Scotland, accurately drawn with temperature and precipitation plotted on the correct axis • Sentences contrasting the climate in Dalwhinnie and Reading
- 4. Weather and climate • Weather describes the short-term state of our atmosphere. This may include information about the air temperature, precipitation, air pressure and cloud cover. Our local weather changes daily due to the movement of air in our atmosphere. • Climate is the average weather over a long time period (usually 30 years) for a particular region or place. The climate affects a number of environmental factors within the region including the type and growth of vegetation and wildlife. The climate is determined by large scale factors such as the Earth’s orbit around the Sun, the position of the continents and the composition (make up) of the atmosphere. 1. Copy the following definitions in purple;
- 5. Weather and climate • Weather describes the short-term state of our atmosphere. This may include information about the air temperature, precipitation, air pressure and cloud cover. • Climate is the average weather over a long time period (usually 30 years) for a particular region or place. In pairs try to decide what period of time you have to look at the weather before you can say it is climate. https://youtu.be/e0vj-0imOLw
- 6. Weather or climate? 1. High winds shut the Forth Road Bridge last night 2. Richard booked his holiday to Malaga in July as it is usually very hot then 3. Arjun relies on the May to September Monsoon in India to water his crops every year 4. Ski resorts in the Alps do their best business in January and February as that is when there is the most snow 5. Wayoh Reservoir in Bolton completely dried up in the heat of July 2018 6. The Central England Temperature record shows that July is the warmest month on average 7. Heavy rainfall caused flooding to farmers’ fields over 5 days 1. Weather 2. Climate 3. Climate 4. Climate 5. Weather 6. Climate 7. Weather
- 7. How do we present the climate? Month Maximum temperature (°C) Minimum temperature (°C) Days of air frost (days) Sunshine (hours) Rainfall (mm) Days of rainfall ≥1 mm (days) January 4.3 -1.4 17.6 24.9 179 18.5 February 4.5 -1.4 16.4 56.4 123.7 15.4 March 6.4 -0.2 14.3 87.7 127 17.4 April 9.4 1.3 10.2 127.3 63.7 13.7 May 13 3.6 4.7 165.6 70 12.9 June 15.3 6.6 0.6 135.8 64.5 12.6 July 17.2 8.9 0 135.1 68.7 13.2 August 16.6 8.5 0.1 128.2 79.9 13.6 September 13.9 6.5 1.4 99.9 99.8 14.1 October 10.2 3.9 5 66.7 147.2 18.5 November 6.8 1.2 9.9 31.8 143.1 17.4 December 4.6 -1.5 17 17.6 137.4 16.3 Annual 10.2 3 97.2 1077.2 1304 183.6 The simplest way is to show the averages in a table. Using the table; 1. When is the best period to go skiing? 2. When would you most need an umbrella? 3. Identify the warmest month 4. When would be the best month for a camping holiday in Dalwhinnie? Climate averages for Dalwhinnie in Northern Scotland, 1981 to 2010 Dalwhinnie, Scotland, 351m asl Reading, England, 52m asl 56.9°N 51.45°N
- 8. This is a Climate graph 0 5 10 15 20 25 0 50 100 150 200 January February March April May June July August September October November December Temperature (°C) Precipitation (mm) A climate graph for Reading 1981- 2010 averages Precipitation (mm) Maximum temperature (°C) Climate graphs plot 30 years of data about a place. This axis shows the PRECIPITATION – shown by the BARS on the graph This axis shows the temperature, shown by the line on the graph The precipitation in January is just over 60mm The temperature in July is 22°C
- 9. Climate graphs - a way to display climate data 0 5 10 15 20 25 0 20 40 60 80 100 120 140 160 180 200 January February March April May June July August September October November December Temperature (°C) Precipitation (mm) A climate graph for Reading 1981-2010 averages Precipitation (mm) Maximum temperature (°C) 0 5 10 15 20 25 0 20 40 60 80 100 120 140 160 180 200 January February March April May June July August September October November December Temperature (°C) Precipitation (mm) A climate graph for Dalwhinnie, Scotland, 1981 -2010 averages Precipitation (mm) Maximum temperature (°C) Month January February March April May June July August September October November December Maximum temperature (°C) 4.3 4.5 6.4 9.4 13 15.3 17.2 16.6 13.9 10.2 6.8 4.6 Precipitation (mm) 179 123.7 127 63.7 70 64.5 68.7 79.9 99.8 147.2 143.1 137.4 Climate data for Dalwhinnie, Scotland TASKS Plot the data for Dalwhinnie in Scotland. To do this; 1. Plot the precipitation as a BAR graph using the left hand axis 2. Plot the temperature as crosses in the middle of the month. Then join the crosses together as a line. 3. Complete the key on the graph
- 10. Climate graphs - a way to display climate data 61 41.2 44.5 48 46.4 44.6 46 52.3 50.3 71.8 66.3 62.9 7.7 8 10.8 13.5 17 20 22.4 22.1 19 14.9 10.7 7.9 0 5 10 15 20 25 0 20 40 60 80 100 120 140 160 180 200 Temperature (°C) Precipitation (mm) A climate graph for Reading 1981-2010 averages Precipitation (mm) Maximum temperature (°C) 179 123.7 127 63.7 70 64.5 68.7 79.9 99.8 147.2 143.1 137.4 4.3 4.5 6.4 9.4 13 15.3 17.2 16.6 13.9 10.2 6.8 4.6 0 5 10 15 20 25 0 20 40 60 80 100 120 140 160 180 200 Temperature (°C) Precipitation (mm) A climate graph for Dalwhinnie, Scotland, 1981 -2010 averages Precipitation (mm) Maximum temperature (°C) Contrast the graphs; 1. Which of the places gets the most precipitation? 2. Which of the places is hotter in the summer? 3. Which of the places is colder in the winter? 4. Which of the places has the most VARIATION in its precipitation? 5. In which of the 2 places would you like to live? EXTENSION – calculate some differences between the 2 places (maximum temperatures, maximum precipitation)
- 11. 0 5 10 15 20 25 0 20 40 60 80 100 120 140 160 180 200 January February March April May June July August September October November December Temperature (°C) Precipitation (mm) A Climate graph contrasting the climate of Dalwhinnie with the climate of Reading Dalwhinnie Precipitation (mm) Reading Precipitation (mm) Dalwhinnie Maximum temperature (°C) Reading Maximum temperature (°C) Dalwhinnie, Scotland, 351m asl Reading, England, 52m asl 56.9°N 51.45°N Can you SUGGEST reasons why the climates of these 2 places are so different?
- 12. Weather and climate Objectives 1. To be able to distinguish between WEATHER and CLIMATE 2. To understand and be able to PLOT a climate graph 3. To be able to INTERPRET climate graphs for different places and make COMPARISONS Score out of 5 on how you did 1. 2. 3.
- 13. Thunk Question Thunk question “A Thunk question is a…simple-looking question about everyday things that stops you in your tracks and helps you start to look at the world in a whole new light.” https://www.independentthinking.co.uk/thunks/ n.b. Thunk in this sense is not an official word in the Cambridge English Dictionary! Do you talk more about weather or climate?
- 14. Weather & Climate and climate change 1850 2018 1900 1950 2000 If climate is the average of 30 years’ weather, how much weather data do you need before you can talk about climate change?
Editor's Notes
- Image source: Google maps, GeoBasis-DE/BKG Note for TEACHERS – we have used 2 examples from very different parts of the UK on purpose. You might want to replace one with climate data closer to where your students live. You could use websites such as https://en.climate-data.org/ or https://weather-averages.co.uk/
- Image source: Google maps, GeoBasis-DE/BKG