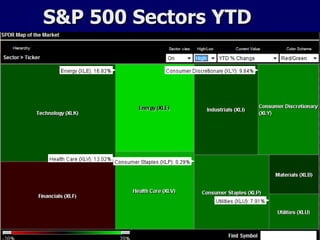
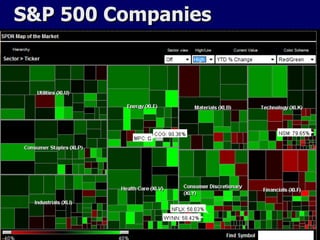
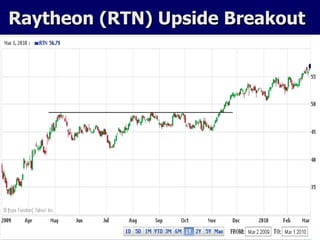
Technical and Market Analysis Mike Zaccardi Technical Analyst 2009-2010 Osprey Financial Group
Street Cred 2009-10 OFG – Energy, Materials, Utilities equity analyst; Technician 2010 CFA Global Investment Research Challenge Competitor, Florida Champions One of five OFG students, competed in New York City in Americas Challenge 2010 Financial Management Association Financial Quiz Bowl Champion – Chicago, IL 10-11 UNF Finance and Investment Society President Financial Columnist, UNF Spinnaker 2011 FMA Best All-Around Forecaster (Crude Oil, Weather) Briefly…Research Analyst, Intrepid Capital Mgmt
 
Agenda TA as defined by the CFA Institute Current Market Analysis & Outlook OFG Technical Calls Energy Charts Other Technical Analysis Indicators Lightning Round
What is Technical Analysis? Security analysis discipline for forecasting the future direction of prices through the study of past data, primarily price and volume Contradictory to weak-form EMH Like weather forecasting, TA does not provide an absolute prediction
Technical Analysis per CFAI Though the CFA program does not emphasize TA, it WILL appear on the exams Quantitative Methods About 5 questions out of 240
Assumptions Stock values determined by supply and demand Supply and demand are driven by both rational and irrational behavior Security prices move in trends that persist for long periods While causes of changes in supply and demand are difficult to determine, the changes themselves can be observed in market price behavior
TA vs. Fundamentals Fundamental analysts  look for changes in stock values (risk and return) that lead to changes in supply and demand and believe stock prices adjust quickly to new information about value Technical analysts  look directly for signals and indicators of changes in supply and demand and believe stock prices move in trends that can persist for long periods
Advantages of Technical Analysis Quick and easy (sometimes) Does not involve messing with data and adjusting for accounting changes and differences Incorporates psychological as well as economic (rational as well as irrational) reasons behind price changes Behavioral Finance
Challenges to Technical Analysis The weak form of EMH suggests that stock prices reflect all available trading information Statistical tests find no evidence of price trends or profitable trading rules If statistical trading rules worked, price changes would become self-fulfilling prophecies; its value would be neutralized Interpreting technical rules is subjective, and decision variables change over time
Categories of Technical Indicators Contrarian indicators:  The majority is often wrong, do the opposite Smart money indicators:  “Smart” investors are right, do what they are doing Momentum indicators:  Direction and strength of market movement Stock price and volume techniques:  Identify patterns that repeat
Contrarian Opinion Rules Mutual fund (cash) ratio = cash/total assets Investor credit balances in brokerage accounts Opinions of investment advisory services OTC volume/NYSE volume CBOE put/call ratio Percentage of bullish stock index futures traders
Smart Money Indicators Confidence index =  high quality bond yields   average bond yields Increase (closer to 1) is bullish; Yield  CI T-bill yield to Eurodollar yield spread Narrower is bullish, wider is bearish Margin debt in brokerage accounts Increase is bullish, decrease is bearish
Momentum Indicators Breadth of market: Advance-decline line Number of stocks above 200-day moving average 80% of stocks above 200-day MA, a correction is likely (overbought)
Price and Volume Techniques Dow Theory  – major trends (tides), intermediate trends (waves), short-run movements (ripples) Ratio of upside to downside volume  (>1.75 is overbought, <0.75 is oversold) Support and resistance levels  – movements through these levels on high volume, breakouts Relative strength  – ratio of stock price to market index, increasing is bullish, decreasing is bearish, trend expected to continue
Price and Volume Techniques Moving averages  –  Stock price moves through the 50-day moving average on strong volume 50-day moving average crosses the 200-day moving average on strong volume (golden cross) To identify Trends:  Bar Charts  – a bar from high to low price over a period with volume per period at the bottom Point and figure charts  – only record price movements of some minimum amount
Market Analysis Highlights Headline risk Dollar near lows, Euro weak (you’ll see) US Stocks fairing well vs. Intls Energy, Health Care leading the way Volume steady, low (summertime) A look at gold, silver Commodities cool off Credit markets, money velocity - Deflation
SPX 9-Month
NASDAQ 100 ETF (NDX) 9-Month
10-yr Yield
Small Caps Outperformance
Internationals vs. SPX
Emerging Markets vs. SPX
CBOE VIX 1-Year
VIX 10-Year
 
What’s the worst ETF in the world?
VXX – Short Term VIX
NYSE Daily Volume 1-Year
Cotton (BAL) ETF – Parabolic Move Cotton ($CT_F) Bubble Burst
Gold ($GC_F) 1-Yr
Silver ($SI_F) 4-Month
Fibonacci 13 th  century Italian mathematician discovered a self-replicating sequence of numbers 1, 1, 2, 3, 5, 8, 13, 21, 34, 55, 89 etc Sum of two adjacent numbers forms the next number Ratio of two consecutive numbers is 1.618, or its inverse, 0.618 Thus 61.8% and 38.2% are thought to be important retracement levels
US Dollar Index 1-Year
JPY and EUR vs. USD
Australian Dollar (AUDUSD)
USDJPY 1-Year (Flash Crash)
EURCHF – “Risk-Off”
US Dollar Index 40-Year
S&P 500 Sectors YTD
S&P 500 Companies
OFG Technical Calls
Raytheon (RTN) Upside Breakout
OIH Double-Bottom
Oil Services ETF 200-EMA
Energy E&P ETF (XOP)
USD – Reversal
DXY Flag Formation
OFG and the Dollar
Diamond Offshore (DO)
Freeport-McMoRan (FCX)
S&P 500 w/200ema & 50sma OFG Strategy:  Raise Cash on 2/3 with S&P at 1090-1105   Buy back equities between 1045-1060 Reasoning: Market was in Corrective phase, 200 ema @ 1045, 10% correction at 1035 – buyers likely to step in ahead of 10% number as it had been much anticipated
What Happened? Technical call at 1103 on the S&P turned out to be nearly exactly what occurred S&P quickly moved from 1103 to 1044.50 in only a few days and reversed higher, retracing 100% of the move downward within just 2 weeks  My sectors :  sold FCX in January, remained in cash in Materials Sector Energy was roughly half in cash as of 2/4 Market weight defensive Utilities Sector Bought back OIH at $115.10 (S&P 1057) 2/5 Bought back XOP at $38.38 (S&P 1049) 2/5 Bought back FCX at $69.20 (S&P 1059) 2/8 Sold on 2/19 at $77.75 for a 12.4% profit in <9 trading days
Scotts Miracle Gro (SMG)
Anomalies January Effect Sell (equities) in May and Go Away Sell Treasuries in February Options Expiration – Heavy Volume Mutual Fund Monday! Final 10-20 Minutes of Trading January Barometer President’s Third Year Presidential Election Cycle
Energy Charts
RBOB Gas 1-YR (+$0.65)
WTI Crude – 10-Year
WTI/Brent Spread
What’s Commodity is not Performing?
Nat Gas 10-YR
Contango!
Backwardation
Technical Indicators
Candlesticks
 
 
Abandoned Baby  Engulfing Pattern
Golden Cross
Death Cross
Market Internal Indicators CBOE Put/Call Ratio (WILL BE UPDATED) Today: 0.76 (VIX: 20.36 +1.29, +6.8%) Advance/Decline 1092/1812   New highs/new lows 214/5  Up Volume/DownVolume 0.645 TRIN: +1.60
Bollinger Bands The indicator consists of three  bands designed to encompass the majority of a security's price action.  A simple moving avg in the middle An upper band (SMA plus 2 standard deviations) A lower band (SMA minus 2 standard deviations)
Bollinger Bands
Elliot Wave
3 More… MACD  – Moving average convergance/divergance: momentum indicator that shows the relationship between two moving averages of prices.  Stochastics  – Slow/Fast: momentum indicator that shows the location of the current close relative to the high/low range over a set number of periods.  RSI  – Relative strength index: compares the magnitude of a stock's recent gains to the magnitude of its recent losses and turns that information into a number that ranges from 0 to 100.
Netflix (NFLX)
Kroger (KR) Quiet Leader
Apple (AAPL) Loud Leader
Beat down Goldman Sachs (GS)
Molycorp (MCP)
Google (GOOG) Beware
Mosaic (MOS) looks good
Bank of America (BAC)
Peet’s Coffee (PEET)
Flash Crash – 5/6/2010 1000 point drop in Dow SPX lost 105 points (9%) intraday SPX lost 7% in about 10 minutes Recovered 6% in 20 minutes Errant trade in SPX futures PG fat finger Many stocks had ‘trade-aways’ causing scrutiny at the exchanges Shattered investor confidence Continued outflows from equity mutual funds in coming months High-frequency trading, computer algorithms: Man vs. Machine
 
 
Apple on Flash Crash
 
Now’s the time?
Or are we the next Japan?
10-yr Returns
All other Technical Indicators 100s more technical indicators If you look hard enough, you can find an indicator to agree with you (Bad!) Use technical indicators with other indicators for better results Combine TA with Fundamental Analysis for the best results!
Want to be a TA? Market Technicians Association Be aware: having technical analysis on your resume can hurt you. Many firms, especially valuation firms, look down on TA Somewhat specialized, not many TA entry level positions Stocktwits/Twitter
Books Edwards, Robert D. and Magee, John, Technical Analysis of Stock Trends, 9th Edition Kirkpatrick, Charles D. and Dahlquist, Julie R.: Technical Analysis The Complete Resource for Financial Market Technicians Pring, Martin J.: Technical Analysis Explained, 4th Edition Jeremy du Plessis, The Definitive Guide to Point and Figure Frost, A.J. and Prechter, Robert R., Elliott Wave Principle, Tenth Edition Kaufman, Perry J., New Trading Systems and Methods, 4th Edition Nison, Steve, Japanese Candlestick Charting Techniques, 2nd Edition Pring, Martin J., Investment Psychology Explained Aronson, David R.: Evidence-Based Technical Analysis Brown, Constance M., Technical Analysis for the Trading Professional Murphy, John J., Intermarket Analysis: Profiting From Global Market Relationships Shiller, Robert J., Irrational Exuberance, 2nd Edition O’Neil, William J, How to Make Money in Stocks (latest edition)
Good Websites: Ino.com (Futures charts) Kitco.com (metal/commodities) Optionmonster.com (TA/Options) Sectorspdr.com/marketmap/ (Tree) Googlefinance Yahoofinance Bigcharts.com Briefing.com (Economic/Earnings Calendars) Twitter (live news, traders) Brokerage accounts for streaming quotes/analysis (Thinkorswim, StrategyDesk, eSignal)

Lecture 7 27

  • 1.
    Technical and MarketAnalysis Mike Zaccardi Technical Analyst 2009-2010 Osprey Financial Group
  • 2.
    Street Cred 2009-10OFG – Energy, Materials, Utilities equity analyst; Technician 2010 CFA Global Investment Research Challenge Competitor, Florida Champions One of five OFG students, competed in New York City in Americas Challenge 2010 Financial Management Association Financial Quiz Bowl Champion – Chicago, IL 10-11 UNF Finance and Investment Society President Financial Columnist, UNF Spinnaker 2011 FMA Best All-Around Forecaster (Crude Oil, Weather) Briefly…Research Analyst, Intrepid Capital Mgmt
  • 3.
  • 4.
    Agenda TA asdefined by the CFA Institute Current Market Analysis & Outlook OFG Technical Calls Energy Charts Other Technical Analysis Indicators Lightning Round
  • 5.
    What is TechnicalAnalysis? Security analysis discipline for forecasting the future direction of prices through the study of past data, primarily price and volume Contradictory to weak-form EMH Like weather forecasting, TA does not provide an absolute prediction
  • 6.
    Technical Analysis perCFAI Though the CFA program does not emphasize TA, it WILL appear on the exams Quantitative Methods About 5 questions out of 240
  • 7.
    Assumptions Stock valuesdetermined by supply and demand Supply and demand are driven by both rational and irrational behavior Security prices move in trends that persist for long periods While causes of changes in supply and demand are difficult to determine, the changes themselves can be observed in market price behavior
  • 8.
    TA vs. FundamentalsFundamental analysts look for changes in stock values (risk and return) that lead to changes in supply and demand and believe stock prices adjust quickly to new information about value Technical analysts look directly for signals and indicators of changes in supply and demand and believe stock prices move in trends that can persist for long periods
  • 9.
    Advantages of TechnicalAnalysis Quick and easy (sometimes) Does not involve messing with data and adjusting for accounting changes and differences Incorporates psychological as well as economic (rational as well as irrational) reasons behind price changes Behavioral Finance
  • 10.
    Challenges to TechnicalAnalysis The weak form of EMH suggests that stock prices reflect all available trading information Statistical tests find no evidence of price trends or profitable trading rules If statistical trading rules worked, price changes would become self-fulfilling prophecies; its value would be neutralized Interpreting technical rules is subjective, and decision variables change over time
  • 11.
    Categories of TechnicalIndicators Contrarian indicators: The majority is often wrong, do the opposite Smart money indicators: “Smart” investors are right, do what they are doing Momentum indicators: Direction and strength of market movement Stock price and volume techniques: Identify patterns that repeat
  • 12.
    Contrarian Opinion RulesMutual fund (cash) ratio = cash/total assets Investor credit balances in brokerage accounts Opinions of investment advisory services OTC volume/NYSE volume CBOE put/call ratio Percentage of bullish stock index futures traders
  • 13.
    Smart Money IndicatorsConfidence index = high quality bond yields average bond yields Increase (closer to 1) is bullish; Yield CI T-bill yield to Eurodollar yield spread Narrower is bullish, wider is bearish Margin debt in brokerage accounts Increase is bullish, decrease is bearish
  • 14.
    Momentum Indicators Breadthof market: Advance-decline line Number of stocks above 200-day moving average 80% of stocks above 200-day MA, a correction is likely (overbought)
  • 15.
    Price and VolumeTechniques Dow Theory – major trends (tides), intermediate trends (waves), short-run movements (ripples) Ratio of upside to downside volume (>1.75 is overbought, <0.75 is oversold) Support and resistance levels – movements through these levels on high volume, breakouts Relative strength – ratio of stock price to market index, increasing is bullish, decreasing is bearish, trend expected to continue
  • 16.
    Price and VolumeTechniques Moving averages – Stock price moves through the 50-day moving average on strong volume 50-day moving average crosses the 200-day moving average on strong volume (golden cross) To identify Trends: Bar Charts – a bar from high to low price over a period with volume per period at the bottom Point and figure charts – only record price movements of some minimum amount
  • 17.
    Market Analysis HighlightsHeadline risk Dollar near lows, Euro weak (you’ll see) US Stocks fairing well vs. Intls Energy, Health Care leading the way Volume steady, low (summertime) A look at gold, silver Commodities cool off Credit markets, money velocity - Deflation
  • 18.
  • 19.
    NASDAQ 100 ETF(NDX) 9-Month
  • 20.
  • 21.
  • 22.
  • 23.
  • 24.
  • 25.
  • 26.
  • 27.
    What’s the worstETF in the world?
  • 28.
    VXX – ShortTerm VIX
  • 29.
  • 30.
    Cotton (BAL) ETF– Parabolic Move Cotton ($CT_F) Bubble Burst
  • 31.
  • 32.
  • 33.
    Fibonacci 13 th century Italian mathematician discovered a self-replicating sequence of numbers 1, 1, 2, 3, 5, 8, 13, 21, 34, 55, 89 etc Sum of two adjacent numbers forms the next number Ratio of two consecutive numbers is 1.618, or its inverse, 0.618 Thus 61.8% and 38.2% are thought to be important retracement levels
  • 34.
  • 35.
    JPY and EURvs. USD
  • 36.
  • 37.
  • 38.
  • 39.
  • 40.
  • 41.
  • 42.
  • 43.
  • 44.
  • 45.
  • 46.
  • 47.
  • 48.
  • 49.
  • 50.
  • 51.
  • 52.
    S&P 500 w/200ema& 50sma OFG Strategy: Raise Cash on 2/3 with S&P at 1090-1105 Buy back equities between 1045-1060 Reasoning: Market was in Corrective phase, 200 ema @ 1045, 10% correction at 1035 – buyers likely to step in ahead of 10% number as it had been much anticipated
  • 53.
    What Happened? Technicalcall at 1103 on the S&P turned out to be nearly exactly what occurred S&P quickly moved from 1103 to 1044.50 in only a few days and reversed higher, retracing 100% of the move downward within just 2 weeks My sectors : sold FCX in January, remained in cash in Materials Sector Energy was roughly half in cash as of 2/4 Market weight defensive Utilities Sector Bought back OIH at $115.10 (S&P 1057) 2/5 Bought back XOP at $38.38 (S&P 1049) 2/5 Bought back FCX at $69.20 (S&P 1059) 2/8 Sold on 2/19 at $77.75 for a 12.4% profit in <9 trading days
  • 54.
  • 55.
    Anomalies January EffectSell (equities) in May and Go Away Sell Treasuries in February Options Expiration – Heavy Volume Mutual Fund Monday! Final 10-20 Minutes of Trading January Barometer President’s Third Year Presidential Election Cycle
  • 56.
  • 57.
    RBOB Gas 1-YR(+$0.65)
  • 58.
  • 59.
  • 60.
    What’s Commodity isnot Performing?
  • 61.
  • 62.
  • 63.
  • 64.
  • 65.
  • 66.
  • 67.
  • 68.
    Abandoned Baby Engulfing Pattern
  • 69.
  • 70.
  • 71.
    Market Internal IndicatorsCBOE Put/Call Ratio (WILL BE UPDATED) Today: 0.76 (VIX: 20.36 +1.29, +6.8%) Advance/Decline 1092/1812 New highs/new lows 214/5 Up Volume/DownVolume 0.645 TRIN: +1.60
  • 72.
    Bollinger Bands Theindicator consists of three bands designed to encompass the majority of a security's price action. A simple moving avg in the middle An upper band (SMA plus 2 standard deviations) A lower band (SMA minus 2 standard deviations)
  • 73.
  • 74.
  • 75.
    3 More… MACD – Moving average convergance/divergance: momentum indicator that shows the relationship between two moving averages of prices. Stochastics – Slow/Fast: momentum indicator that shows the location of the current close relative to the high/low range over a set number of periods. RSI – Relative strength index: compares the magnitude of a stock's recent gains to the magnitude of its recent losses and turns that information into a number that ranges from 0 to 100.
  • 76.
  • 77.
  • 78.
  • 79.
  • 80.
  • 81.
  • 82.
  • 83.
  • 84.
  • 85.
    Flash Crash –5/6/2010 1000 point drop in Dow SPX lost 105 points (9%) intraday SPX lost 7% in about 10 minutes Recovered 6% in 20 minutes Errant trade in SPX futures PG fat finger Many stocks had ‘trade-aways’ causing scrutiny at the exchanges Shattered investor confidence Continued outflows from equity mutual funds in coming months High-frequency trading, computer algorithms: Man vs. Machine
  • 86.
  • 87.
  • 88.
  • 89.
  • 90.
  • 91.
    Or are wethe next Japan?
  • 92.
  • 93.
    All other TechnicalIndicators 100s more technical indicators If you look hard enough, you can find an indicator to agree with you (Bad!) Use technical indicators with other indicators for better results Combine TA with Fundamental Analysis for the best results!
  • 94.
    Want to bea TA? Market Technicians Association Be aware: having technical analysis on your resume can hurt you. Many firms, especially valuation firms, look down on TA Somewhat specialized, not many TA entry level positions Stocktwits/Twitter
  • 95.
    Books Edwards, RobertD. and Magee, John, Technical Analysis of Stock Trends, 9th Edition Kirkpatrick, Charles D. and Dahlquist, Julie R.: Technical Analysis The Complete Resource for Financial Market Technicians Pring, Martin J.: Technical Analysis Explained, 4th Edition Jeremy du Plessis, The Definitive Guide to Point and Figure Frost, A.J. and Prechter, Robert R., Elliott Wave Principle, Tenth Edition Kaufman, Perry J., New Trading Systems and Methods, 4th Edition Nison, Steve, Japanese Candlestick Charting Techniques, 2nd Edition Pring, Martin J., Investment Psychology Explained Aronson, David R.: Evidence-Based Technical Analysis Brown, Constance M., Technical Analysis for the Trading Professional Murphy, John J., Intermarket Analysis: Profiting From Global Market Relationships Shiller, Robert J., Irrational Exuberance, 2nd Edition O’Neil, William J, How to Make Money in Stocks (latest edition)
  • 96.
    Good Websites: Ino.com(Futures charts) Kitco.com (metal/commodities) Optionmonster.com (TA/Options) Sectorspdr.com/marketmap/ (Tree) Googlefinance Yahoofinance Bigcharts.com Briefing.com (Economic/Earnings Calendars) Twitter (live news, traders) Brokerage accounts for streaming quotes/analysis (Thinkorswim, StrategyDesk, eSignal)