Download to read offline
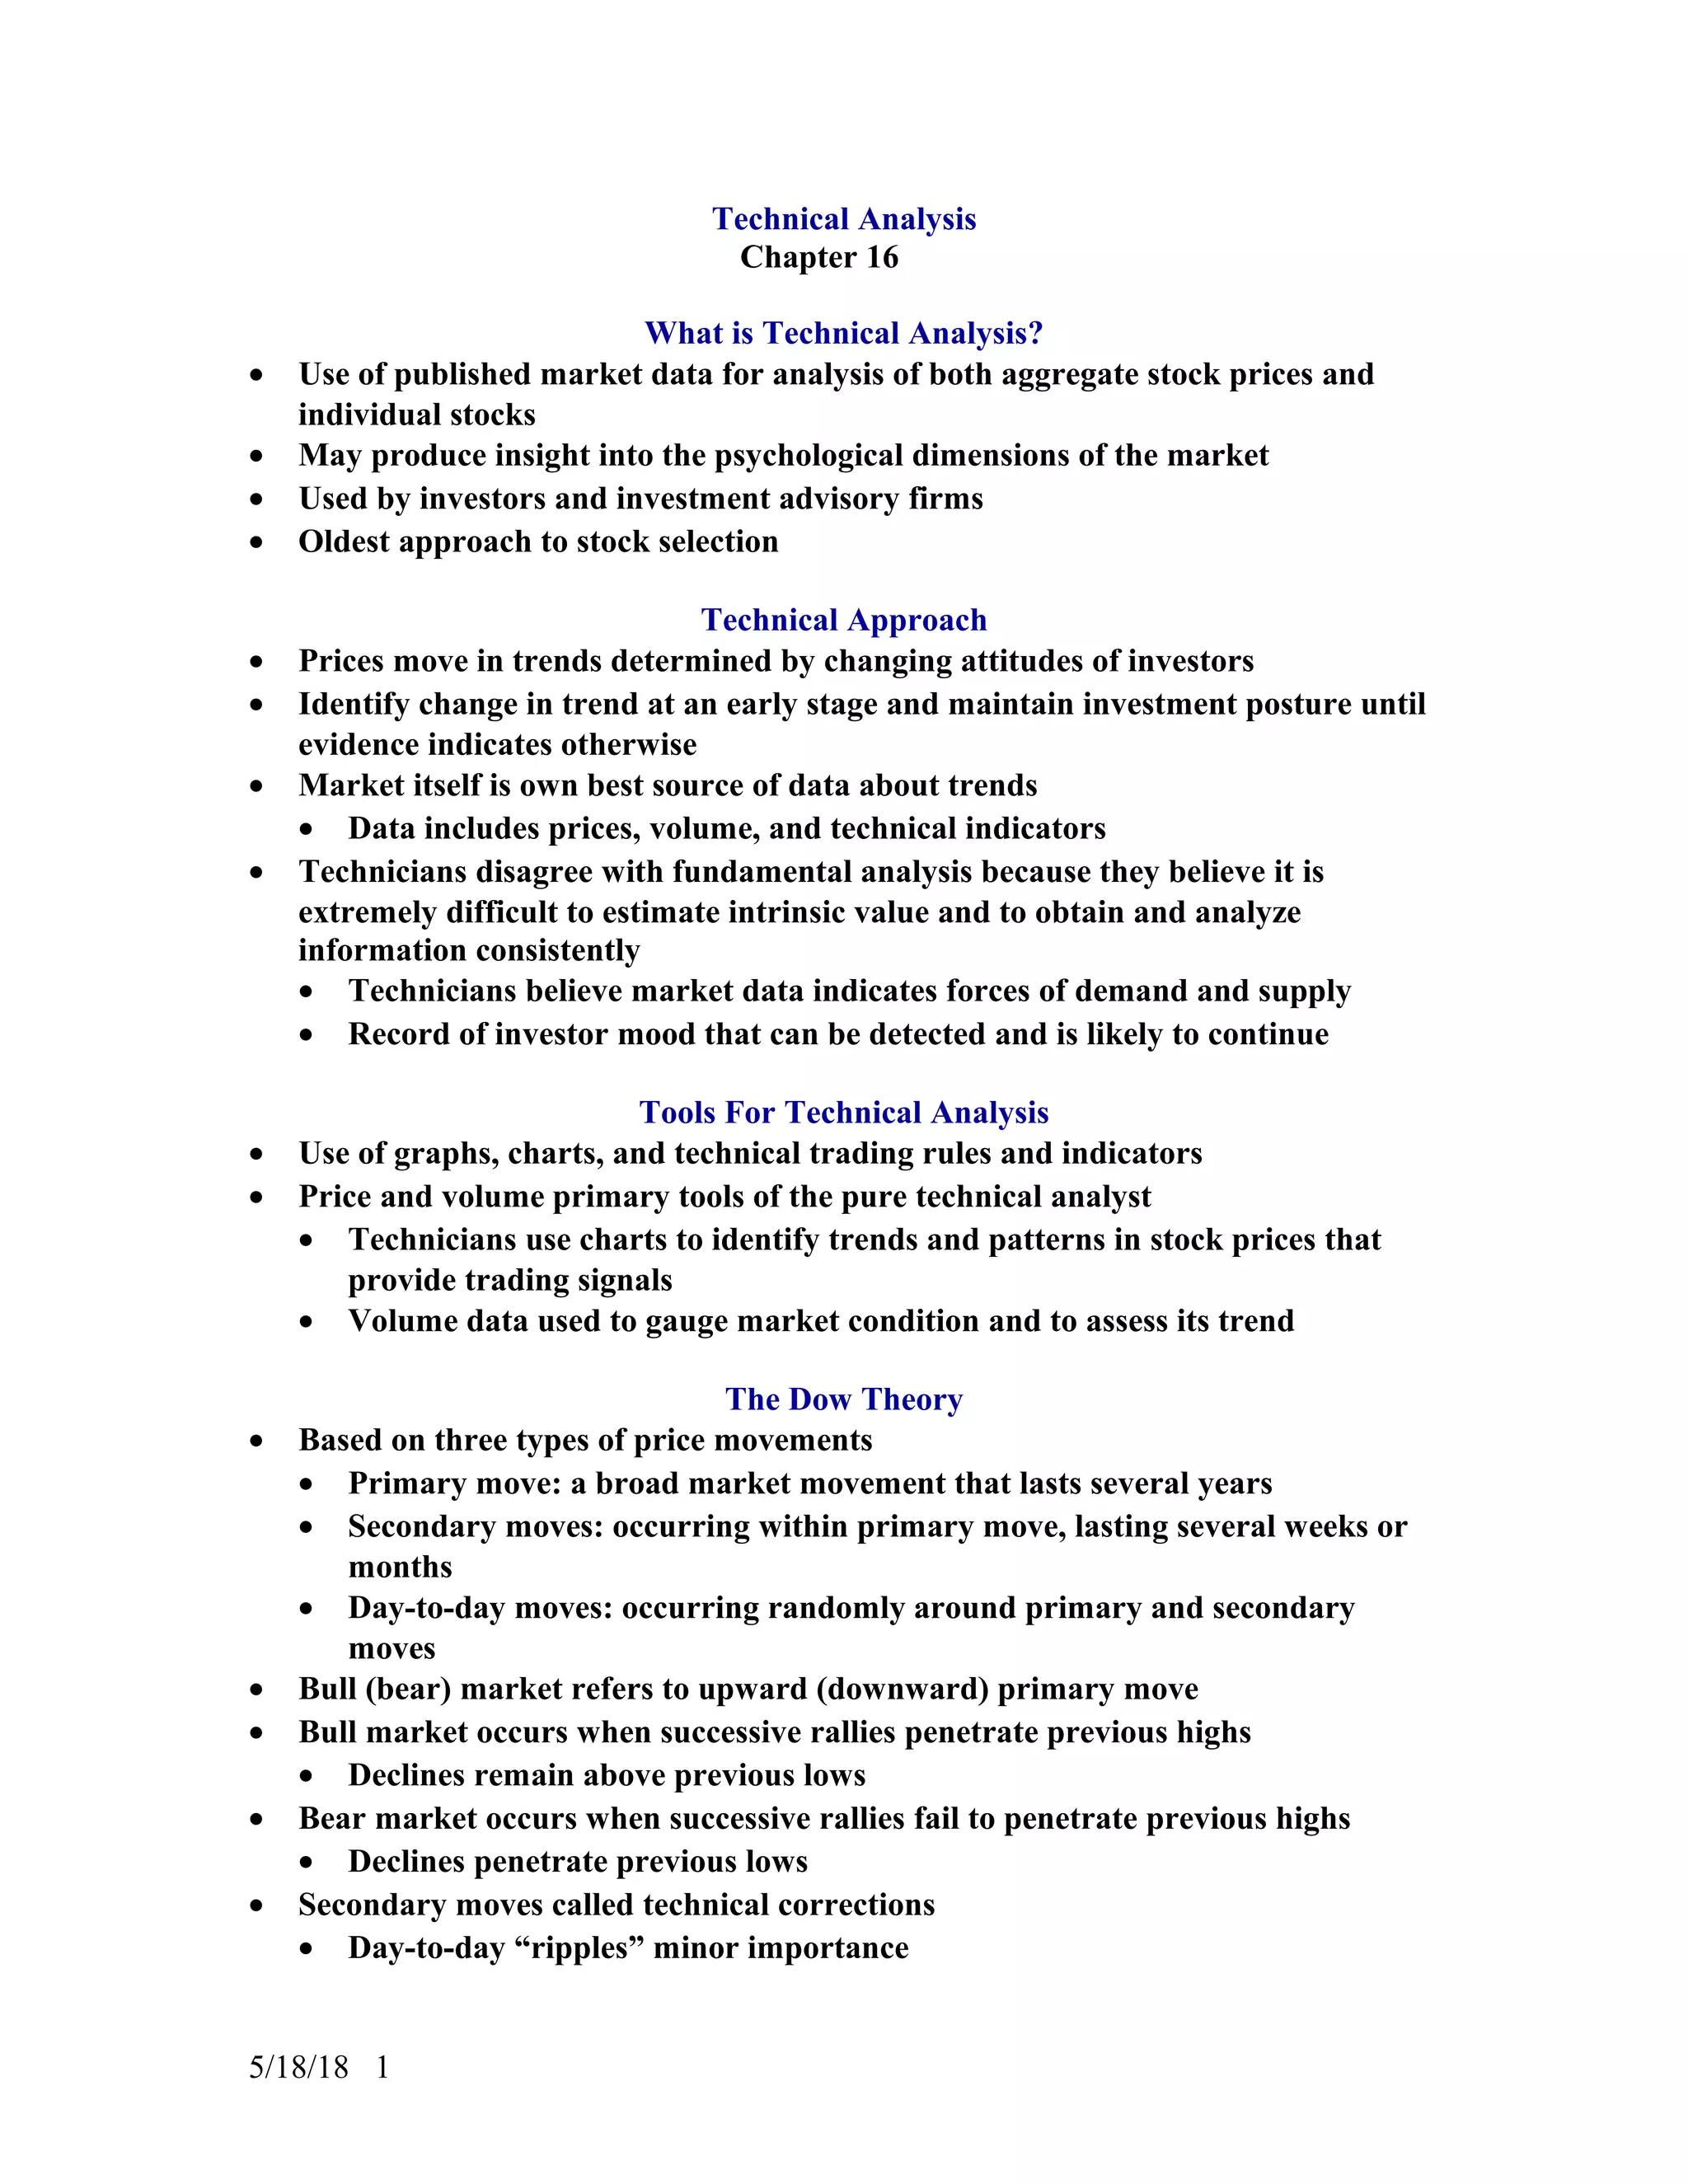
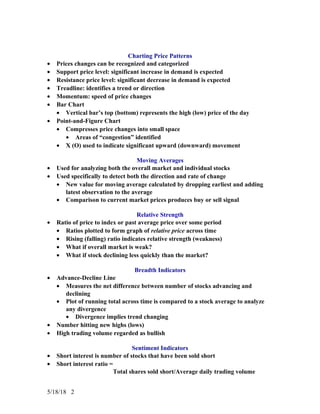
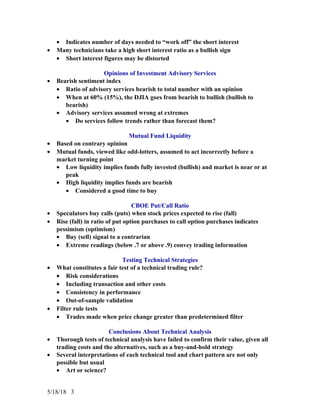


Technical analysis is the use of market data such as prices, volume, and indicators to analyze trends and patterns in stock prices. Technicians believe this data reflects investor sentiment and can be used to identify turning points in the market. Tools of technical analysis include charts, moving averages, breadth indicators, and sentiment indicators that are used to generate buy and sell signals. The Dow Theory identifies primary, secondary, and day-to-day price movements and defines bull and bear markets based on penetration of previous highs and lows. While technical analysis remains popular, thorough tests have failed to confirm its value after accounting for all costs.


