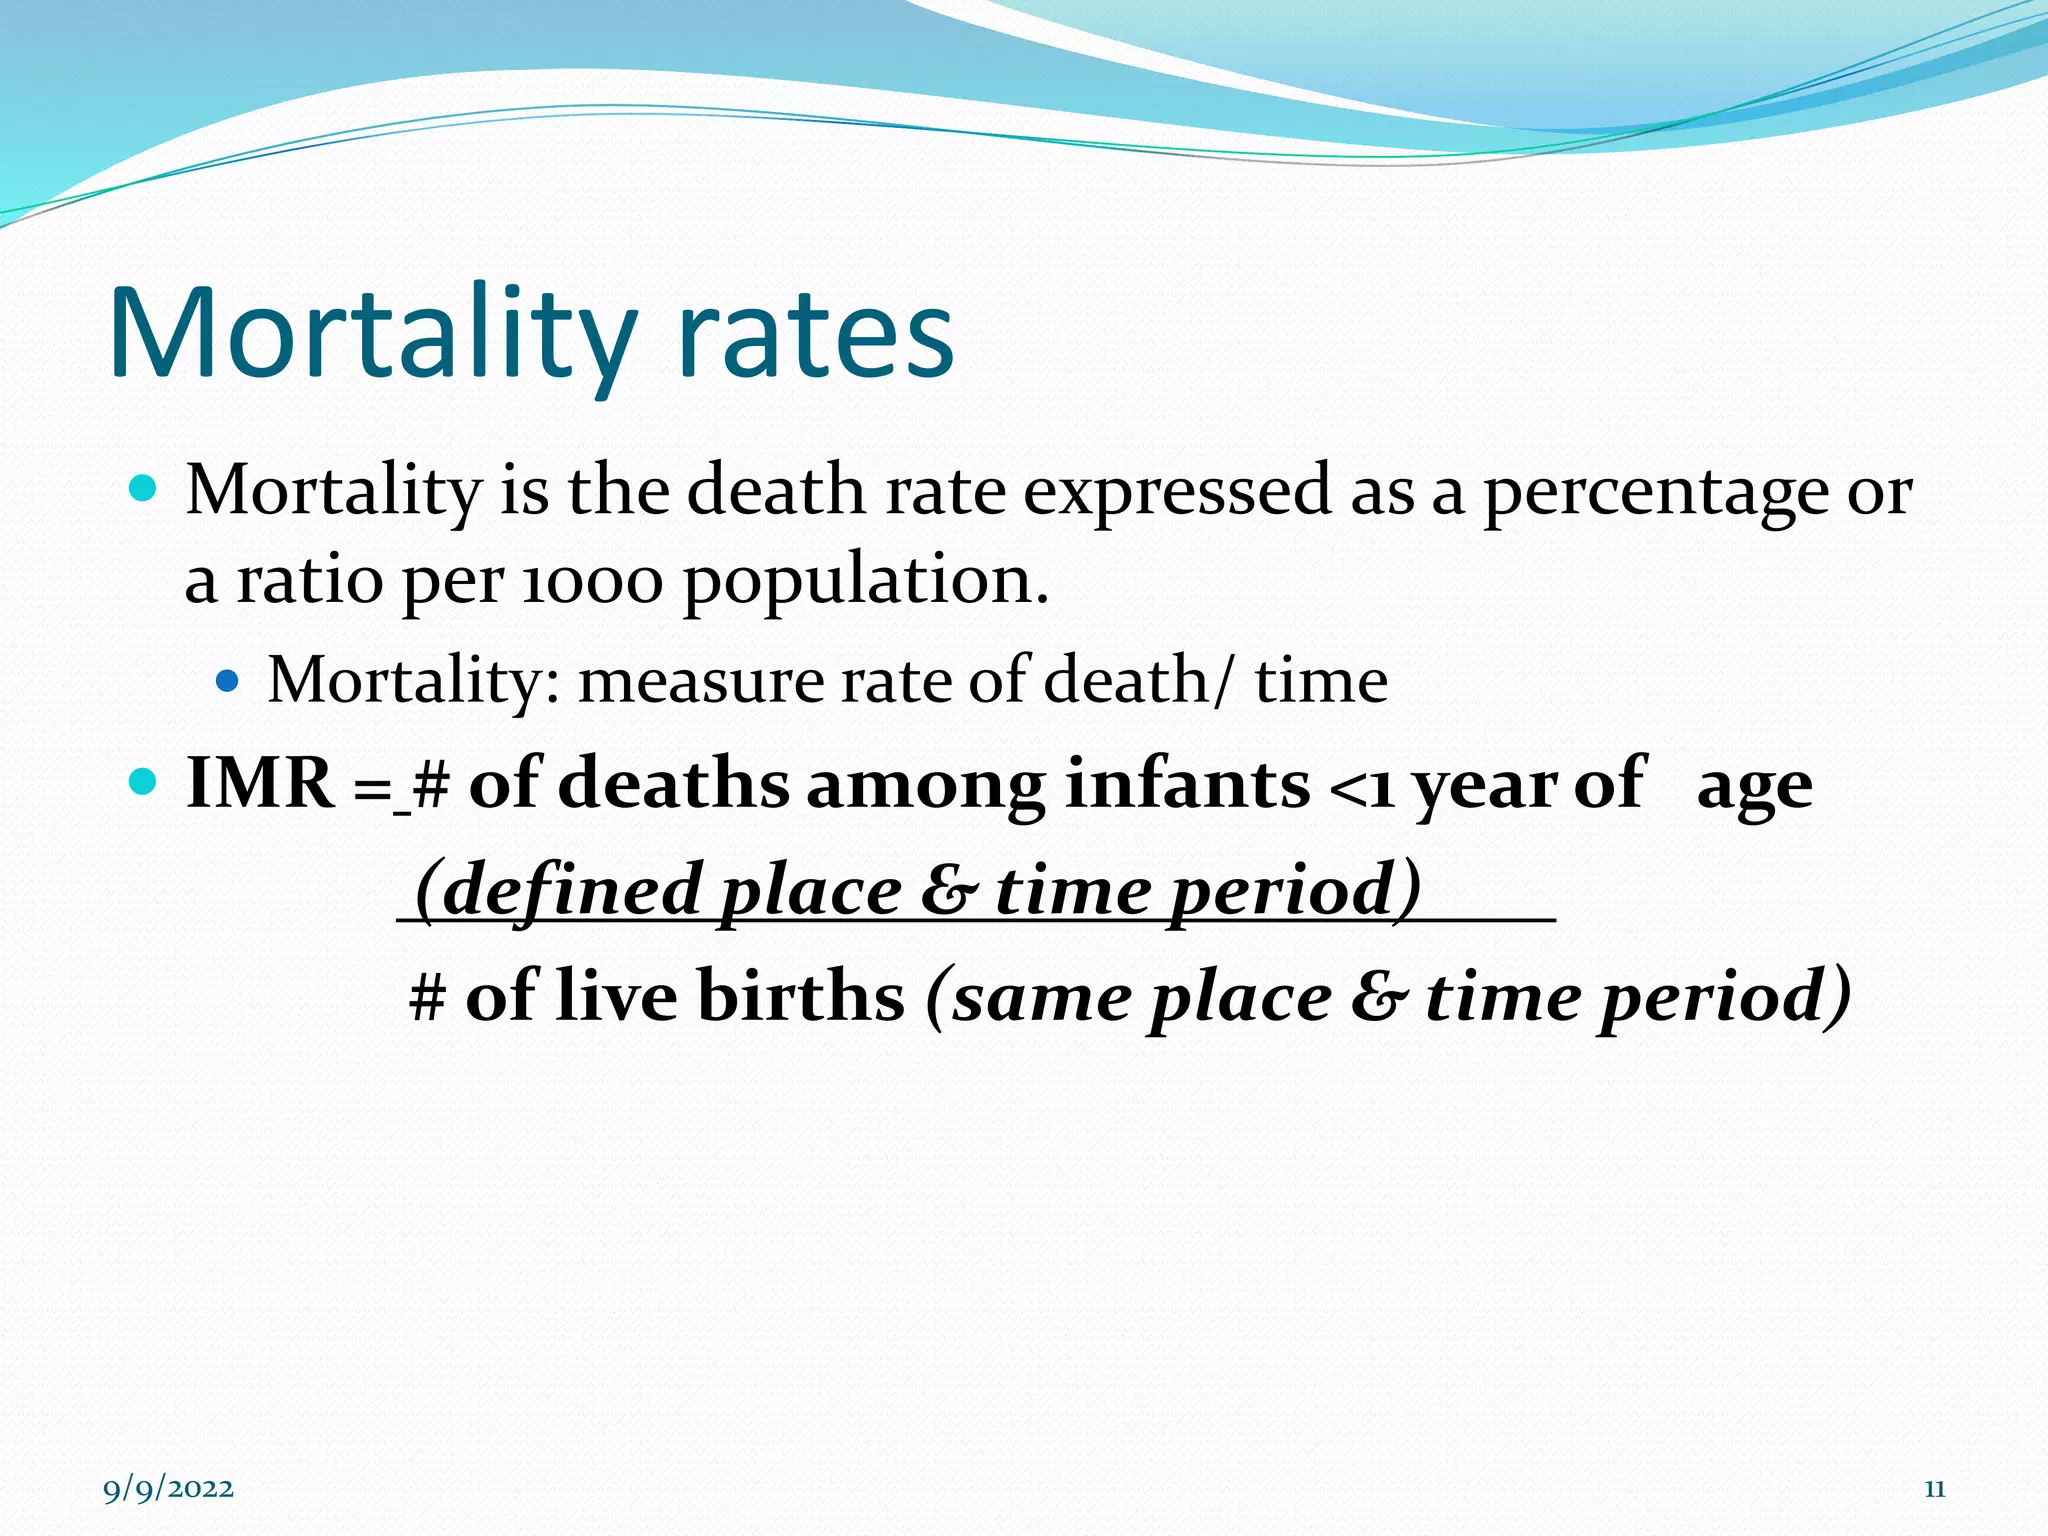
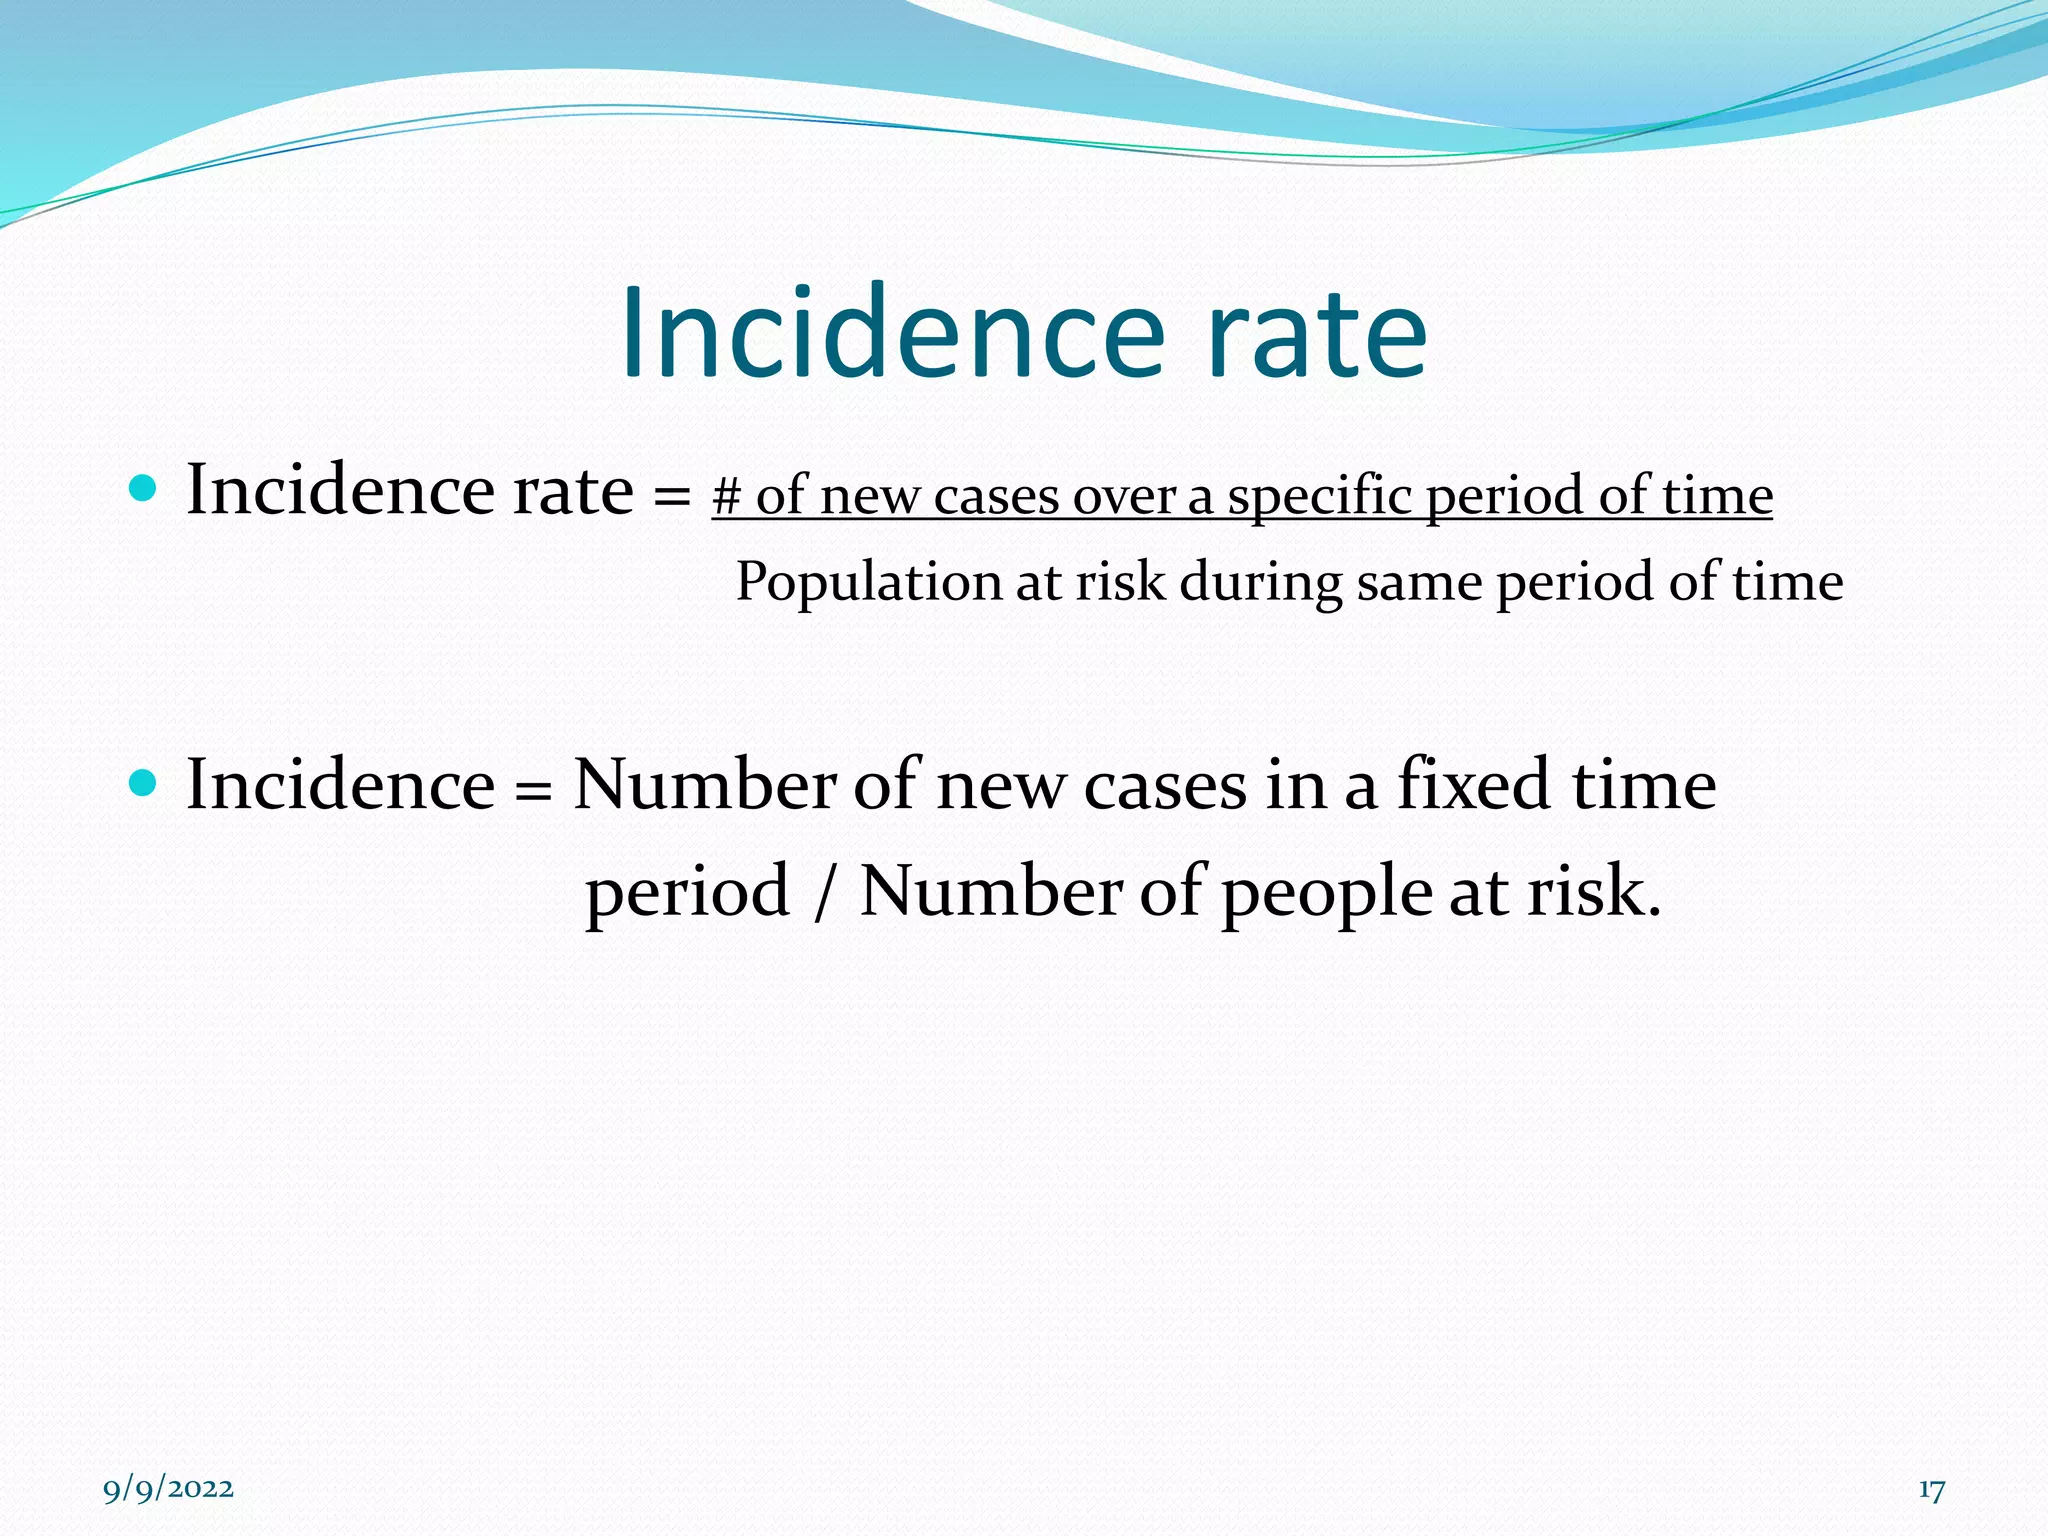
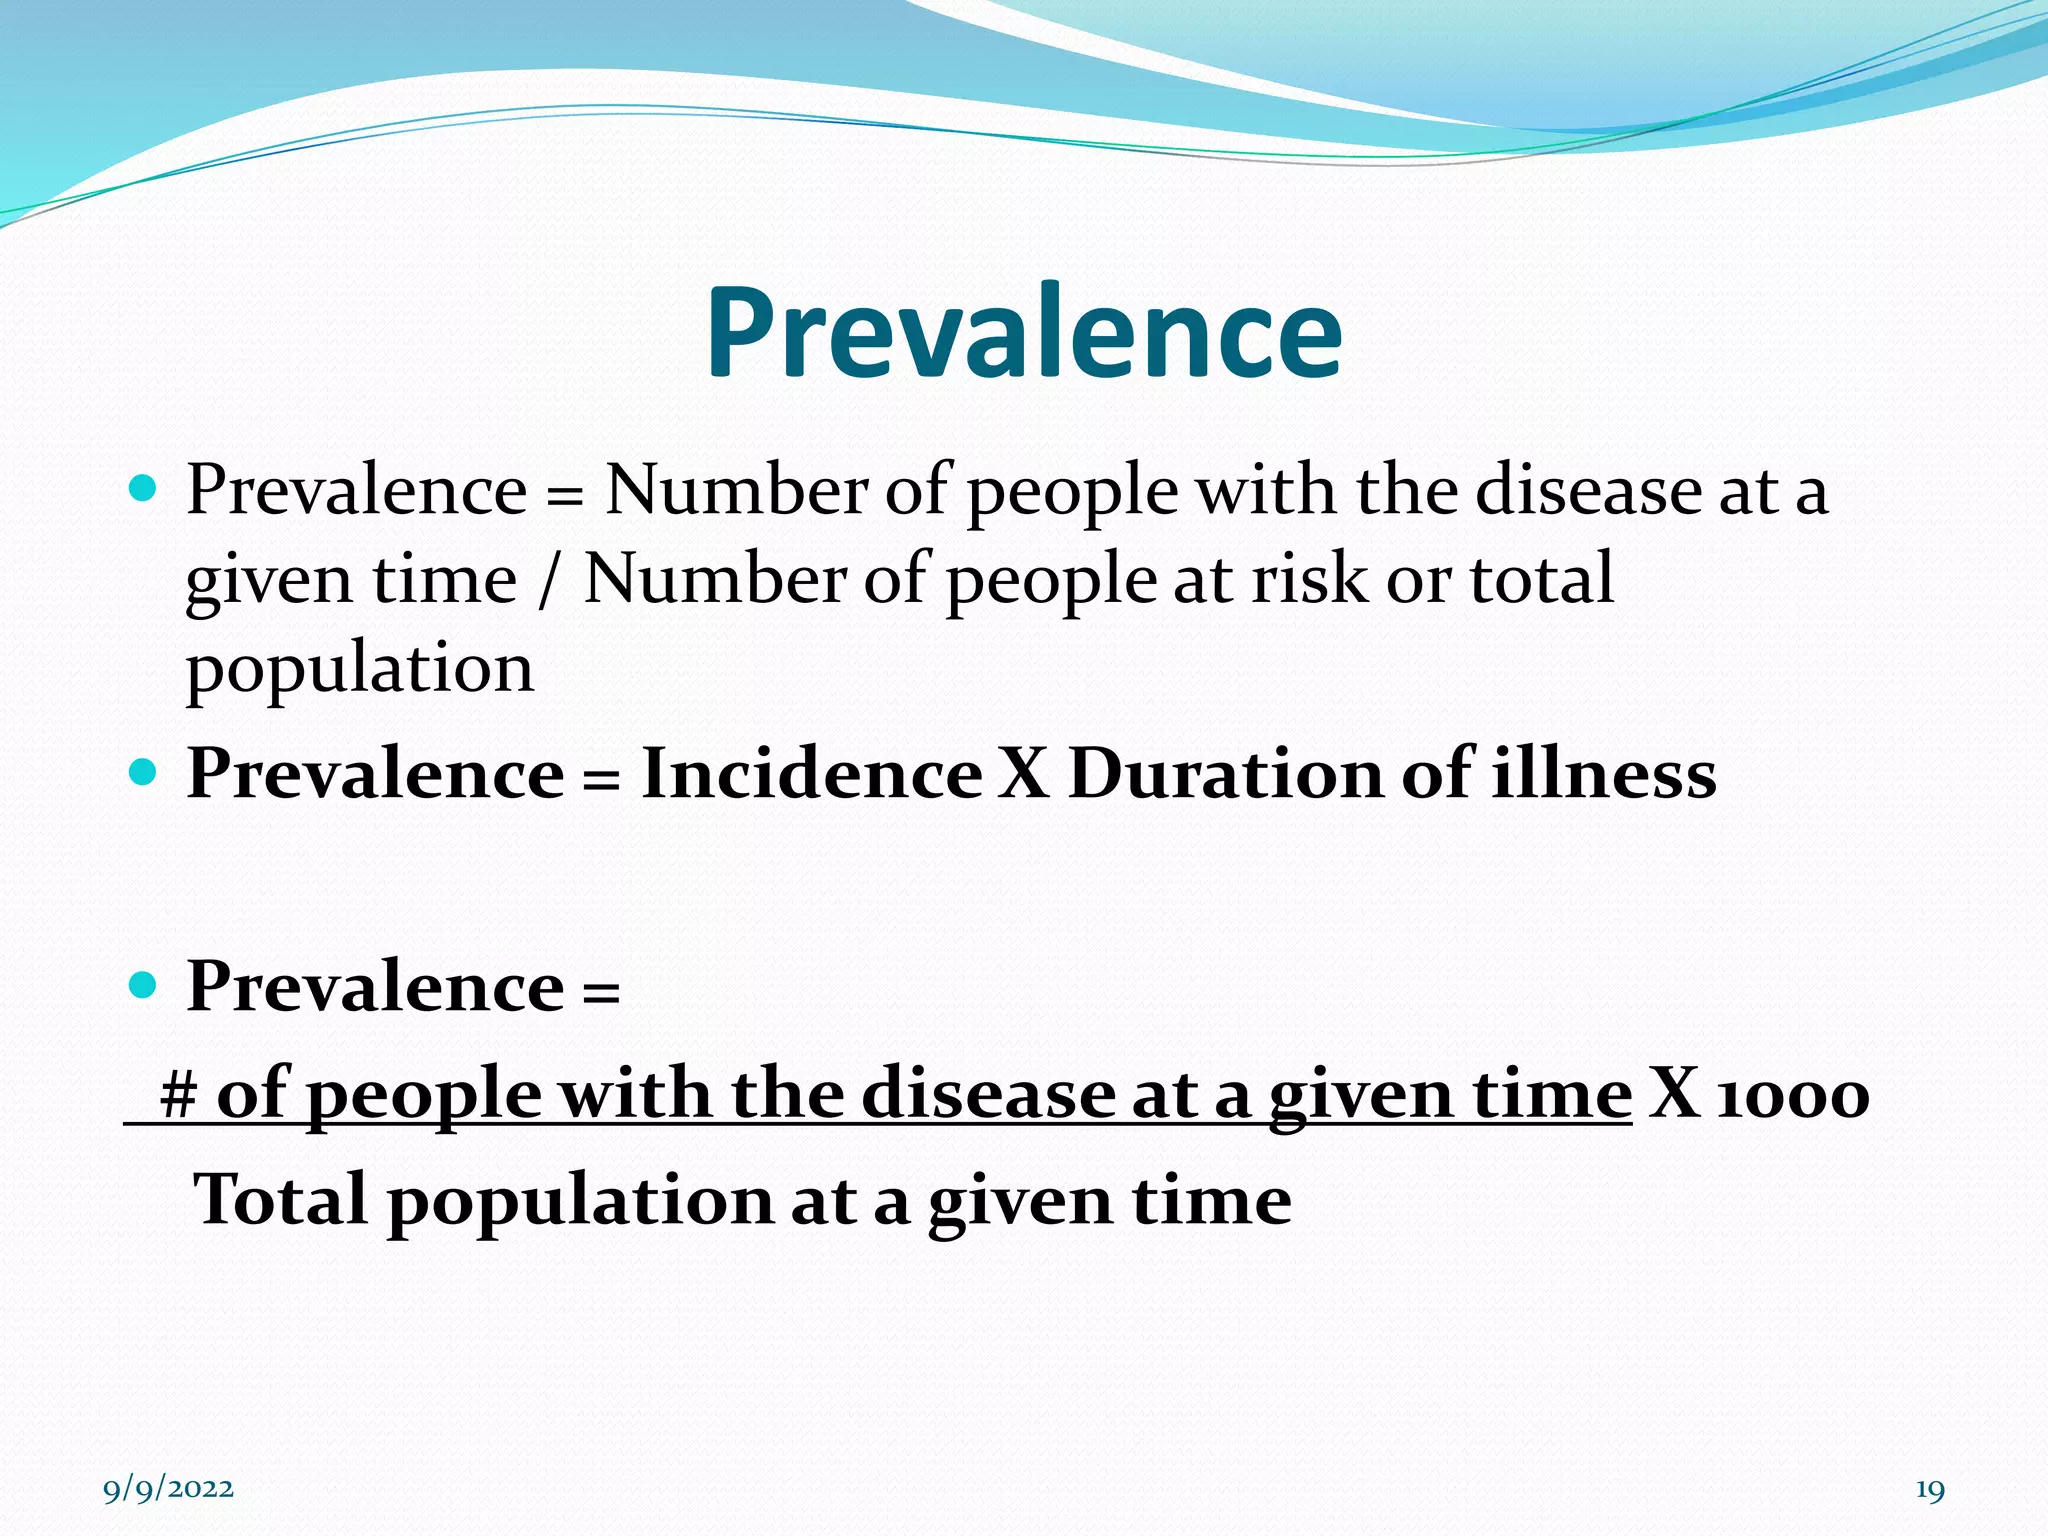
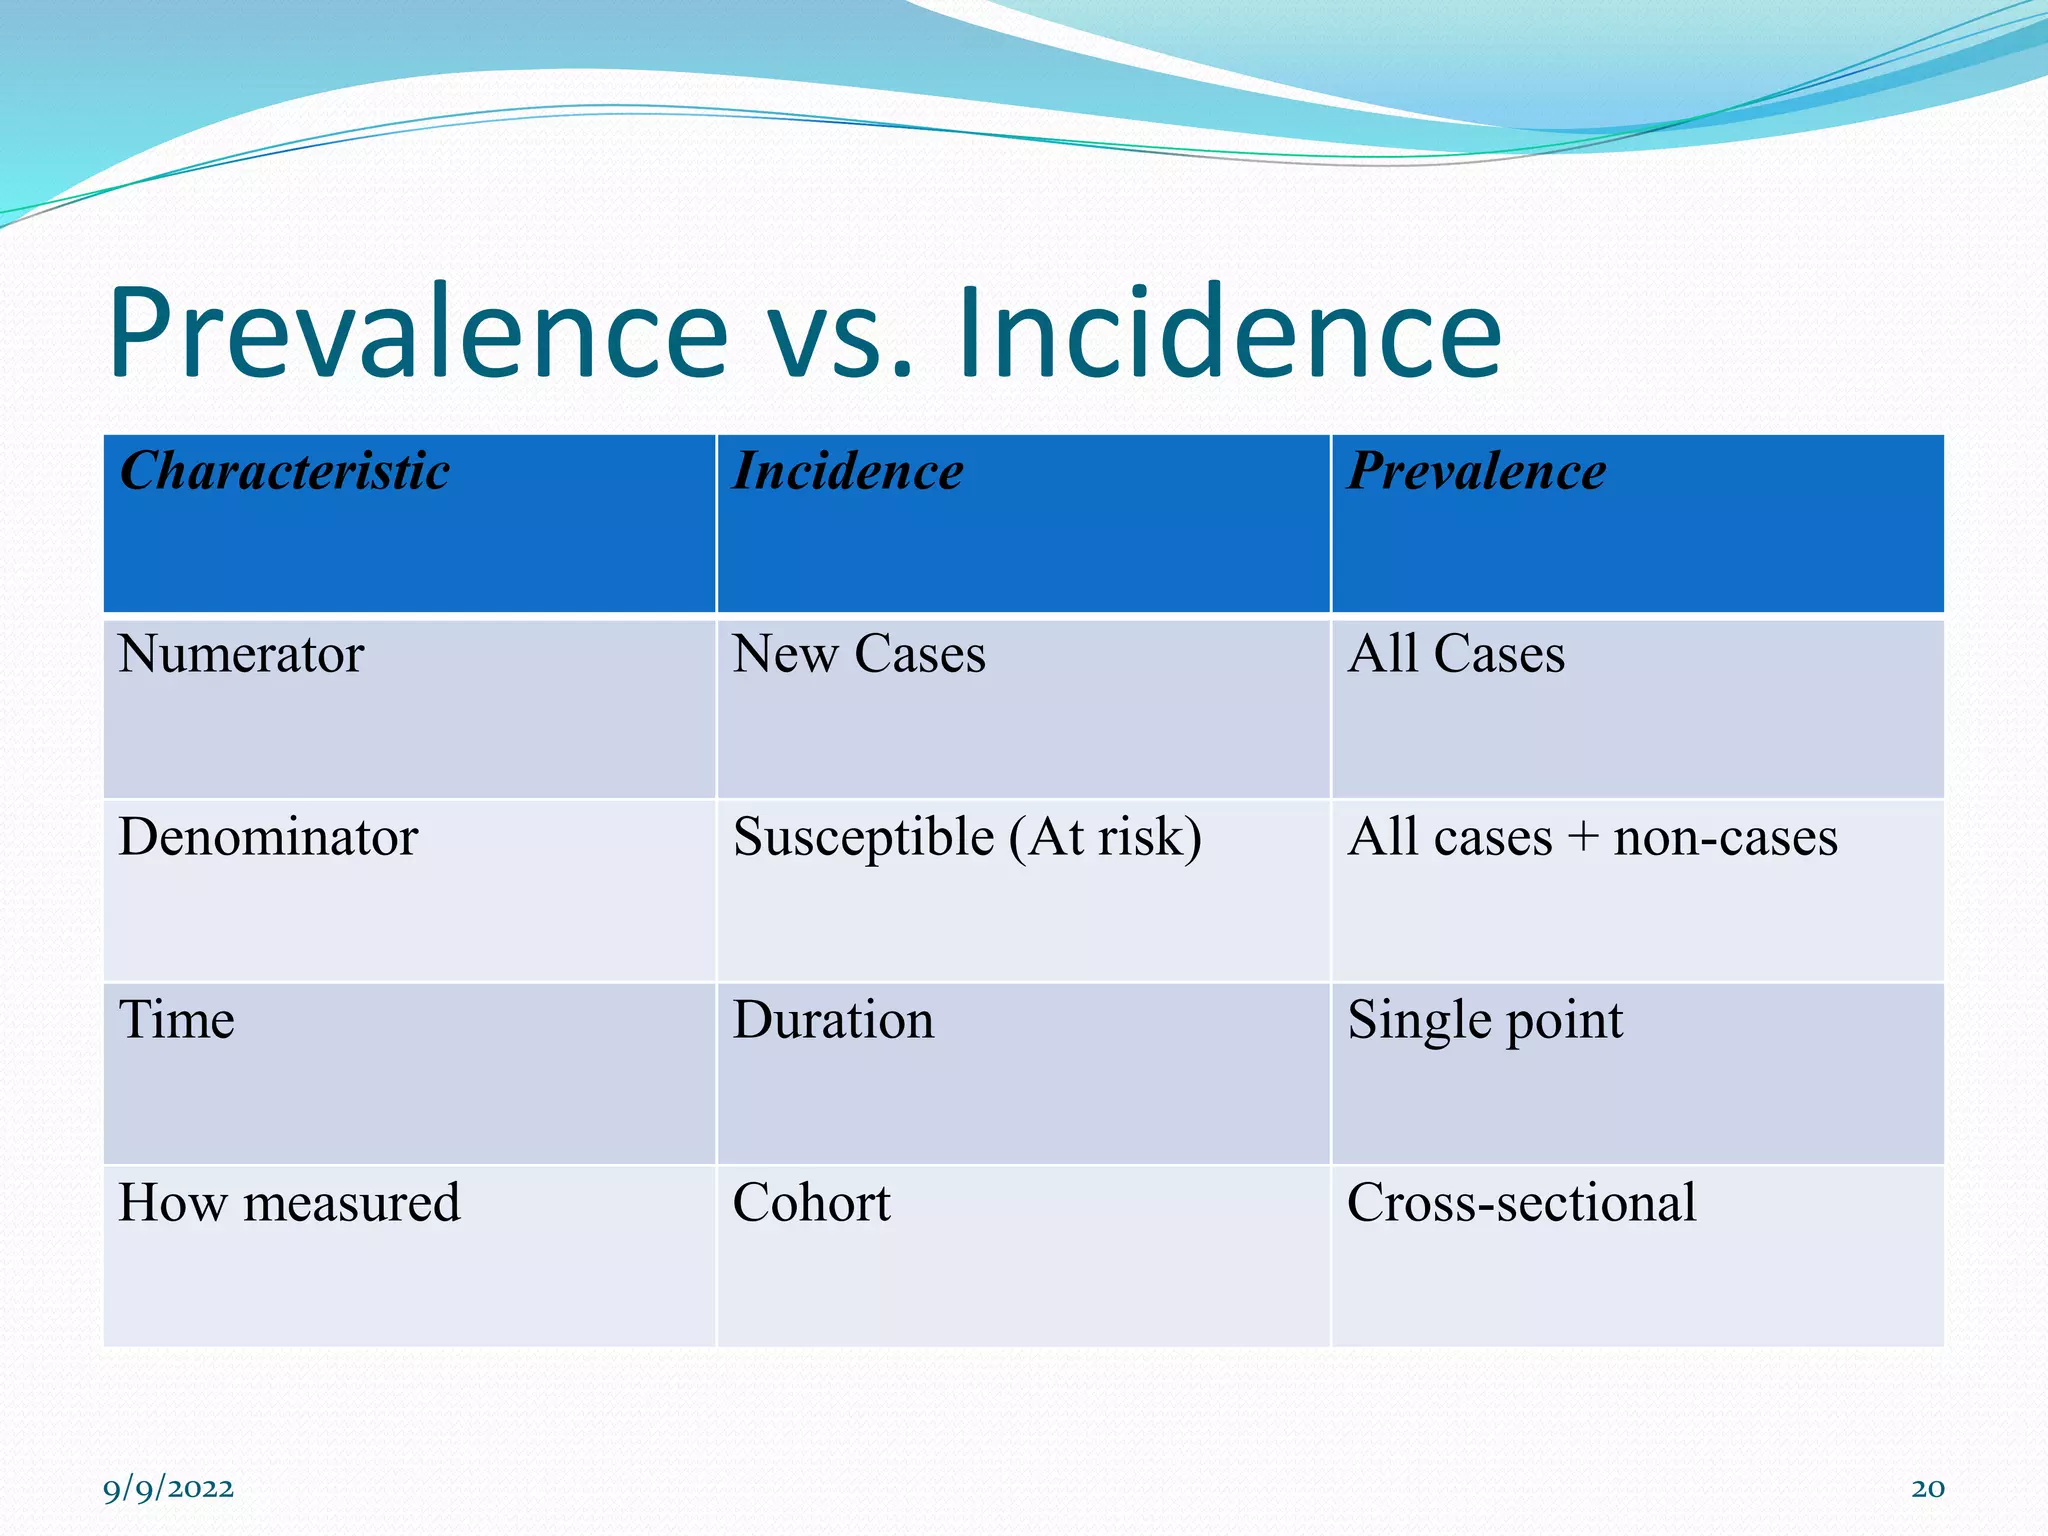
9/9/2022 1
Outline
 Morbidity
 Mortality rates: IMR, Crude mortality rate, Infant
mortality rate , age specific rate and Cause specific rate
 Incidence rate
 Prevalence
 Case fatality rate
9/9/2022 2
Ratio
• Relative magnitude of two quantities or a comparison of two
values.
• Calculated by dividing one interval- or ration scale variable by
the other.
• The numerator and denominator need not be related. Compare
apples with oranges
• Method of calculating a ratio
Number or rate of events, items, persons, etc in one group
Number or rate of events, items, persons, etc in another group
Ratio
Properties and uses of ratios
• Common descriptive measures, used in all fields.
• In epidemiology used as both descriptive measures and as
analytic tools.
• Descriptive measure; can describe the male-to-female ratio
of participants in a study, or the ratio of controls to cases
• Analytic tool; calculate of occurrence of illness, injury, or
death between two groups, includes risk ratio, rate ratio,
and odds ratio
Proportion
• Comparison of a part to the whole.
• Type of ratio in which the numerator is included in the denominator.
• Describes what fraction of clinic patients tested positive for HIV, or what
percentage of the population is younger than 25 years of age.
• A proportion may be expressed as a decimal, a fraction, or a percentage.
• Method for calculating a proportion
Number of persons or events with a particular characteristic X 10n
Total number of persons or events, of which the numerator is a subset
• For a proportion, 10n is usually 100 (or n=2) and is often expressed
as a percentage.
Proportion
Properties and uses of proportions
 Common descriptive measures used in all fields.
 In epidemiology, proportions are used most often as descriptive
measures.
• Proportion of persons enrolled in a study among all those eligible
(“participation rate”; the proportion of children in a village vaccinated
against measles, or the proportion of persons who developed illness
among all passengers of a cruise ship.
• Used to describe the amount of disease that can be attributed to a
particular exposure; eg used to describe the amount of disease that can
be attributed to a particular exposure. Measures of Risk public health
officials have estimated that greater than 90% of the lung cancer cases
that occur are attributable to cigarette smoking.
• The numerator included in the denominator. Thus, number of apples
divided by the number of oranges is not a proportion, but the number
of apples divided by the total number of fruits of all kinds is a
proportion.
Rate
 Measure of the frequency with which an event occurs in a
defined population over a specified period of time.
 Rates put disease frequency in the perspective of the size of
the population
 Useful for comparing disease frequency in different
locations, at different times, or among different
groups of persons with potentially different sized
populations; that is, a rate is a measure of risk.
Rate
• This rate is an incidence rate, term rate more loosely, referring to
proportions with case counts in the numerator and size of population in
the denominator as rates.
• E.g Attack rate is the proportion of the population that develops illness
during an outbreak. For example, 20 of 130 persons developed diarrhea
after attending a picnic.
• A prevalence rate is the proportion of the population that has a health
condition at a point in time. E.g, 70 influenza case-patients in March 2005
reported in Country .
• A case-fatality rate is the proportion of persons with the disease who die
from it.
E.g, one death due to meningitis among Country A’s population.
 All of these measures are proportions, and none is expressed per units of
time. Therefore, these measures are not considered “true” rates by some,
although use of the terminology is widespread.
Difference between Rates and
proportions
 Occurrence of disease can be measured using rates or
proportions
 Rates tell us how fast the disease is occurring in a
population
 Proportion tell us what fraction of the population is
affected
Morbidity
 Morbidity is ill health. It is the occurrence of disease
frequency and trends in a population over time.
 Morbidity: measure rate of illness/time.
 Attack rate: cumulative incidence (e.g., the proportion
of people who got sick in an outbreak)
9/9/2022 10
Mortality rates
 Mortality is the death rate expressed as a percentage or
a ratio per 1000 population.
 Mortality: measure rate of death/ time
 IMR = # of deaths among infants <1 year of age
(defined place & time period)
# of live births (same place & time period)
9/9/2022 11
 Crude mortality rate: mortality from all causes for a
specified population over a specified period of time
(usually a year)
9/9/2022 12
 Cause-specific mortality rate: mortality rate from a
specified cause for a specified population (usually a
year)
9/9/2022 13
 Age-specific mortality rate: a mortality limiting
numerator and denominator to an age or age group
(usually a year)
9/9/2022 14
 Infant mortality rate: number of deaths among <1 yr.
children in a given time period divided by number of
births during same time period (usually a year)
 Calculate the IMR for Zambia 2010 Census
 # of infant deaths – 19,882
 # of live births – 442,998
 Answer:
 IMR = 19,882 x 1000
442,998
= 44.9 per 1000 in 2010
9/9/2022 15
Incidence rate
 Incidence rate
 Measure of new cases of illness or occurrences of a
condition. Incidence rate is the basic measure of
disease occurrence, which is defined as number of new
cases that occur in a population during a period of
time over the total sum of individuals in the
population at risk of getting the disease at a specific
period of time.
9/9/2022 16
Incidence rate
 Incidence rate = # of new cases over a specific period of time
Population at risk during same period of time
 Incidence = Number of new cases in a fixed time
period / Number of people at risk.
9/9/2022 17
Prevalence
 Proportion of individuals in a population who have the
disease (or condition) at a given time. Includes all of
the people with the condition, whether or not they just
developed it or have had it for years and is often
reported as a percent (%). Proportion of individuals in
a population who have the disease (or condition) at a
given time
9/9/2022 18
Prevalence
 Prevalence = Number of people with the disease at a
given time / Number of people at risk or total
population
 Prevalence = Incidence X Duration of illness
 Prevalence =
# of people with the disease at a given time X 1000
Total population at a given time
9/9/2022 19
Prevalence vs. Incidence
Characteristic Incidence Prevalence
Numerator New Cases All Cases
Denominator Susceptible (At risk) All cases + non-cases
Time Duration Single point
How measured Cohort Cross-sectional
9/9/2022 20
Case Fatality Rate
 Case Fatality Rate. The proportion of people with a
specified condition who die within a specified
time. The time frame is typically the period during
which the patient is sick from the disease.
 This works for an infectious disease but can be
problematic for a chronic disease like a cancer that
may remit for a period and then prove fatal after a
recurrence.
 Case fatality rate =
# of cases who die within given time X 100
# of all cases within given time
9/9/2022 21
THANK YOU!!!!!
Questions
9/9/2022 22

LECTURE 6 EPIDEMIOLOGICAL CALCULATIONS.pptx

  • 1.
  • 2.
    Outline  Morbidity  Mortalityrates: IMR, Crude mortality rate, Infant mortality rate , age specific rate and Cause specific rate  Incidence rate  Prevalence  Case fatality rate 9/9/2022 2
  • 3.
    Ratio • Relative magnitudeof two quantities or a comparison of two values. • Calculated by dividing one interval- or ration scale variable by the other. • The numerator and denominator need not be related. Compare apples with oranges • Method of calculating a ratio Number or rate of events, items, persons, etc in one group Number or rate of events, items, persons, etc in another group
  • 4.
    Ratio Properties and usesof ratios • Common descriptive measures, used in all fields. • In epidemiology used as both descriptive measures and as analytic tools. • Descriptive measure; can describe the male-to-female ratio of participants in a study, or the ratio of controls to cases • Analytic tool; calculate of occurrence of illness, injury, or death between two groups, includes risk ratio, rate ratio, and odds ratio
  • 5.
    Proportion • Comparison ofa part to the whole. • Type of ratio in which the numerator is included in the denominator. • Describes what fraction of clinic patients tested positive for HIV, or what percentage of the population is younger than 25 years of age. • A proportion may be expressed as a decimal, a fraction, or a percentage. • Method for calculating a proportion Number of persons or events with a particular characteristic X 10n Total number of persons or events, of which the numerator is a subset • For a proportion, 10n is usually 100 (or n=2) and is often expressed as a percentage.
  • 6.
    Proportion Properties and usesof proportions  Common descriptive measures used in all fields.  In epidemiology, proportions are used most often as descriptive measures. • Proportion of persons enrolled in a study among all those eligible (“participation rate”; the proportion of children in a village vaccinated against measles, or the proportion of persons who developed illness among all passengers of a cruise ship. • Used to describe the amount of disease that can be attributed to a particular exposure; eg used to describe the amount of disease that can be attributed to a particular exposure. Measures of Risk public health officials have estimated that greater than 90% of the lung cancer cases that occur are attributable to cigarette smoking. • The numerator included in the denominator. Thus, number of apples divided by the number of oranges is not a proportion, but the number of apples divided by the total number of fruits of all kinds is a proportion.
  • 7.
    Rate  Measure ofthe frequency with which an event occurs in a defined population over a specified period of time.  Rates put disease frequency in the perspective of the size of the population  Useful for comparing disease frequency in different locations, at different times, or among different groups of persons with potentially different sized populations; that is, a rate is a measure of risk.
  • 8.
    Rate • This rateis an incidence rate, term rate more loosely, referring to proportions with case counts in the numerator and size of population in the denominator as rates. • E.g Attack rate is the proportion of the population that develops illness during an outbreak. For example, 20 of 130 persons developed diarrhea after attending a picnic. • A prevalence rate is the proportion of the population that has a health condition at a point in time. E.g, 70 influenza case-patients in March 2005 reported in Country . • A case-fatality rate is the proportion of persons with the disease who die from it. E.g, one death due to meningitis among Country A’s population.  All of these measures are proportions, and none is expressed per units of time. Therefore, these measures are not considered “true” rates by some, although use of the terminology is widespread.
  • 9.
    Difference between Ratesand proportions  Occurrence of disease can be measured using rates or proportions  Rates tell us how fast the disease is occurring in a population  Proportion tell us what fraction of the population is affected
  • 10.
    Morbidity  Morbidity isill health. It is the occurrence of disease frequency and trends in a population over time.  Morbidity: measure rate of illness/time.  Attack rate: cumulative incidence (e.g., the proportion of people who got sick in an outbreak) 9/9/2022 10
  • 11.
    Mortality rates  Mortalityis the death rate expressed as a percentage or a ratio per 1000 population.  Mortality: measure rate of death/ time  IMR = # of deaths among infants <1 year of age (defined place & time period) # of live births (same place & time period) 9/9/2022 11
  • 12.
     Crude mortalityrate: mortality from all causes for a specified population over a specified period of time (usually a year) 9/9/2022 12
  • 13.
     Cause-specific mortalityrate: mortality rate from a specified cause for a specified population (usually a year) 9/9/2022 13
  • 14.
     Age-specific mortalityrate: a mortality limiting numerator and denominator to an age or age group (usually a year) 9/9/2022 14
  • 15.
     Infant mortalityrate: number of deaths among <1 yr. children in a given time period divided by number of births during same time period (usually a year)  Calculate the IMR for Zambia 2010 Census  # of infant deaths – 19,882  # of live births – 442,998  Answer:  IMR = 19,882 x 1000 442,998 = 44.9 per 1000 in 2010 9/9/2022 15
  • 16.
    Incidence rate  Incidencerate  Measure of new cases of illness or occurrences of a condition. Incidence rate is the basic measure of disease occurrence, which is defined as number of new cases that occur in a population during a period of time over the total sum of individuals in the population at risk of getting the disease at a specific period of time. 9/9/2022 16
  • 17.
    Incidence rate  Incidencerate = # of new cases over a specific period of time Population at risk during same period of time  Incidence = Number of new cases in a fixed time period / Number of people at risk. 9/9/2022 17
  • 18.
    Prevalence  Proportion ofindividuals in a population who have the disease (or condition) at a given time. Includes all of the people with the condition, whether or not they just developed it or have had it for years and is often reported as a percent (%). Proportion of individuals in a population who have the disease (or condition) at a given time 9/9/2022 18
  • 19.
    Prevalence  Prevalence =Number of people with the disease at a given time / Number of people at risk or total population  Prevalence = Incidence X Duration of illness  Prevalence = # of people with the disease at a given time X 1000 Total population at a given time 9/9/2022 19
  • 20.
    Prevalence vs. Incidence CharacteristicIncidence Prevalence Numerator New Cases All Cases Denominator Susceptible (At risk) All cases + non-cases Time Duration Single point How measured Cohort Cross-sectional 9/9/2022 20
  • 21.
    Case Fatality Rate Case Fatality Rate. The proportion of people with a specified condition who die within a specified time. The time frame is typically the period during which the patient is sick from the disease.  This works for an infectious disease but can be problematic for a chronic disease like a cancer that may remit for a period and then prove fatal after a recurrence.  Case fatality rate = # of cases who die within given time X 100 # of all cases within given time 9/9/2022 21
  • 22.