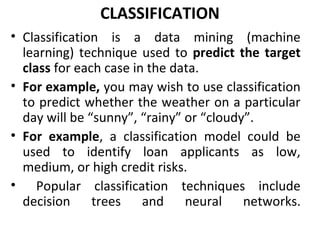
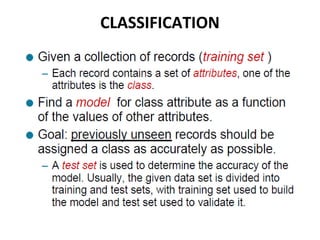
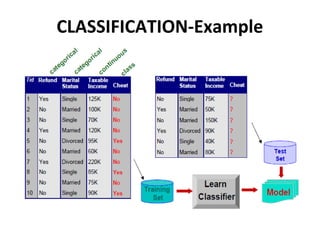
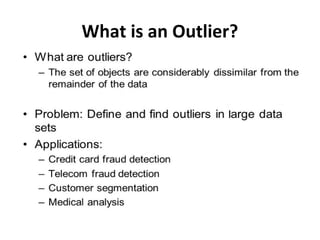
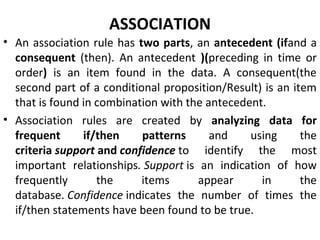
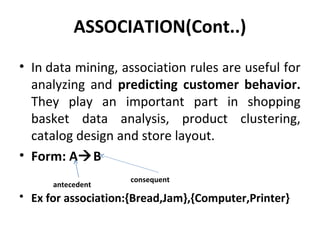
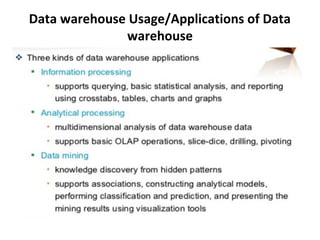
2. DATA MINING Task/Functions
• Classification
• Clustering
• Outlier analysis
• Association
• Prediction/Regression
3. CLASSIFICATION
• Classification is a data mining (machine
learning) technique used to predict the target
class for each case in the data.
• For example, you may wish to use classification
to predict whether the weather on a particular
day will be “sunny”, “rainy” or “cloudy”.
• For example, a classification model could be
used to identify loan applicants as low,
medium, or high credit risks.
• Popular classification techniques include
decision trees and neural networks.
6. Clustering
• Classification is supervised learning the supervision comes from
labeling the instances with the class.
• Clustering is unsupervised learning -- there are no predefined
class labels, no training set.
• So our clustering algorithm needs to assign a cluster to each
instance such that all objects with the same cluster are more
similar than others.
7. Clustering
• Finding groups of objects such that the objects in a group will be similar
(or related) to one another and different from (or unrelated to) the
objects in other groups
• The goal is to find the most 'natural' groupings of the instances.
- Within a cluster: Maximize similarity between instances.
- Between clusters: Minimize similarity between instances.
Inter-cluster
distances are
maximizedIntra-cluster
distances are
minimized
10. ASSOCIATION
• An association rule has two parts, an antecedent (ifand a
consequent (then). An antecedent )(preceding in time or
order) is an item found in the data. A consequent(the
second part of a conditional proposition/Result) is an item
that is found in combination with the antecedent.
• Association rules are created by analyzing data for
frequent if/then patterns and using the
criteria support and confidence to identify the most
important relationships. Support is an indication of how
frequently the items appear in the
database. Confidence indicates the number of times the
if/then statements have been found to be true.
13. Data Mining Applications in Sales/Marketing- Ex
For Association
• Discover consumer groups based on their purchasing
habits, thus helping in planning and launching new
marketing campaigns in prompt and cost effective way.
• Data mining is used for market basket analysis to provide
information on what product combinations were
purchased together when they were bought and in what
sequence.
14. Data Mining Applications in Banking –Ex For
Classification
• Data mining is used to identify customers loyalty by analyzing
the data of customer’s purchasing activities such as the data
of frequency of purchase in a period of time, a total monetary
value of all purchases and when was the last purchase. After
analyzing those dimensions, the relative measure is generated
for each customer. The higher of the score, the more relative
loyal the customer is.
• To help the bank to retain credit card customers, data mining is
applied. By analyzing the past data, data mining can help banks
predict customers that likely to change their credit card
affiliation so they can plan and launch different special offers to
retain those customers.
15. Data Mining Applications in Banking –Ex
For Clustering
• Given:
– A source of textual
documents
– Similarity measure
• e.g., how many words
are common in these
documents
Clustering
System
Similarity
measure
Documents
source
Doc
Do
c
Doc
Doc
Doc
DocDoc
Doc
Doc
Doc
• Find:
• Several clusters of documents
that are relevant to each
other
16. Association Rules
• A common application
is market basket
analysis which
(1) items are frequently
sold together at a
supermarket
(2) arranging items on
shelves which items
should be promoted
together
19. Why Data Preprocessing?
• Data in the real world is dirty.
noisy: containing errors or outliers.
Incomplete: Missing Values, Lacking attribute
values.
Inconsistent Data
• No quality data, no quality mining results!
– Quality decisions must be based on quality data
– Data warehouse needs consistent integration of quality
data
20. Major Tasks in Data
Preprocessing
• Data cleaning
– Fill in missing values, smooth noisy data, identify or remove outliers,
and resolve inconsistencies
• Data integration
– Integration of multiple databases, data cubes, or files
• Data transformation
– Normalization and aggregation
• Data reduction
– Obtains reduced representation in volume but produces the same or
similar analytical results
22. Data Cleaning
• Data cleaning tasks
– Fill in missing values
– Identify outliers and smooth out noisy data
– Correct inconsistent data
23. What is Missing Data?
• Data is not always available
– E.g., many tuples have no recorded value for several attributes,
such as customer income in sales data
• Missing data may be due to
– equipment malfunction
– inconsistent with other recorded data and thus deleted
– data not entered due to misunderstanding
– certain data may not be considered important at the time of entry
– not register history or changes of the data
24. How to Handle Missing Data?
• Ignore the tuple: usually done when class label is missing
(Can be applicable for large data set)
• Fill in the missing value manually: tedious + infeasible for large
database?
• Use a global constant to fill in the missing value
• Use the attribute mean to fill in the missing value
• Use the most probable value to fill in the missing value:
inference-based such as Bayesian formula or decision tree
25. Noisy Data/Outlier
• Noise: random error or variance in a measured
variable
• Incorrect attribute values may due to
– faulty data collection instruments
– data entry problems
– data transmission problems
– inconsistency in naming convention
– duplicate records
– incomplete data
– inconsistent data
26. OUTLIER
• A Data object or observations that do not
comply with the general behavior or model of
the data. Such data objects, which are grossly
different from or inconsistent with the
remaining set of data, are called outliers.
• A data object that deviates significantly from
the normal objects as if it were generated by a
different mechanism.
27. How to Handle Noisy Data?
(Not Now)
• Binning method
• Clustering
• Combined computer and human
inspection
• Regression
29. Data Integration
• Data integration:
– combines data from multiple sources into a coherent store
Three Problems involved in data integration
Schema integration
Detecting and resolving data value conflicts.
Redundant data occur often when integration of multiple
databases
30. Data Transformation
• Smoothing: remove noise from data
• Aggregation: summarization, data cube construction
• Generalization: concept hierarchy climbing
• Normalization: scaled to fall within a small, specified range
– min-max normalization
– z-score normalization
– normalization by decimal scaling
32. Data Reduction Strategies
• Warehouse may store terabytes of data: Complex data
analysis/mining may take a very long time to run on the
complete data set
• Data reduction
– Obtains a reduced representation of the data set that is much
smaller in volume but yet produces the same (or almost the
same) analytical results
• Data reduction strategies
– Data cube aggregation(Ex:Construction of Datacube)
– Numerosity reduction(Ex:Generating Histograms)
– concept hierarchy generation
33. Data Cube Aggregation
• The lowest level of a data cube
– the aggregated data for an individual entity of interest
– e.g., a customer in a phone calling data warehouse.
• Multiple levels of aggregation in data cubes
– Further reduce the size of data to deal with
• Reference appropriate levels
– Use the smallest representation which is enough to solve the
task
34. Numerosity reduction-Histograms
• A popular data reduction
technique
• Divide data into buckets
and store average (sum) for
each bucket
• Can be constructed
optimally in one dimension
using dynamic
programming
• Related to quantization
problems.
0
5
10
15
20
25
30
35
40
10000 30000 50000 70000 90000
35. Numerosity reduction-Clustering
• Partition data set into clusters, and one can store cluster
representation only
• Can be very effective if data is clustered but not if data is
“smeared”
• Can have hierarchical clustering and be stored in multi-
dimensional index tree structures
• There are many choices of clustering definitions and
clustering algorithms, further detailed in Chapter 8
36. Sampling
• Allow a mining algorithm to run in complexity that is
potentially sub-linear to the size of the data
• Choose a representative subset of the data
– Simple random sampling may have very poor performance
in the presence of skew
• Develop adaptive sampling methods
– Stratified sampling:
• Approximate the percentage of each class (or
subpopulation of interest) in the overall database
• Used in conjunction with skewed data
38. Concept hierarchy
• Arrangement of concepts such as time , location.
– reduce the data by collecting and replacing low
level concepts (such as numeric values for the
attribute age) by higher level concepts (such as
young, middle-aged, or senior).