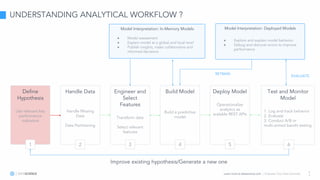
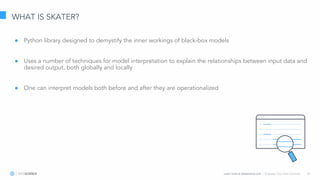
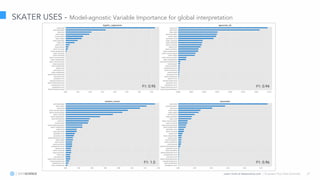
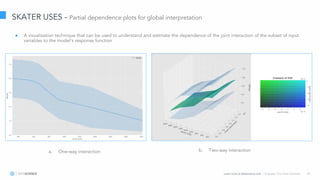
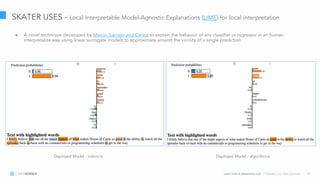
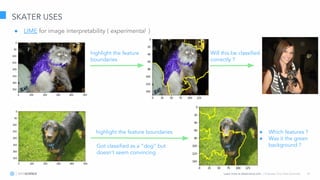
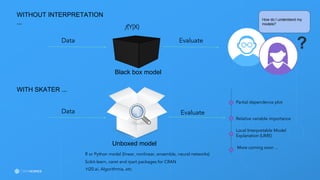
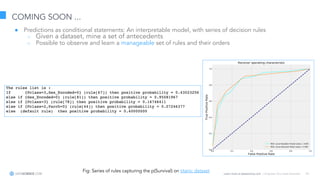
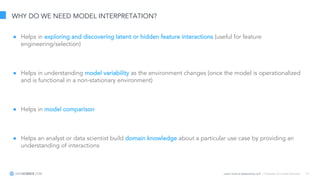
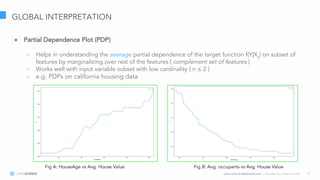
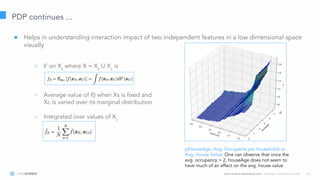
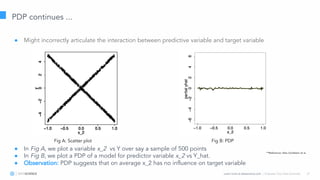
The document discusses model interpretation and the Skater library. It begins with defining model interpretation and explaining why it is needed, particularly for understanding model behavior and ensuring fairness. It then introduces Skater, an open-source Python library that provides model-agnostic interpretation tools. Skater uses techniques like partial dependence plots and LIME explanations to interpret models globally and locally. The document demonstrates Skater's functionality and discusses its ability to interpret a variety of model types.
Keynote by Agus Sudjianto, Wells Fargo - Interpretable Machine Learning - H2O...Sri Ambati
This session was recorded in San Francisco on February 5th, 2019 and can be viewed here: https://youtu.be/yFTTT3xewOw
Description: Machine Learning has gained a very rapid adoption in the financial industry. Machine learning models are being applied in areas that have customarily been the domain of traditional statistical methods (e.g., credit risk and financial crimes) as well as other areas that normally do not employ models (e.g., compliance or conduct risks). Managing machine learning model risk is of the utmost importance in heavily regulated industries such as finance; in particular, to manage potential risks due to bias/fairness, conceptual soundness, implementation, and model change control. In this talk, I will discuss the wide ranging applications of machine learning in banking and how we can manage their risks with a special focus on model interpretability.
Bio: Agus Sudjianto is an executive vice president and head of Corporate Model Risk for Wells Fargo, where he is responsible for enterprise model risk management.
Get hands-on with Explainable AI at Machine Learning Interpretability(MLI) Gym!Sri Ambati
This meetup took place in Mountain View on January 24th, 2019.
Description:
With the effort and contributions from researchers and practitioners from academia and industry, Machine Learning Interpretation has become a young sub-field of ML. However, the norms around its definition and understanding is still in its infancy and there are numerous different approaches emerging rapidly. However, there seems to be a lack of a consistent explanation framework to evaluate and consistently benchmark different algorithms - evaluating against interpretation, completeness and consistency of the algorithms.
The idea with the gym is to provide a controlled interactive environment for all forms of Machine Learning algorithms, - initially focusing on supervised predictive modeling problems, to allow analysts and data-scientists to explore, debug and generate insightful understanding of the models by
1.Model Validation: Ways to explore and validate black box ML systems enabling model comparison both globally and locally - identifying biases in the training data through interpretation.
2.What-if Analysis: An interactive environment where communication can happen i.e. enable learning through interactions. User having the ability to conduct "What-If" analysis - effect of single or multiple features and their interactions
3.Model Debugging: Ways to analyze the misbehavior of the model by exploring counterfactual examples(adversarial examples and training)
4. Interpretable Models: Ability to build natively interpretable models - with the goal to simplify complex models to enable better understanding.
The central concept with MLI gym is to have an interactive environment where one could explore and simulate variations in the world(a world post a model is operationalized) beyond the defined model metrics point estimates - e.g. ROC-AUC, confusion matrix, RMSE, R2 score and others.
Speaker's Bio:
Pramit is a Lead Data Scientist/ at H2O.ai. His area of interests is building Statistical/Machine Learning models(Bayesian and Frequentist Modeling techniques) to help the business realize their data-driven goals.
Currently, he is exploring "Model Interpretation" as means to efficiently understand the true nature of predictive models to enable model robustness and security. He believes effective Model Inference coupled with Adversarial training could lead to building trustworthy models with known blind spots. He has started an open source project Skater: https://github.com/datascienceinc/Skater to solve the need for Model Inference(The project is still in its early stages of development but check it out, always eager for feedback)
Presentation at special event "To Explain or To Predict?" at Tel Aviv University, July 9, 2012. Event co-organized by the Israel Statistical Association and Tel Aviv University's Department of Statistics and OR.
Big Data - To Explain or To Predict? Talk at U Toronto's Rotman School of Ma...Galit Shmueli
Slide from Prof. Galit Shmueli's talk at University of Toronto's Rotman School of Management, March 4, 2016. This talk is part of Rotman's Big Data Expert Speaker Series.
https://www.rotman.utoronto.ca/ProfessionalDevelopment/Events/UpcomingEvents/20160304GalitShmueli.aspx
Valencian Summer School 2015
Day 2
Lecture 11
The Future of Machine Learning
José David Martín-Guerrero (IDAL, UV)
https://bigml.com/events/valencian-summer-school-in-machine-learning-2015
Delta Analytics is a 501(c)3 non-profit in the Bay Area. We believe that data is powerful, and that anybody should be able to harness it for change. Our teaching fellows partner with schools and organizations worldwide to work with students excited about the power of data to do good.
Welcome to the course! These modules will teach you the fundamental building blocks and the theory necessary to be a responsible machine learning practitioner in your own community. Each module focuses on accessible examples designed to teach you about good practices and the powerful (yet surprisingly simple) algorithms we use to model data.
To learn more about our mission or provide feedback, take a look at www.deltanalytics.org.
Module 4: Model Selection and EvaluationSara Hooker
Delta Analytics is a 501(c)3 non-profit in the Bay Area. We believe that data is powerful, and that anybody should be able to harness it for change. Our teaching fellows partner with schools and organizations worldwide to work with students excited about the power of data to do good.
Welcome to the course! These modules will teach you the fundamental building blocks and the theory necessary to be a responsible machine learning practitioner in your own community. Each module focuses on accessible examples designed to teach you about good practices and the powerful (yet surprisingly simple) algorithms we use to model data.
To learn more about our mission or provide feedback, take a look at www.deltanalytics.org.
Delta Analytics is a 501(c)3 non-profit in the Bay Area. We believe that data is powerful, and that anybody should be able to harness it for change. Our teaching fellows partner with schools and organizations worldwide to work with students excited about the power of data to do good.
Welcome to the course! These modules will teach you the fundamental building blocks and the theory necessary to be a responsible machine learning practitioner in your own community. Each module focuses on accessible examples designed to teach you about good practices and the powerful (yet surprisingly simple) algorithms we use to model data.
To learn more about our mission or provide feedback, take a look at www.deltanalytics.org. If you would like to use this course content for teaching, please reach out to inquiry@deltanalytics.org
Delta Analytics is a 501(c)3 non-profit in the Bay Area. We believe that data is powerful, and that anybody should be able to harness it for change. Our teaching fellows partner with schools and organizations worldwide to work with students excited about the power of data to do good.
Welcome to the course! These modules will teach you the fundamental building blocks and the theory necessary to be a responsible machine learning practitioner in your own community. Each module focuses on accessible examples designed to teach you about good practices and the powerful (yet surprisingly simple) algorithms we use to model data.
To learn more about our mission or provide feedback, take a look at www.deltanalytics.org. If you would like to use this material to further our mission of improving access to machine learning. Education please reach out to inquiry@deltanalytics.org.
Delta Analytics is a 501(c)3 non-profit in the Bay Area. We believe that data is powerful, and that anybody should be able to harness it for change. Our teaching fellows partner with schools and organizations worldwide to work with students excited about the power of data to do good.
Welcome to the course! These modules will teach you the fundamental building blocks and the theory necessary to be a responsible machine learning practitioner in your own community. Each module focuses on accessible examples designed to teach you about good practices and the powerful (yet surprisingly simple) algorithms we use to model data.
To learn more about our mission or provide feedback, take a look at www.deltanalytics.org.
An Introduction to XAI! Towards Trusting Your ML Models!Mansour Saffar
Machine learning (ML) is currently disrupting almost every industry and is being used as the core component in many systems. The decisions made by these systems may have a great impact on society and specific individuals and thus the decision-making process has to be clear and explainable so humans can trust it. Explainable AI (XAI) is a rather new field in ML in which researchers try to develop models that are able to explain the decision-making process behind ML models. In this talk, we'll learn about the fundamentals of XAI and discuss why we need to start to integrate XAI with our ML models!
Presented in Edmonton DataScience Meetup on October 2nd, 2019. Learn more: https://youtu.be/gEkPXOsDt_w
Repurposing Classification & Regression Trees for Causal Research with High-D...Galit Shmueli
Keynote at WOMBAT 2019 (Monash University) https://www.monash.edu/business/wombat2019
Abstract:
Studying causal effects and structures is central to research in management, social science, economics, and other areas, yet typical analysis methods are designed for low-dimensional data. Classification & Regression Trees ("trees") and their variants are popular predictive tools used in many machine learning applications and predictive research, as they are powerful in high-dimensional predictive scenarios. Yet trees are not commonly used in causal-explanatory research. In this talk I will describe adaptations of trees that we developed for tackling two causal-explanatory issues: self selection and confounder detection. For self selection, we developed a novel tree-based approach adjusting for observable self-selection bias in intervention studies, thereby creating a useful tool for analysis of observational impact studies as well as post-analysis of experimental data which scales for big data. For tackling confounders, we repurose trees for automated detection of potential Simpson's paradoxes in data with few or many potential confounding variables, and even with very large samples. I'll also show insights revealed when applying these trees to applications in eGov, labor economics, and healthcare.
Dowhy: An end-to-end library for causal inferenceAmit Sharma
In addition to efficient statistical estimators of a treatment's effect, successful application of causal inference requires specifying assumptions about the mechanisms underlying observed data and testing whether they are valid, and to what extent. However, most libraries for causal inference focus only on the task of providing powerful statistical estimators. We describe DoWhy, an open-source Python library that is built with causal assumptions as its first-class citizens, based on the formal framework of causal graphs to specify and test causal assumptions. DoWhy presents an API for the four steps common to any causal analysis---1) modeling the data using a causal graph and structural assumptions, 2) identifying whether the desired effect is estimable under the causal model, 3) estimating the effect using statistical estimators, and finally 4) refuting the obtained estimate through robustness checks and sensitivity analyses. In particular, DoWhy implements a number of robustness checks including placebo tests, bootstrap tests, and tests for unoberved confounding. DoWhy is an extensible library that supports interoperability with other implementations, such as EconML and CausalML for the the estimation step.
Machine Learning and Real-World ApplicationsMachinePulse
This presentation was created by Ajay, Machine Learning Scientist at MachinePulse, to present at a Meetup on Jan. 30, 2015. These slides provide an overview of widely used machine learning algorithms. The slides conclude with examples of real world applications.
Ajay Ramaseshan, is a Machine Learning Scientist at MachinePulse. He holds a Bachelors degree in Computer Science from NITK, Suratkhal and a Master in Machine Learning and Data Mining from Aalto University School of Science, Finland. He has extensive experience in the machine learning domain and has dealt with various real world problems.
Causal Inference in Data Science and Machine LearningBill Liu
Event: https://learn.xnextcon.com/event/eventdetails/W20042010
Video: https://www.youtube.com/channel/UCj09XsAWj-RF9kY4UvBJh_A
Modern machine learning techniques are able to learn highly complex associations from data, which has led to amazing progress in computer vision, NLP, and other predictive tasks. However, there are limitations to inference from purely probabilistic or associational information. Without understanding causal relationships, ML models are unable to provide actionable recommendations, perform poorly in new, but related environments, and suffer from a lack of interpretability.
In this talk, I provide an introduction to the field of causal inference, discuss its importance in addressing some of the current limitations in machine learning, and provide some real-world examples from my experience as a data scientist at Brex.
This was presented at the London Artificial Intelligence & Deep Learning Meetup.
https://www.meetup.com/London-Artificial-Intelligence-Deep-Learning/events/245251725/
Enjoy the recording: https://youtu.be/CY3t11vuuOM.
- - -
Kasia discussed complexities of interpreting black-box algorithms and how these may affect some industries. She presented the most popular methods of interpreting Machine Learning classifiers, for example, feature importance or partial dependence plots and Bayesian networks. Finally, she introduced Local Interpretable Model-Agnostic Explanations (LIME) framework for explaining predictions of black-box learners – including text- and image-based models - using breast cancer data as a specific case scenario.
Kasia Kulma is a Data Scientist at Aviva with a soft spot for R. She obtained a PhD (Uppsala University, Sweden) in evolutionary biology in 2013 and has been working on all things data ever since. For example, she has built recommender systems, customer segmentations, predictive models and now she is leading an NLP project at the UK’s leading insurer. In spare time she tries to relax by hiking & camping, but if that doesn’t work ;) she co-organizes R-Ladies meetups and writes a data science blog R-tastic (https://kkulma.github.io/).
https://www.linkedin.com/in/kasia-kulma-phd-7695b923/
Provides a brief overview of what machine learning is, how it works (theory), how to prepare data for a machine learning problem, an example case study, and additional resources.
Part of the ongoing effort with Skater for enabling better Model Interpretation for Deep Neural Network models presented at the AI Conference.
https://conferences.oreilly.com/artificial-intelligence/ai-ny/public/schedule/detail/65118
Delta Analytics is a 501(c)3 non-profit in the Bay Area. We believe that data is powerful, and that anybody should be able to harness it for change. Our teaching fellows partner with schools and organizations worldwide to work with students excited about the power of data to do good.
Welcome to the course! These modules will teach you the fundamental building blocks and the theory necessary to be a responsible machine learning practitioner in your own community. Each module focuses on accessible examples designed to teach you about good practices and the powerful (yet surprisingly simple) algorithms we use to model data.
To learn more about our mission or provide feedback, take a look at www.deltanalytics.org.
Module 4: Model Selection and EvaluationSara Hooker
Delta Analytics is a 501(c)3 non-profit in the Bay Area. We believe that data is powerful, and that anybody should be able to harness it for change. Our teaching fellows partner with schools and organizations worldwide to work with students excited about the power of data to do good.
Welcome to the course! These modules will teach you the fundamental building blocks and the theory necessary to be a responsible machine learning practitioner in your own community. Each module focuses on accessible examples designed to teach you about good practices and the powerful (yet surprisingly simple) algorithms we use to model data.
To learn more about our mission or provide feedback, take a look at www.deltanalytics.org.
Delta Analytics is a 501(c)3 non-profit in the Bay Area. We believe that data is powerful, and that anybody should be able to harness it for change. Our teaching fellows partner with schools and organizations worldwide to work with students excited about the power of data to do good.
Welcome to the course! These modules will teach you the fundamental building blocks and the theory necessary to be a responsible machine learning practitioner in your own community. Each module focuses on accessible examples designed to teach you about good practices and the powerful (yet surprisingly simple) algorithms we use to model data.
To learn more about our mission or provide feedback, take a look at www.deltanalytics.org.
Delta Analytics is a 501(c)3 non-profit in the Bay Area. We believe that data is powerful, and that anybody should be able to harness it for change. Our teaching fellows partner with schools and organizations worldwide to work with students excited about the power of data to do good.
Welcome to the course! These modules will teach you the fundamental building blocks and the theory necessary to be a responsible machine learning practitioner in your own community. Each module focuses on accessible examples designed to teach you about good practices and the powerful (yet surprisingly simple) algorithms we use to model data.
To learn more about our mission or provide feedback, take a look at www.deltanalytics.org.
Delta Analytics is a 501(c)3 non-profit in the Bay Area. We believe that data is powerful, and that anybody should be able to harness it for change. Our teaching fellows partner with schools and organizations worldwide to work with students excited about the power of data to do good.
Welcome to the course! These modules will teach you the fundamental building blocks and the theory necessary to be a responsible machine learning practitioner in your own community. Each module focuses on accessible examples designed to teach you about good practices and the powerful (yet surprisingly simple) algorithms we use to model data.
To learn more about our mission or provide feedback, take a look at www.deltanalytics.org. If you would like to use this course content for teaching, please reach out to inquiry@deltanalytics.org
Delta Analytics is a 501(c)3 non-profit in the Bay Area. We believe that data is powerful, and that anybody should be able to harness it for change. Our teaching fellows partner with schools and organizations worldwide to work with students excited about the power of data to do good.
Welcome to the course! These modules will teach you the fundamental building blocks and the theory necessary to be a responsible machine learning practitioner in your own community. Each module focuses on accessible examples designed to teach you about good practices and the powerful (yet surprisingly simple) algorithms we use to model data.
To learn more about our mission or provide feedback, take a look at www.deltanalytics.org. If you would like to use this material to further our mission of improving access to machine learning. Education please reach out to inquiry@deltanalytics.org.
Delta Analytics is a 501(c)3 non-profit in the Bay Area. We believe that data is powerful, and that anybody should be able to harness it for change. Our teaching fellows partner with schools and organizations worldwide to work with students excited about the power of data to do good.
Welcome to the course! These modules will teach you the fundamental building blocks and the theory necessary to be a responsible machine learning practitioner in your own community. Each module focuses on accessible examples designed to teach you about good practices and the powerful (yet surprisingly simple) algorithms we use to model data.
To learn more about our mission or provide feedback, take a look at www.deltanalytics.org.
An Introduction to XAI! Towards Trusting Your ML Models!Mansour Saffar
Machine learning (ML) is currently disrupting almost every industry and is being used as the core component in many systems. The decisions made by these systems may have a great impact on society and specific individuals and thus the decision-making process has to be clear and explainable so humans can trust it. Explainable AI (XAI) is a rather new field in ML in which researchers try to develop models that are able to explain the decision-making process behind ML models. In this talk, we'll learn about the fundamentals of XAI and discuss why we need to start to integrate XAI with our ML models!
Presented in Edmonton DataScience Meetup on October 2nd, 2019. Learn more: https://youtu.be/gEkPXOsDt_w
Repurposing Classification & Regression Trees for Causal Research with High-D...Galit Shmueli
Keynote at WOMBAT 2019 (Monash University) https://www.monash.edu/business/wombat2019
Abstract:
Studying causal effects and structures is central to research in management, social science, economics, and other areas, yet typical analysis methods are designed for low-dimensional data. Classification & Regression Trees ("trees") and their variants are popular predictive tools used in many machine learning applications and predictive research, as they are powerful in high-dimensional predictive scenarios. Yet trees are not commonly used in causal-explanatory research. In this talk I will describe adaptations of trees that we developed for tackling two causal-explanatory issues: self selection and confounder detection. For self selection, we developed a novel tree-based approach adjusting for observable self-selection bias in intervention studies, thereby creating a useful tool for analysis of observational impact studies as well as post-analysis of experimental data which scales for big data. For tackling confounders, we repurose trees for automated detection of potential Simpson's paradoxes in data with few or many potential confounding variables, and even with very large samples. I'll also show insights revealed when applying these trees to applications in eGov, labor economics, and healthcare.
Dowhy: An end-to-end library for causal inferenceAmit Sharma
In addition to efficient statistical estimators of a treatment's effect, successful application of causal inference requires specifying assumptions about the mechanisms underlying observed data and testing whether they are valid, and to what extent. However, most libraries for causal inference focus only on the task of providing powerful statistical estimators. We describe DoWhy, an open-source Python library that is built with causal assumptions as its first-class citizens, based on the formal framework of causal graphs to specify and test causal assumptions. DoWhy presents an API for the four steps common to any causal analysis---1) modeling the data using a causal graph and structural assumptions, 2) identifying whether the desired effect is estimable under the causal model, 3) estimating the effect using statistical estimators, and finally 4) refuting the obtained estimate through robustness checks and sensitivity analyses. In particular, DoWhy implements a number of robustness checks including placebo tests, bootstrap tests, and tests for unoberved confounding. DoWhy is an extensible library that supports interoperability with other implementations, such as EconML and CausalML for the the estimation step.
Machine Learning and Real-World ApplicationsMachinePulse
This presentation was created by Ajay, Machine Learning Scientist at MachinePulse, to present at a Meetup on Jan. 30, 2015. These slides provide an overview of widely used machine learning algorithms. The slides conclude with examples of real world applications.
Ajay Ramaseshan, is a Machine Learning Scientist at MachinePulse. He holds a Bachelors degree in Computer Science from NITK, Suratkhal and a Master in Machine Learning and Data Mining from Aalto University School of Science, Finland. He has extensive experience in the machine learning domain and has dealt with various real world problems.
Causal Inference in Data Science and Machine LearningBill Liu
Event: https://learn.xnextcon.com/event/eventdetails/W20042010
Video: https://www.youtube.com/channel/UCj09XsAWj-RF9kY4UvBJh_A
Modern machine learning techniques are able to learn highly complex associations from data, which has led to amazing progress in computer vision, NLP, and other predictive tasks. However, there are limitations to inference from purely probabilistic or associational information. Without understanding causal relationships, ML models are unable to provide actionable recommendations, perform poorly in new, but related environments, and suffer from a lack of interpretability.
In this talk, I provide an introduction to the field of causal inference, discuss its importance in addressing some of the current limitations in machine learning, and provide some real-world examples from my experience as a data scientist at Brex.
This was presented at the London Artificial Intelligence & Deep Learning Meetup.
https://www.meetup.com/London-Artificial-Intelligence-Deep-Learning/events/245251725/
Enjoy the recording: https://youtu.be/CY3t11vuuOM.
- - -
Kasia discussed complexities of interpreting black-box algorithms and how these may affect some industries. She presented the most popular methods of interpreting Machine Learning classifiers, for example, feature importance or partial dependence plots and Bayesian networks. Finally, she introduced Local Interpretable Model-Agnostic Explanations (LIME) framework for explaining predictions of black-box learners – including text- and image-based models - using breast cancer data as a specific case scenario.
Kasia Kulma is a Data Scientist at Aviva with a soft spot for R. She obtained a PhD (Uppsala University, Sweden) in evolutionary biology in 2013 and has been working on all things data ever since. For example, she has built recommender systems, customer segmentations, predictive models and now she is leading an NLP project at the UK’s leading insurer. In spare time she tries to relax by hiking & camping, but if that doesn’t work ;) she co-organizes R-Ladies meetups and writes a data science blog R-tastic (https://kkulma.github.io/).
https://www.linkedin.com/in/kasia-kulma-phd-7695b923/
Provides a brief overview of what machine learning is, how it works (theory), how to prepare data for a machine learning problem, an example case study, and additional resources.
Part of the ongoing effort with Skater for enabling better Model Interpretation for Deep Neural Network models presented at the AI Conference.
https://conferences.oreilly.com/artificial-intelligence/ai-ny/public/schedule/detail/65118
Interpretierbarkeit von ML-Modellen hat die Zielsetzung, die Ursachen einer Prognose offenzulegen und eine daraus abgeleitete Entscheidung für einen Menschen nachvollziehbar zu erklären. Durch die Nachvollziehbarkeit von Prognosen lässt sich beispielsweise sicherstellen, dass deren Herleitung konsistent zum Domänenwissen eines Experten ist. Auch ein unfairer Bias lässt sich durch die Erklärung aussagekräftiger Beispiele identifizieren.
Prognosemodelle lassen sich grob in intrinsisch interpretierbare Modelle und nicht-interpretierbare (auch Blackbox-) Modelle unterscheiden. Intrinsisch interpretierbare Modelle sind dafür bekannt, dass sie für einen Menschen leicht nachvollziehbar sind. Ein typisches Beispiel für ein solches Modell ist der Entscheidungsbaum, dessen regelbasierter Entscheidungsprozess intuitiv und leicht zugänglich ist. Im Gegensatz dazu gelten Neuronale Netze als Blackbox-Modelle, deren Prognosen durch die komplexe Netzstruktur schwer nachvollziehbar sind.
In diesem Talk erläuterte Marcel Spitzer das Konzept von Interpretierbarkeit im Kontext von Machine Learning und stellte gängige Verfahren zur Interpretation von Modellen vor. Besonderen Fokus legte er dabei auf modellunabhängige Verfahren, die sich auch auf prognosestarke Blackbox-Modelle anwenden lassen.
Event: M3 Minds Mastering Machines
Speaker: Marcel Spitzer
Blog-Artikel: https://www.inovex.de/blog/machine-learning-interpretability/
Mehr Tech-Vorträge: inovex.de/vortraege
Mehr Tech-Artikel: inovex.de/blog
Practical Tips for Interpreting Machine Learning Models - Patrick Hall, H2O.aiSri Ambati
This talk was given at H2O World 2018 NYC and can be viewed here: https://youtu.be/vUqC8UPw9SU
Description:
The good news is building fair, accountable, and transparent machine learning systems is possible. The bad news is it’s harder than many blogs and software package docs would have you believe. The truth is nearly all interpretable machine learning techniques generate approximate explanations, that the fields of eXplainable AI (XAI) and Fairness, Accountability, and Transparency in Machine Learning (FAT/ML) are very new, and that few best practices have been widely agreed upon. This combination can lead to some ugly outcomes! This talk aims to make your interpretable machine learning project a success by describing fundamental technical challenges you will face in building an interpretable machine learning system, defining the real-world value proposition of approximate explanations for exact models, and then outlining the following viable techniques for debugging, explaining, and testing machine learning models: *Model visualizations including decision tree surrogate models, individual conditional expectation (ICE) plots, partial dependence plots, and residual analysis. *Reason code generation techniques like LIME, Shapley explanations, and Treeinterpreter. *Sensitivity Analysis. Plenty of guidance on when, and when not, to use these techniques will also be shared, and the talk will conclude by providing guidelines for testing generated explanations themselves for accuracy and stability. Open source examples (with lots of comments and helpful hints) for building interpretable machine learning systems are available to accompany the talk at: https://github.com/jphall663/interpretable_machine_learning_with_python Bio: Patrick Hall is senior director for data science products at H2O.ai where he focuses mainly on model interpretability. Patrick is also currently an adjunct professor in the Department of Decision Sciences at George Washington University, where he teaches graduate classes in data mining and machine learning. Prior to joining H2O.ai, Patrick held global customer facing roles and research and development roles at SAS Institute.
Speaker's Bio:
Patrick Hall is a senior director for data science products at H2o.ai where he focuses mainly on model interpretability. Patrick is also currently an adjunct professor in the Department of Decision Sciences at George Washington University, where he teaches graduate classes in data mining and machine learning. Prior to joining H2o.ai, Patrick held global customer facing roles and R & D research roles at SAS Institute. He holds multiple patents in automated market segmentation using clustering and deep neural networks. Patrick was the 11th person worldwide to become a Cloudera certified data scientist. He studied computational chemistry at the University of Illinois before graduating from the Institute for Advanced Analytics at North Carolina State University.
Explainable AI - making ML and DL models more interpretableAditya Bhattacharya
Abstract –
Although industries have started to adopt AI and Machine Learning in almost every sector to solve complex business problems, but are these models always trustworthy? Machine Learning models are not any oracle but rather are scientific methods and mathematical models which best describes the data. But science is all about explaining complex natural phenomena in the simplest way possible! So, can we make ML and DL models more interpretable, so that any business user can understand these models and trust the results of these models?
In order to find out the answer, please join me in this session, in which I will take about concepts of Explainable AI and discuss its necessity and principles which help us demystify black-box AI models. I will be discussing about popular approaches like Feature Importance, Key Influencers, Decomposition trees used in classical Machine Learning interpretable. We will discuss about various techniques used for Deep Learning model interpretations like Saliency Maps, Grad-CAMs, Visual Attention Maps and finally go through more details about frameworks like LIME, SHAP, ELI5, SKATER, TCAV which helps us to make Machine Learning and Deep Learning models more interpretable, trustworthy and useful!
Machine learning workshop, session 3.
- Data sets
- Machine Learning Algorithms
- Algorithms by Learning Style
- Algorithms by Similarity
- People to follow
Deep dive into the mathematics and algorithms of neural nets. Covers the sigmoid activation function, cross-entropy loss function, gradient descent and the derivatives used in back propagation.
The Incredible Disappearing Data ScientistRebecca Bilbro
The last decade saw advances in compute power combine with an avalanche of open source software development, resulting in a revolution in machine learning and scalable analytics. “Data science” and “data product” are now household terms. This led to a new job description, the Data Scientist, which quickly became one of the most significant, exciting, and misunderstood jobs of the 21st century. One part statistician, one part computer scientist, and one part domain expert, data scientists seem poised to become the most pivotal value creators of the information age. And yet, danger (supposedly) lies ahead: human decisions are increasingly outsourced to algorithms of questionable ethical design; we’re putting everything on the blockchain; and perhaps most disturbingly, data science salaries are dropping precipitously as new graduates and Machine Learning as a Service (MLaaS) offerings flood the market. As we move into a future where predictive analytics is no longer a differentiator but instead a core business function, will data scientists proliferate or be automated out of a job?
In this talk, one humble data scientist attempts to cut through the hype to present an alternate vision of what data science is and can become. If not the “Sexiest Job of the 21st Century" as the Harvard Business Review once quipped, what is it like to be a workaday data scientist? What problems are we solving? How do we integrate with mature engineering teams? How do we engage with clients and product owners? How do we deploy non-deterministic models in production? In particular, we’ll examine critical integration points — technological and otherwise — we are currently tackling, which will ultimately determine our success, and our viability, over the next 10 years.
Data Science & AI Road Map by Python & Computer science tutor in MalaysiaAhmed Elmalla
The slides were used in a trial session for a student aiming to learn python to do Data science projects .
The session video can be watched from the link below
https://youtu.be/CwCe1pKOVI8
I have over 20 years of experience in both teaching & in completing computer science projects with certificates from Stanford, Alberta, Pennsylvania, California Irvine universities.
I teach the following subjects:
1) IGCSE A-level 9618 / AS-Level
2) AP Computer Science exam A
3) Python (basics, automating staff, Data Analysis, AI & Flask)
4) Java (using Duke University syllabus)
5) Descriptive statistics using SQL
6) PHP, SQL, MYSQL & Codeigniter framework (using University of Michigan syllabus)
7) Android Apps development using Java
8) C / C++ (using University of Colorado syllabus)
Check Trial Classes:
1) A-Level Trial Class : https://youtu.be/v3k7A0nNb9Q
2) AS level trial Class : https://youtu.be/wj14KpfbaPo
3) 0478 IGCSE class : https://youtu.be/sG7PrqagAes
4) AI & Data Science class: https://youtu.be/CwCe1pKOVI8
https://elmalla.info/blog/68-tutor-profile-slide-share
You can get your trial Class now by booking : https://calendly.com/ahmed-elmalla/30min
And you can contact me on
https://wa.me/0060167074241
by Python & Computer science tutor in Malaysia
Usage of AI and machine learning models is likely to become more commonplace as larger swaths of the economy embrace automation and data-driven decision-making. While these predictive systems can be quite accurate, they have been treated as inscrutable black boxes in the past, that produce only numeric predictions with no accompanying explanations. Unfortunately, recent studies and recent events have drawn attention to mathematical and sociological flaws in prominent weak AI and ML systems, but practitioners usually don’t have the right tools to pry open machine learning black-boxes and debug them.
This presentation introduces several new approaches to that increase transparency, accountability, and trustworthiness in machine learning models. If you are a data scientist or analyst and you want to explain a machine learning model to your customers or managers (or if you have concerns about documentation, validation, or regulatory requirements), then this presentation is for you!
GDG Cloud Southlake #17: Meg Dickey-Kurdziolek: Explainable AI is for EveryoneJames Anderson
If Artificial Intelligence (AI) is a black-box, how can a human comprehend and trust the results of Machine Learning (ML) alogrithms? Explainable AI (XAI) tries to shed light into that AI black-box so humans can trust what is going on. Our speaker Meg Dickey-Kurdziolek is currently a UX Researcher for Google Cloud AI and Industry Solutions, where she focuses her research on Explainable AI and Model Understanding. Recording of the presentation: https://youtu.be/6N2DNN_HDWU
Similar to Learning to learn Model Behavior: How to use "human-in-the-loop" to explain decisions. (20)
Neuro-symbolic is not enough, we need neuro-*semantic*Frank van Harmelen
Neuro-symbolic (NeSy) AI is on the rise. However, simply machine learning on just any symbolic structure is not sufficient to really harvest the gains of NeSy. These will only be gained when the symbolic structures have an actual semantics. I give an operational definition of semantics as “predictable inference”.
All of this illustrated with link prediction over knowledge graphs, but the argument is general.
Epistemic Interaction - tuning interfaces to provide information for AI supportAlan Dix
Paper presented at SYNERGY workshop at AVI 2024, Genoa, Italy. 3rd June 2024
https://alandix.com/academic/papers/synergy2024-epistemic/
As machine learning integrates deeper into human-computer interactions, the concept of epistemic interaction emerges, aiming to refine these interactions to enhance system adaptability. This approach encourages minor, intentional adjustments in user behaviour to enrich the data available for system learning. This paper introduces epistemic interaction within the context of human-system communication, illustrating how deliberate interaction design can improve system understanding and adaptation. Through concrete examples, we demonstrate the potential of epistemic interaction to significantly advance human-computer interaction by leveraging intuitive human communication strategies to inform system design and functionality, offering a novel pathway for enriching user-system engagements.
Transcript: Selling digital books in 2024: Insights from industry leaders - T...BookNet Canada
The publishing industry has been selling digital audiobooks and ebooks for over a decade and has found its groove. What’s changed? What has stayed the same? Where do we go from here? Join a group of leading sales peers from across the industry for a conversation about the lessons learned since the popularization of digital books, best practices, digital book supply chain management, and more.
Link to video recording: https://bnctechforum.ca/sessions/selling-digital-books-in-2024-insights-from-industry-leaders/
Presented by BookNet Canada on May 28, 2024, with support from the Department of Canadian Heritage.
Encryption in Microsoft 365 - ExpertsLive Netherlands 2024Albert Hoitingh
In this session I delve into the encryption technology used in Microsoft 365 and Microsoft Purview. Including the concepts of Customer Key and Double Key Encryption.
Slack (or Teams) Automation for Bonterra Impact Management (fka Social Soluti...Jeffrey Haguewood
Sidekick Solutions uses Bonterra Impact Management (fka Social Solutions Apricot) and automation solutions to integrate data for business workflows.
We believe integration and automation are essential to user experience and the promise of efficient work through technology. Automation is the critical ingredient to realizing that full vision. We develop integration products and services for Bonterra Case Management software to support the deployment of automations for a variety of use cases.
This video focuses on the notifications, alerts, and approval requests using Slack for Bonterra Impact Management. The solutions covered in this webinar can also be deployed for Microsoft Teams.
Interested in deploying notification automations for Bonterra Impact Management? Contact us at sales@sidekicksolutionsllc.com to discuss next steps.
UiPath Test Automation using UiPath Test Suite series, part 3DianaGray10
Welcome to UiPath Test Automation using UiPath Test Suite series part 3. In this session, we will cover desktop automation along with UI automation.
Topics covered:
UI automation Introduction,
UI automation Sample
Desktop automation flow
Pradeep Chinnala, Senior Consultant Automation Developer @WonderBotz and UiPath MVP
Deepak Rai, Automation Practice Lead, Boundaryless Group and UiPath MVP
GraphRAG is All You need? LLM & Knowledge GraphGuy Korland
Guy Korland, CEO and Co-founder of FalkorDB, will review two articles on the integration of language models with knowledge graphs.
1. Unifying Large Language Models and Knowledge Graphs: A Roadmap.
https://arxiv.org/abs/2306.08302
2. Microsoft Research's GraphRAG paper and a review paper on various uses of knowledge graphs:
https://www.microsoft.com/en-us/research/blog/graphrag-unlocking-llm-discovery-on-narrative-private-data/
Generating a custom Ruby SDK for your web service or Rails API using Smithyg2nightmarescribd
Have you ever wanted a Ruby client API to communicate with your web service? Smithy is a protocol-agnostic language for defining services and SDKs. Smithy Ruby is an implementation of Smithy that generates a Ruby SDK using a Smithy model. In this talk, we will explore Smithy and Smithy Ruby to learn how to generate custom feature-rich SDKs that can communicate with any web service, such as a Rails JSON API.
Kubernetes & AI - Beauty and the Beast !?! @KCD Istanbul 2024Tobias Schneck
As AI technology is pushing into IT I was wondering myself, as an “infrastructure container kubernetes guy”, how get this fancy AI technology get managed from an infrastructure operational view? Is it possible to apply our lovely cloud native principals as well? What benefit’s both technologies could bring to each other?
Let me take this questions and provide you a short journey through existing deployment models and use cases for AI software. On practical examples, we discuss what cloud/on-premise strategy we may need for applying it to our own infrastructure to get it to work from an enterprise perspective. I want to give an overview about infrastructure requirements and technologies, what could be beneficial or limiting your AI use cases in an enterprise environment. An interactive Demo will give you some insides, what approaches I got already working for real.
Elevating Tactical DDD Patterns Through Object CalisthenicsDorra BARTAGUIZ
After immersing yourself in the blue book and its red counterpart, attending DDD-focused conferences, and applying tactical patterns, you're left with a crucial question: How do I ensure my design is effective? Tactical patterns within Domain-Driven Design (DDD) serve as guiding principles for creating clear and manageable domain models. However, achieving success with these patterns requires additional guidance. Interestingly, we've observed that a set of constraints initially designed for training purposes remarkably aligns with effective pattern implementation, offering a more ‘mechanical’ approach. Let's explore together how Object Calisthenics can elevate the design of your tactical DDD patterns, offering concrete help for those venturing into DDD for the first time!
Connector Corner: Automate dynamic content and events by pushing a buttonDianaGray10
Here is something new! In our next Connector Corner webinar, we will demonstrate how you can use a single workflow to:
Create a campaign using Mailchimp with merge tags/fields
Send an interactive Slack channel message (using buttons)
Have the message received by managers and peers along with a test email for review
But there’s more:
In a second workflow supporting the same use case, you’ll see:
Your campaign sent to target colleagues for approval
If the “Approve” button is clicked, a Jira/Zendesk ticket is created for the marketing design team
But—if the “Reject” button is pushed, colleagues will be alerted via Slack message
Join us to learn more about this new, human-in-the-loop capability, brought to you by Integration Service connectors.
And...
Speakers:
Akshay Agnihotri, Product Manager
Charlie Greenberg, Host
2. Learn more at datascience.com | Empower Your Data Scientists
PREDICTIVE MODELING: FUN OR MISERY?
2
Only an expert can survive
3. Learn more at datascience.com | Empower Your Data Scientists 3
PREDICTIONS OFTEN GO WRONG
4. Learn more at datascience.com | Empower Your Data Scientists 4
WHEN AN ERROR OCCURS
5. Learn more at datascience.com | Empower Your Data Scientists 5
ABOUT ME
I am a Lead data scientist at DataScience.com. I enjoy applying and optimizing classical (Machine
Learning) and Bayesian design strategy to solve real-world problems. Currently, I am exploring on
better ways to evaluate and explain Model learned decision policies. I am also a member of AAAI
and organizer of PyData So Cal meet-up group.
Pramit Choudhary
@MaverickPramit
https://www.linkedin.com/in/pramitc/
https://github.com/pramitchoudhary
6. Learn more at datascience.com | Empower Your Data Scientists 6
AGENDA
• DEFINE MODEL INTERPRETATION
• UNDERSTAND THE NEED FOR MODEL INTERPRETATION
• DISCUSS DICHOTOMY BETWEEN PERFORMANCE AND
INTERPRETATION
• INTRODUCE SKATER
• UNDERSTANDING ANALYTICAL WORKFLOW
• DEMO
• Q&A
7. Learn more at datascience.com | Empower Your Data Scientists
DEFINE INTERPRETATION
7
● Definition is subjective - Data Exploration to build domain knowledge
8. Learn more at datascience.com | Empower Your Data Scientists
DEFINE INTERPRETATION
8
● Definition is subjective - overlaps with Model Evaluation
9. Learn more at datascience.com | Empower Your Data Scientists 9
WHAT IS MODEL INTERPRETATION?
● Model interpretation is an extension of Model Evaluation to help us understand machine learning/statistical
modeling behavior better if possible in a human interpretable way
● With model interpretation, one should be able to answer the following questions:
○ Why did the model behave in a certain way? What are the relevant variables driving a model’s outcome
- e.g. Customer's Lifetime Value, Fraud detection, Image Classification, Spam Detection ?
○ What other information can a model provide to avoid prediction errors ? What was the reason for a
false positive ?
○ How can we trust the predictions of a “black box” model ? Is the predictive model biased ?
● Focus: is in-regards to Supervised learning problems
10. Learn more at datascience.com | Empower Your Data Scientists
ACCURACY VS MODEL COMPLEXITY
10
Error(x) = Bias2
+ Variance + Irreducible Error
**Reference: Scott Fortmann-Roe
11. Learn more at datascience.com | Empower Your Data Scientists
Predictive Optimism
11
overfitting
underfitting
**Reference: Scott Fortmann-Roe
sweet-spot
12. Learn more at datascience.com | Empower Your Data Scientists 12
WHY DO WE NEED MODEL INTERPRETATION?
● Helps in exploring and discovering latent or hidden feature interactions (useful for feature
engineering/selection)
● Helps in understanding model variability as the environment changes (once the model is operationalized
and is functional in a non-stationary environment)
● Helps in model comparison
● Helps an analyst or data scientist build domain knowledge about a particular use case by providing an
understanding of interactions
13. Learn more at datascience.com | Empower Your Data Scientists 13
WHY MODEL INTERPRETATION?
● Brings transparency to decision making to enable trust
○ Fair Credit Reporting Act (FCRA) U.S. Code § 1681
Mandate by U.S. government on Fair and
Accurate Credit reporting. Predictive
models should not be discriminative
(biased) toward any group.
14. Learn more at datascience.com | Empower Your Data Scientists 14
Are all predictive models interpretable?
Does an interpretable model always provides the best model ?
15. Learn more at datascience.com | Empower Your Data Scientists
PERFORMANCE VS. INTERPRETABILITY
Variable B
Variable A
Simple decision boundary
(Linear Monotonic)
Complex decision
boundary(
NonLinear
Non-Monotonic )
Credit card approved
Credit card denied
Non-linear decision
boundary (nonlinear
Monotonic)
16. Learn more at datascience.com | Empower Your Data Scientists
HOW ABOUT A MORE DIFFICULT RELATIONSHIP?
Data Learned decision boundaries
17. Learn more at datascience.com | Empower Your Data Scientists 17
Local Interpretation
Being able to explain the conditional
interaction between dependent(response)
variables and independent(predictor, or
explanatory) variables wrt to a single
prediction
SCOPE OF INTERPRETATION
Global Interpretation
Being able to explain the conditional interaction
between dependent(response) variables and
independent(predictor, or explanatory) variables
based on the complete dataset
Global
Interpretation
Local Interpretation
18. Learn more at datascience.com | Empower Your Data Scientists 18
GLOBAL INTERPRETATION
● Relative Importance of Predictor Variable to evaluate Estimator’s behavior
○ Model-specific Feature importance - e.g.
■ Linear Model ( based on the absolute value of t-statistics )
■ Random Forest ( based permutation importance or Gini importance )
■ Recursive Feature Elimination(RFE) - recursively prune least important features
○ Model Independent Feature Importance - this will be our focus for today’s discussion
■ observing entropy of predictive performance based on random perturbation of feature set
■ observing entropy of model specific scoring metric
● Classification: f1-score, precision/recall
● Regression: mean squared error
● Usefulness
○ Helps in identifying important covariates contributing to target prediction enabling better
interpretability
○ Might help in improving accuracy and computation time by eliminating redundant or
unimportant features
19. Learn more at datascience.com | Empower Your Data Scientists 19
GLOBAL INTERPRETATION
● Partial Dependence Plot (PDP)
○ Helps in understanding the average partial dependence of the target function f(Y|Xs
) on subset of
features by marginalizing over rest of the features ( complement set of features )
○ Works well with input variable subset with low cardinality ( n ≤ 2 )
○ e.g. PDPs on california housing data
Fig A: HouseAge vs Avg. House Value Fig B: Avg. occupants vs Avg. House Value
20. Learn more at datascience.com | Empower Your Data Scientists 20
PDP continues ...
● Helps in understanding interaction impact of two independent features in a low dimensional space
visually
○ on Xs
where X = Xs
U Xc
is
○ Average value of f() when Xs is fixed and
Xc is varied over its marginal distribution
○ Integrated over values of Xc
p(HouseAge, Avg. Occupants per household) vs
Avg. House Value: One can observe that once the
avg. occupancy > 2, houseAge does not seem to
have much of an effect on the avg. house value
21. Learn more at datascience.com | Empower Your Data Scientists 21
PDP continues ...
● Might incorrectly articulate the interaction between predictive variable and target variable
● In Fig A, we plot a variable x_2 vs Y over say a sample of 500 points
● In Fig B, we plot a PDP of a model for predictor variable x_2 vs Y_hat.
● Observation: PDP suggests that on average x_2 has no influence on target variable
Fig A: Scatter plot Fig B: PDP
**Reference: Alex Goldstein et al.
22. Learn more at datascience.com | Empower Your Data Scientists 22
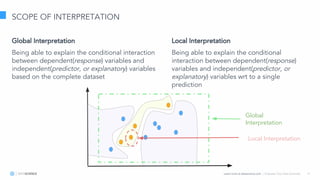
LOCAL INTERPRETATION
● Ability to inspect and evaluate individual prediction in human interpretable format with the help of
surrogate models faithfully
○ ὲ : model explanation function
○ ℒ : measure of fidelity
○ ƒ : is the base model estimator
○ g ⊂ G : a set of interpretable models [ Linear Models, Decision Trees ]
○ ∏x
: proximity measure to define locality around an individual point
○ Ω : to regularize complexity e.g. depth of the tree, learning rate, non-zero weights for linear
models
23. Learn more at datascience.com | Empower Your Data Scientists
UNDERSTANDING ANALYTICAL WORKFLOW ?
2
3
Define
Hypothesis
Use relevant key
performance
indicators
Handle Data
Handle Missing
Data
Data Partitioning
Engineer and
Select
Features
Transform data
Select relevant
features
Build Model
Build a predictive
model
Deploy Model
Operationalize
analytics as
scalable REST APIs
Test and Monitor
Model
1. Log and track behavior
2. Evaluate
3. Conduct A/B or
multi-armed bandit testing
1 2 3 4 5 6
Model Interpretation: In-Memory Models
● Model assessment
● Explain model at a global and local level
● Publish insights, make collaborative and
informed decisions
Model Interpretation: Deployed Models
● Explore and explain model behavior
● Debug and discover errors to improve
performance
RETRAIN
EVALUATE
Improve existing hypothesis/Generate a new one
24. Learn more at datascience.com | Empower Your Data Scientists
HOW DO WE SOLVE THIS PROBLEM?
● Problems:
○ Data scientists are choosing easy-to-interpret models like simple linear models or decision trees over
high-performing neural networks or ensembles, effectively sacrificing accuracy for interpretability
○ Community is struggling to keep pace with new algorithms and frameworks (sklearn, R packages,
H20.ai)
● Possible Solution: What if there was an interpretation library that…
○ Is model agnostic
○ Provides human-interpretable explanation
○ Is framework agnostic (scikit-learn, H20.ai, Vowpal Wabbit)
○ Is language agnostic (R, Python)
○ Allows one to interpret third-party models (Algorithmia, indico)
○ Supports interpretation both during modeling build process and post deployment
25. Learn more at datascience.com | Empower Your Data Scientists
INTRODUCING ...
26. Learn more at datascience.com | Empower Your Data Scientists 26
WHAT IS SKATER?
● Python library designed to demystify the inner workings of black-box models
● Uses a number of techniques for model interpretation to explain the relationships between input data and
desired output, both globally and locally
● One can interpret models both before and after they are operationalized
27. Learn more at datascience.com | Empower Your Data Scientists 27
SKATER USES - Model-agnostic Variable Importance for global interpretation
F1: 1.0 F1: 0.96
F1: 0.94F1: 0.95
28. Learn more at datascience.com | Empower Your Data Scientists 28
SKATER USES - Partial dependence plots for global interpretation
a. One-way interaction b. Two-way interaction
● A visualization technique that can be used to understand and estimate the dependence of the joint interaction of the subset of input
variables to the model's response function
29. Learn more at datascience.com | Empower Your Data Scientists 29
PDPs continued
● PDPs suffers from cancellation effect because of averaging
● Variance effect helps in highlighting this cancellation
One-way interaction with variance
30. Learn more at datascience.com | Empower Your Data Scientists 30
SKATER USES - Local Interpretable Model-Agnostic Explanations (LIME) for local interpretation
● A novel technique developed by Marco, Sameer and Carlos to explain the behavior of any classifier or regressor in an human
interpretable way using linear surrogate models to approximate around the vicinity of a single prediction
Deployed Model - indico.io Deployed Model - algorithmia
31. Learn more at datascience.com | Empower Your Data Scientists 31
LIME continues ...
● Regression
○ Gold Label : No Cancer
○ Predicted(y_hat): No Cancer
32. Learn more at datascience.com | Empower Your Data Scientists 32
SKATER USES
● LIME for image interpretability ( experimental )
highlight the feature
boundaries
highlight the feature boundaries
Will this be classified
correctly ?
Got classified as a “dog” but
doesn’t seem convincing
● Which features ?
● Was it the green
background ?
33. Learn more at datascience.com | Empower Your Data Scientists
Evaluate
(Y|X)
Data
Data
Unboxed model
Evaluate
Partial dependence plot
Relative variable importance
Local Interpretable Model
Explanation (LIME)
R or Python model (linear, nonlinear, ensemble, neural networks)
Scikit-learn, caret and rpart packages for CRAN
H20.ai, Algorithmia, etc.
WITHOUT INTERPRETATION
...
WITH SKATER ...
Black box model
How do I understand my
models?
More coming soon ...
34. Learn more at datascience.com | Empower Your Data Scientists
COMING SOON ...
34
● Predictions as conditional statements: An interpretable model, with series of decision rules
○ Given a dataset, mine a set of antecedents
○ Possible to observe and learn a manageable set of rules and their orders
Fig: Series of rules capturing the p(Survival) on titanic dataset
35. Learn more at datascience.com | Empower Your Data Scientists 35
JUPYTER’S INTERACTIVENESS
● Human in the loop is very useful for Model Evaluation
● Being able to do it in a convenient way, increases efficiency
● Interactiveness,
○ Jupyter Widgets: - UI controls to inspect code and data interactively
○ Enables collaboration and sharing:
■ Widgets can be serialized and embedded in
● html web pages,
● Sphinx style documents
● html-converted notebooks on nbviewer
○ Jupyter dashboards
■ is a dashboard layout extension
■ helpful in organizing notebook outputs - text, images, plots, animations in report like layout
36. Learn more at datascience.com | Empower Your Data Scientists
A QUICK GLIMPSE INTO THE FUTURE
36
Top 5 predictions:
1. seat belt = 0.75
2. limousine = 0.051
3. golf cart = 0.017
4. minivan = 0.015
5. car mirror = 0.015
Visual QnA: Is the person driving the car safely ?
37. Learn more at datascience.com | Empower Your Data Scientists 37
SPECIAL THANKS
● Special thanks to Aaron Kramer( one of the original authors of Skater ), Ben Van Dyke and rest
of the datascience.com teammates for helping out with Skater
● Thank you to IDEAS for providing us the opportunity to share our thoughts with a wider
community
38. Learn more at datascience.com | Empower Your Data Scientists
Q&A
info@datascience.com
pramit@datascience.com
@MaverickPramit
@DataScienceInc
Help wanted(Skater): https://tinyurl.com/yd6tnc7l
39. Learn more at datascience.com | Empower Your Data Scientists
Appendix
40. Learn more at datascience.com | Empower Your Data Scientists
40
References:
● A. Weller, "Challenges for Transparency": https://arxiv.org/abs/1708.01870
● Max Kuhn, Variable Importance Using The caret pkg:
http://ftp.uni-bayreuth.de/math/statlib/R/CRAN/doc/vignettes/caret/caretVarImp.pdf
● Friedman’ 01, Greedy Function Approximation: A gradient boosting machine:
https://statweb.stanford.edu/~jhf/ftp/trebst.pdf
● Recursive Feature Elimination: https://arxiv.org/pdf/1310.5726.pdf
● LIME: https://arxiv.org/pdf/1602.04938v1.pdf
● Nothing Else Matters: https://arxiv.org/pdf/1611.05817v1.pdf
● Peeking Inside the Black Box: https://arxiv.org/abs/1309.6392