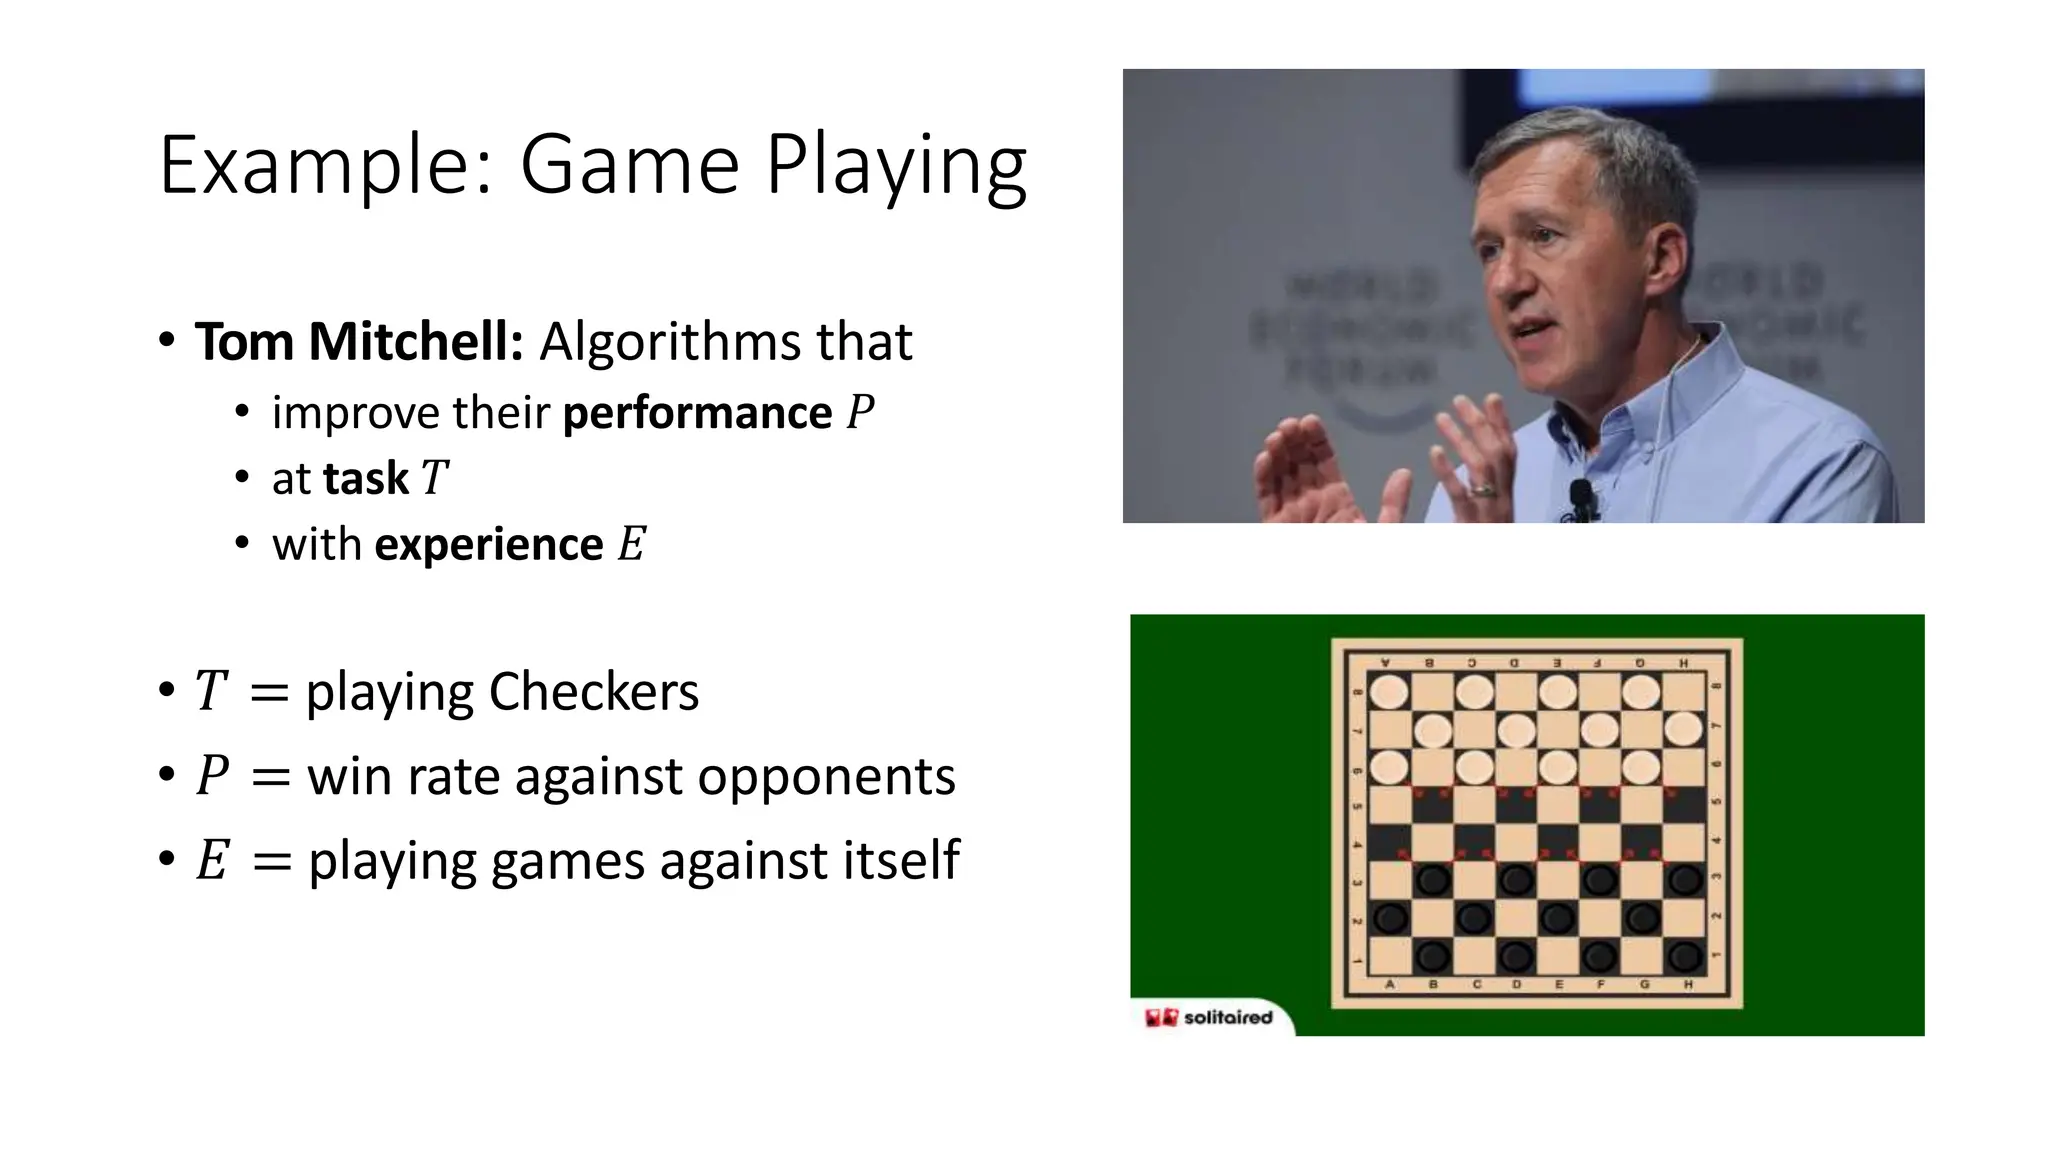
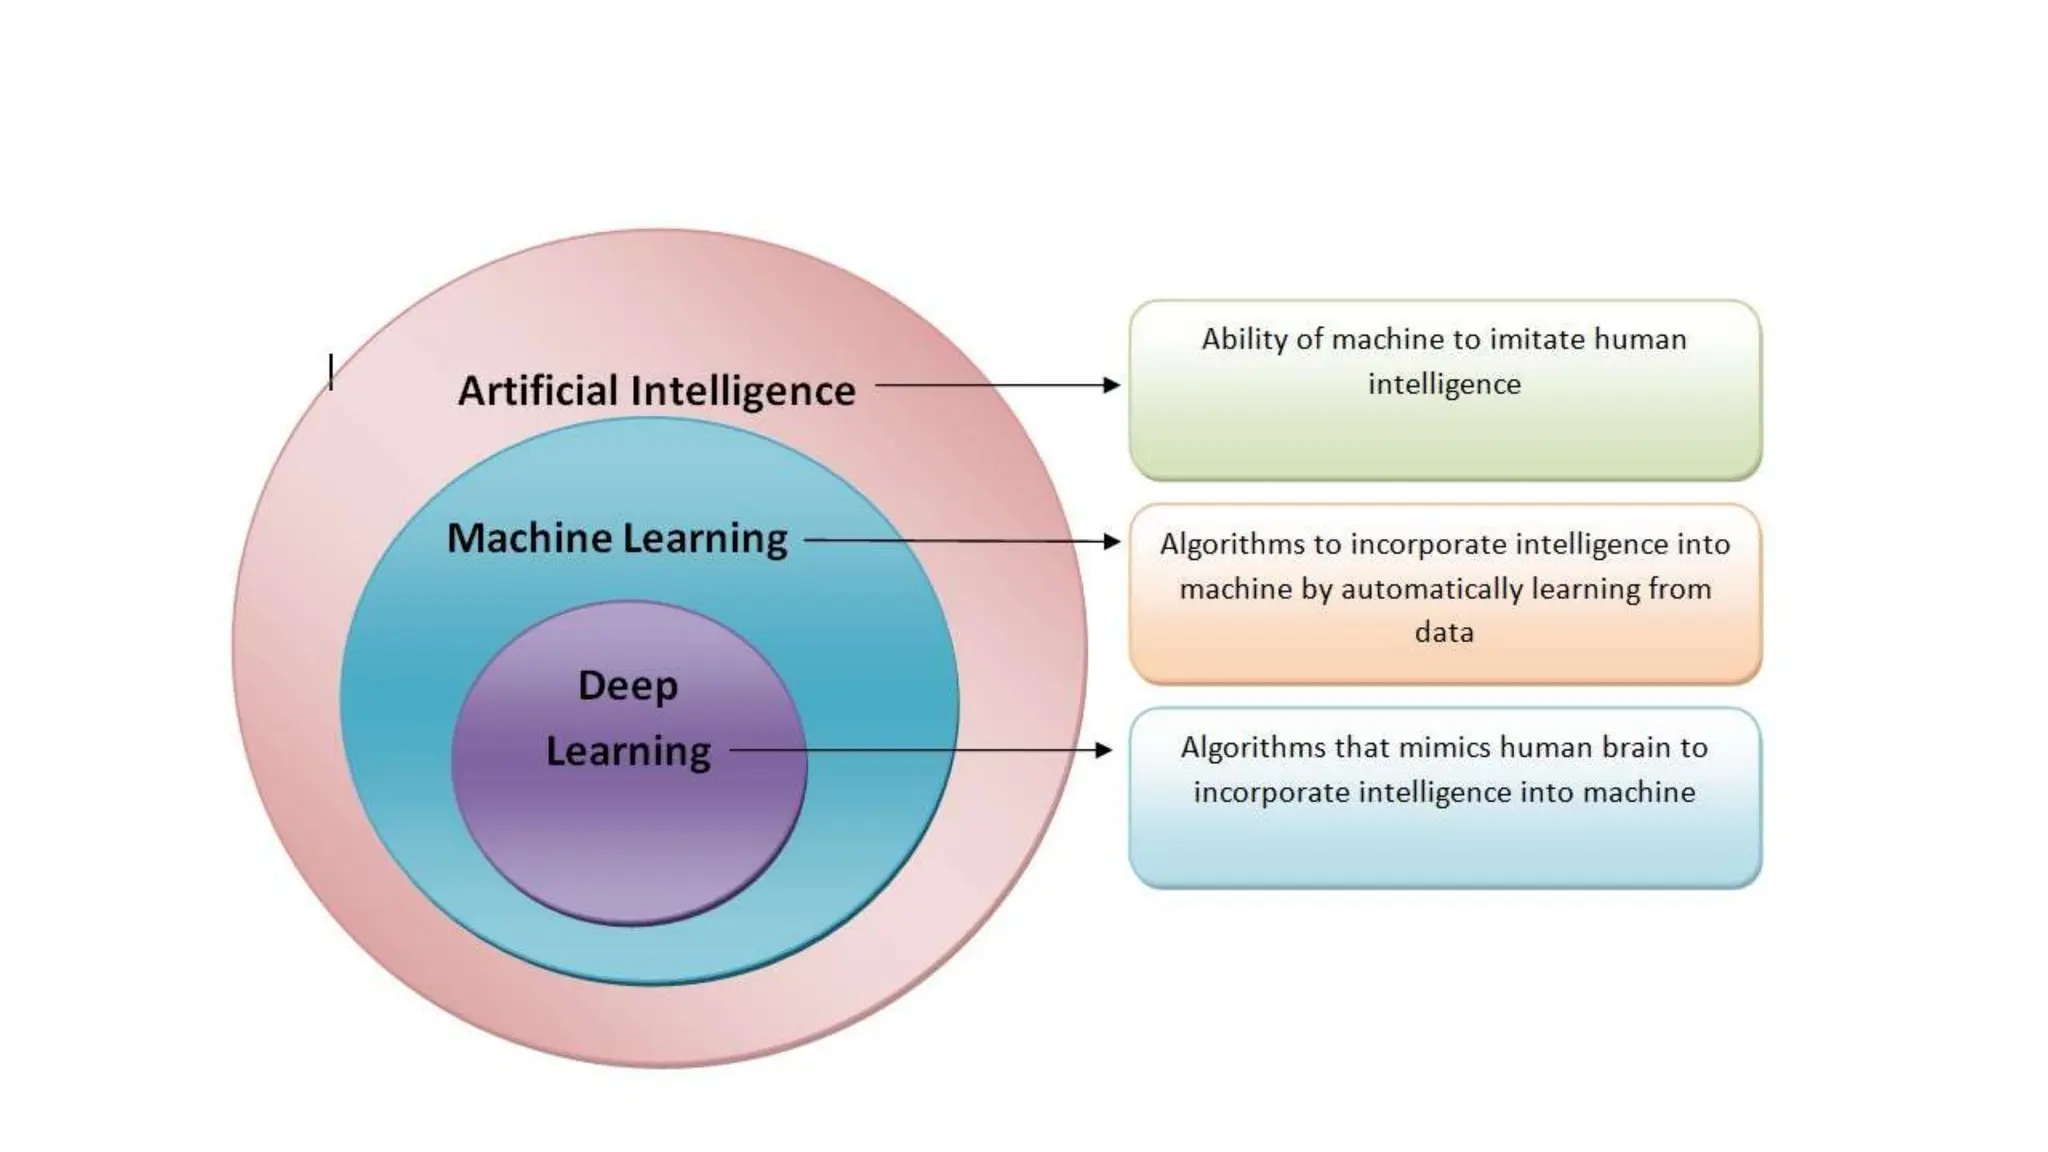
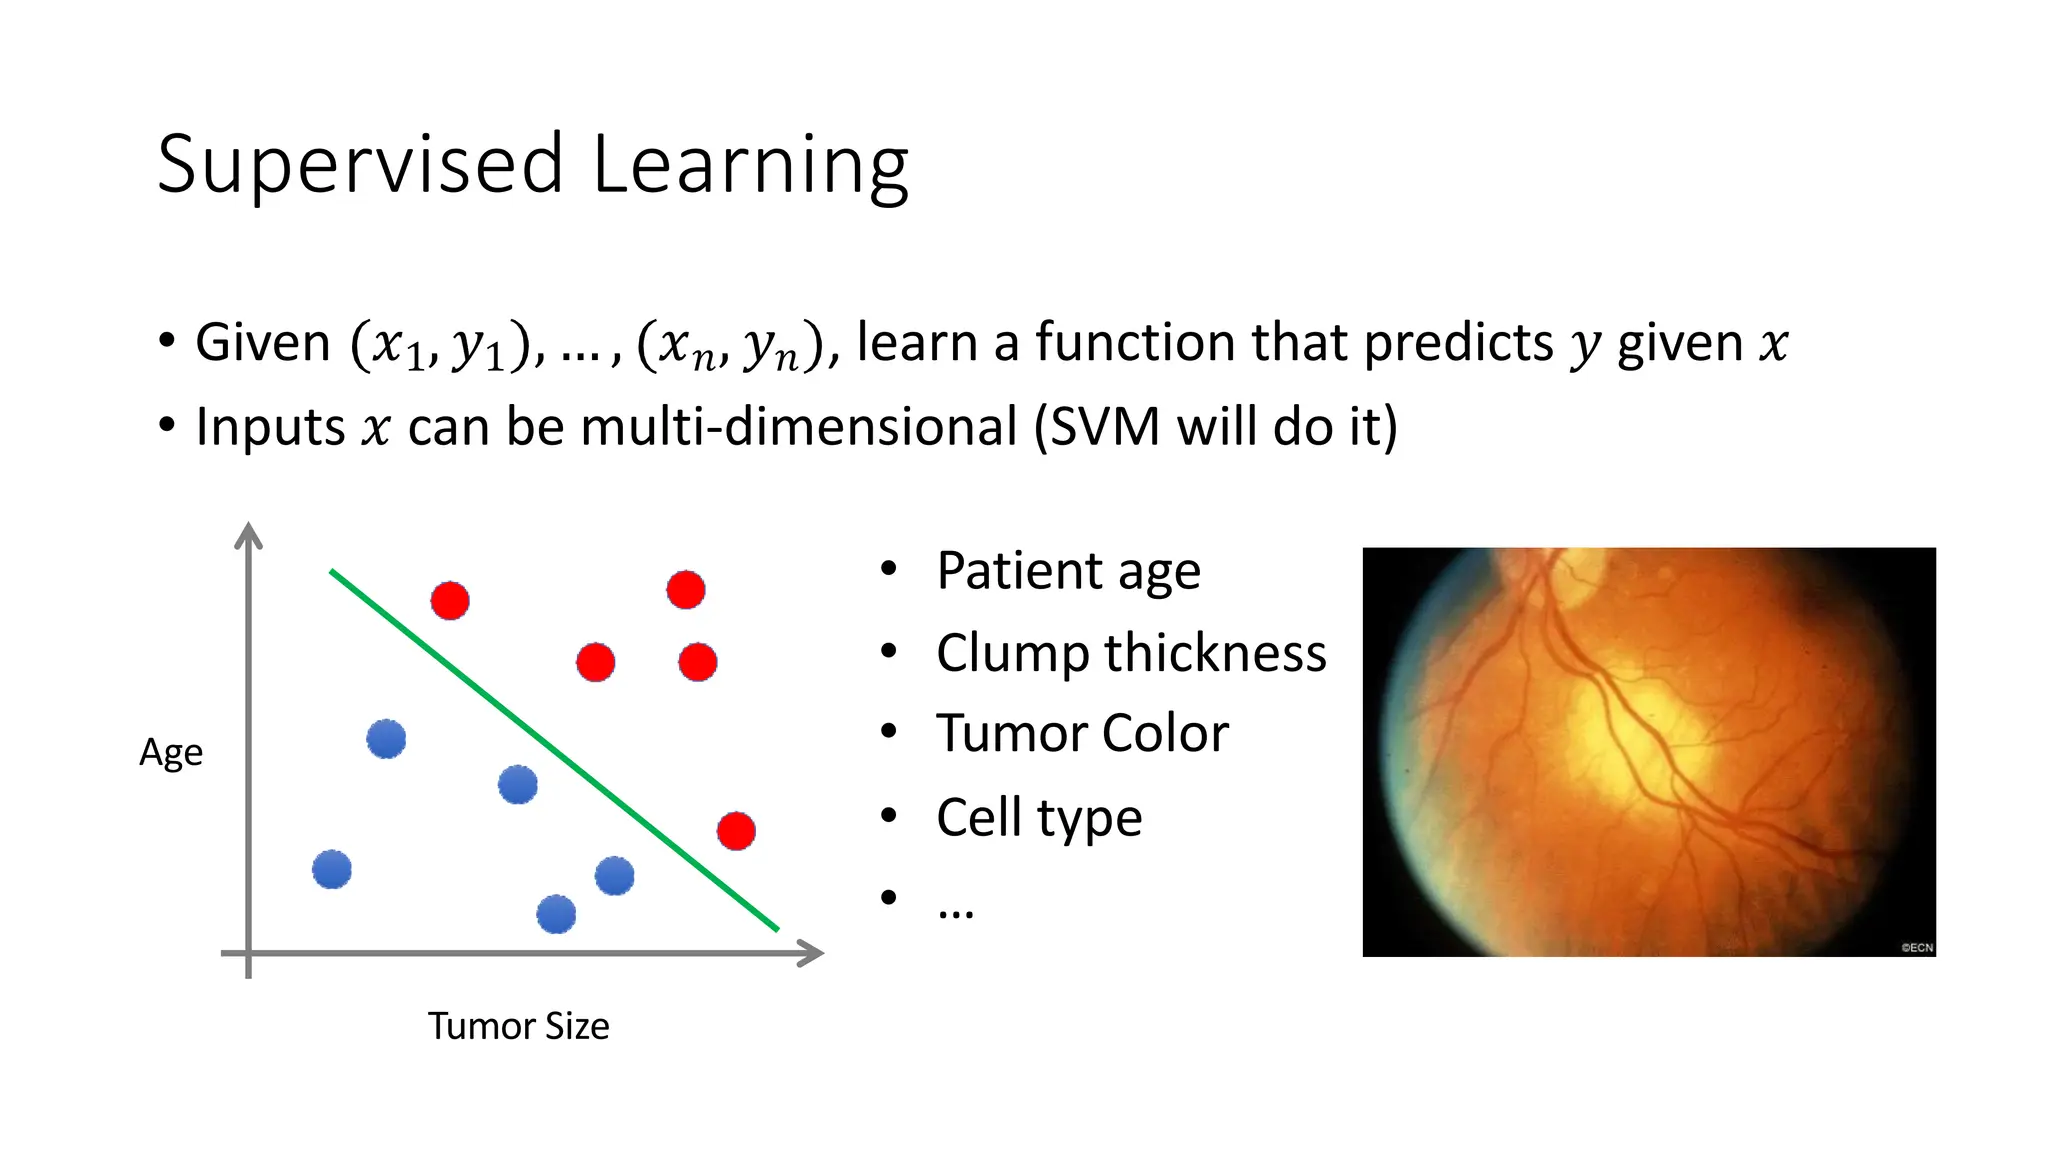
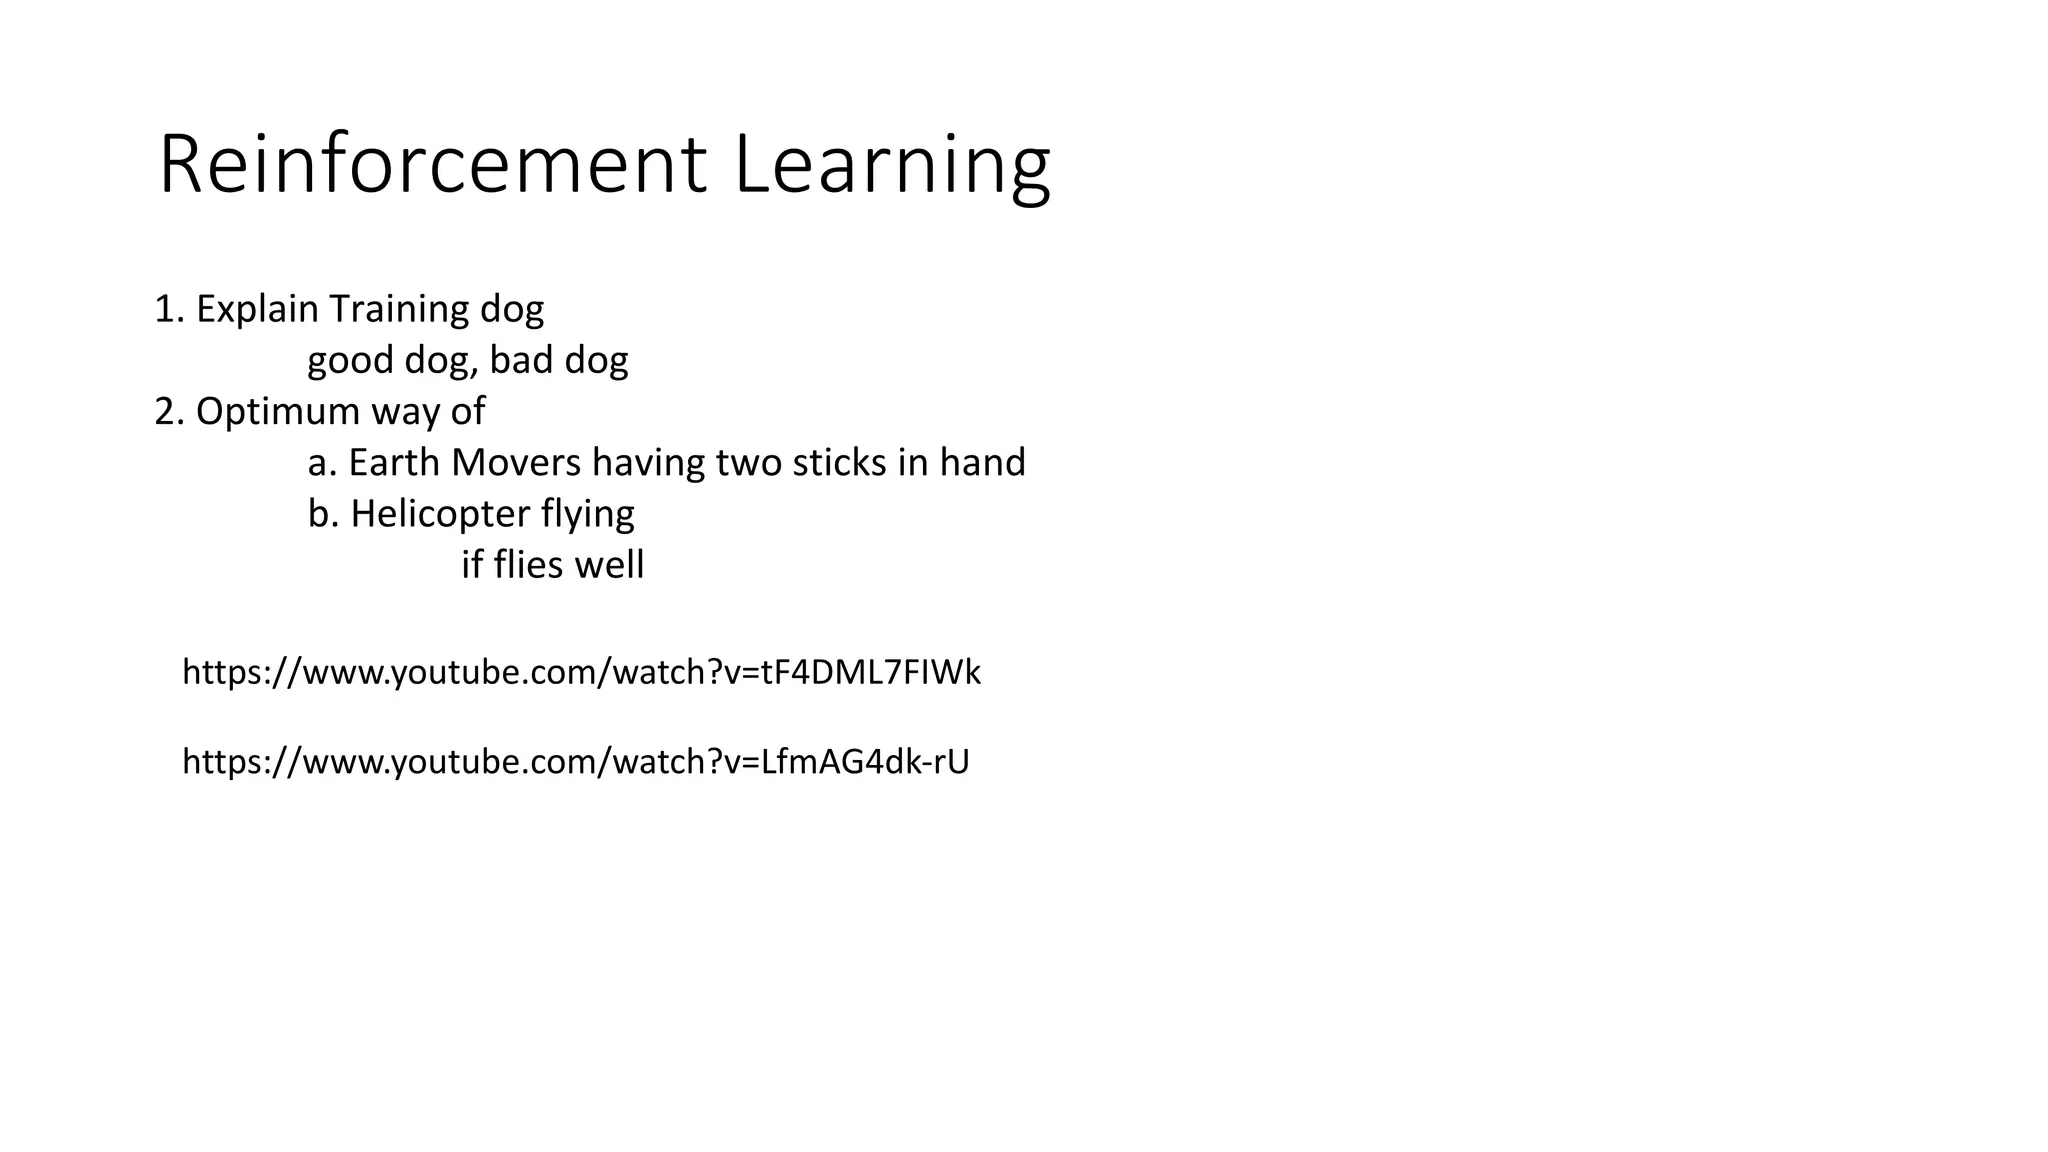
SlideShare a Scribd company logo
1 of 113
Machine
Learning
Prepared
by
V Babu Ravipati
Course Objectives:
The learning objectives of this course are:
1. Familiarity with a set of well-known supervised,
unsupervised and semi-supervised learning algorithms.
2. The ability to implement some basic machine learning
algorithms.
3. Understanding of how machine learning algorithms are
evaluated
Course Outcomes: On completion of this course, students can
1. Explain the fundamental usage of the concept Machine
Learning system.
2. Demonstrate on various regression Technique.
3. Analyze the Ensemble Learning Methods.
4. Illustrate the Clustering Techniques and Dimensionality
Reduction Models in Machine Learning.
5. Discuss the Neural Network Models and Fundamentals
concepts of Deep Learning.
Text(T) / Reference(R) Books
:
T1 Hands-On Machine Learning with Scikit-Learn, Keras, and TensorFlow, 2nd
Edition, O’Reilly Publications, 2019
T2 Data Science and Machine Learning Mathematical and Statistical
Methods,Dirk P. Kroese, Zdravko I. Botev, Thomas Taimre, Radislav
Vaisman,25th November 2020
R1 Understanding Machine Learning: From Theory to algorithms, Shai Shalev-
Shwartz, Shai Ben-David, Cambridge.
R2 Machine Learning Probabilistic Approach, Kevin P. Murphy, MIT Press,
2012
W1 https://www.tutorialspoint.com/what-is-machine-learning
W2 https://www.analyticsvidhya.com/machine-learning/
W3 https://www.youtube.com/watch?v=eq7KF7JTinU
What is Machine Learning?
“Machine learning … gives
computers the ability to learn
without being explicitly
programmed.” Arthur Samuel
What is Machine Learning?
• Tom Mitchell: Algorithms that
• improve their performance 𝑃
• at task 𝑇
• with experience 𝐸
• A well-defined machine learning
task is given by 𝑃, 𝑇, 𝐸
“A computer program is said to learn
from experience E with respect to
some class of tasks T and performance
measure P if its performance at tasks
in T, as measured by P, improves with
experience E.”
Tom Mitchell
Example: Game Playing
• Tom Mitchell: Algorithms that
• improve their performance 𝑃
• at task 𝑇
• with experience 𝐸
• 𝑇 = playing Checkers
• 𝑃 = win rate against opponents
• 𝐸 = playing games against itself
Example: Prediction
Image:https://www.flickr.com/photos/gsfc/5937
35
199688/
Data from https://nsidc.org/arcticseaicenews/sea-ice-tools/
9.0
8.0
7.0
6.0
5.0
4.0
3.0
2.0
1.0
0.0
1975 1985 1995 2005 2015 2025
Arctic
Sea
Ice
Extent
(millions
of
sq
km)
Year
NSIDC Index of Arctic Sea Ice in September
Photo by NASA Goddard
??
Example: Prediction
• Tom Mitchell: Algorithms that
• improve their performance 𝑃
• at some task 𝑇
• with experience 𝐸
• 𝑇 = predict Arctic sea ice extent
• 𝑃 = prediction error (e.g.,
absolute difference)
• 𝐸 = historical data
Machine Learning for Prediction
Data 𝑍 Machine learning
algorithm
Model 𝑓
New input
Predicted output
Example: Prediction
9.0
8.0
7.0
6.0
5.0
4.0
3.0
2.0
1.0
0.0
1975 1985 1995 2005 2015 2025
Arctic
Sea
Ice
Extent
(millions
of
sq
km)
Year
NSIDC Index of Arctic Sea Ice in September
Photo by NASA Goddard
??
Image:https://www.flickr.com/photos/gsfc/5937599688/
Data from https://nsidc.org/arcticseaicenews/sea-ice-tools/
Types of Learning
• Supervised learning
• Input: Examples of inputs and outputs
• Output: Model that predicts unknown output given a new input
• Unsupervised learning
• Input: Examples of some data (no “outputs”)
• Output: Representation of structure in the data
• Reinforcement learning
• Input: Sequence of interactions with an environment
• Output: Policy that performs a desired task
Supervised Learning
1. Cost of house depending on size of the house.
2. Regression and Classification
3. Drop a ball from a height, need to calculate distance travelled
Supervised Learning
Image:https://www.flickr.com/photos/gsfc/5937
35
899688/
Data from https://nsidc.org/arcticseaicenews/sea-ice-tools/
9.0
8.0
7.0
6.0
5.0
4.0
3.0
2.0
1.0
0.0
1975
• Given 𝑥1, 𝑦1 , … , 𝑥𝑛, 𝑦𝑛 , learn a function that predicts 𝑦 given 𝑥
• Regression: Labels 𝑦 are real-valued
NSIDC Index of Arctic Sea Ice in September
1985 1995 2005 2015 2025
Arctic
Sea
Ice
Extent
(millions
of
sq
km)
Year
Photo by NASA Goddard
Supervised Learning
• Given 𝑥1, 𝑦1 , … , 𝑥𝑛, 𝑦𝑛 , learn a function that predicts 𝑦 given 𝑥
• Classification: Labels 𝑦 are categories
Tumor Size
Ocular Tumor (Malignant / Benign)
𝑓(𝑥)
Predict Benign Predict Malignant
Malignant
Benign
Supervised Learning
• Given 𝑥1, 𝑦1 , … , 𝑥𝑛, 𝑦𝑛 , learn a function that predicts 𝑦 given 𝑥
• Inputs 𝑥 can be multi-dimensional (SVM will do it)
Tumor Size
Age
• Patient age
• Clump thickness
• Tumor Color
• Cell type
• …
Unsupervised Learning
• Given 𝑥1, … , 𝑥𝑛 (no labels), output hidden structure in 𝑥’s
• E.g., clustering
Unsupervised Learning
Image Credits:
https://medium.com/graph-commons/finding-organic-clusters-in-your-complex-data-networks-5c27e1d4645d
https://arxiv.org/pdf/1703.08893.pdf
https://en.wikipedia.org/wiki/Exoplanet
Find Subgroups in
Social Networks
Identify Types of Exoplanets Visualize Data
Explain Cocktail Party Problem
Unsupervised Learning
Reinforcement Learning
• Learn how to perform a task from
interactions with the environment
• Examples:
• Autonomous vehicle
• Playing chess (interact with the game)
• Robot grasping an object (interact
with the object/real world)
• Optimize inventory allocations
(interact with the inventory system)
environment agent
Reinforcement Learning
https://www.youtube.com/watch?v=iaF43Ze1oeI
1. Explain Training dog
good dog, bad dog
2. Optimum way of
a. Earth Movers having two sticks in hand
b. Helicopter flying
if flies well
Reinforcement Learning
https://www.youtube.com/watch?v=LfmAG4dk-rU
https://www.youtube.com/watch?v=tF4DML7FIWk
Applications of Machine Learning
45
1.Cortana, Alexa
2.Traffic prediction
3.Judiciary
4.Medical
5.Every area
Everyday Applications
Radiology and Medicine
https://www.nature.com/articles/s41746-020-00376-2
Input: Brain scans
Output: Neurological disease labels
https://www.nature.com/articles/s41573-019-0024-5
Main Challenges of Machine Learning
1. Insufficient Quantity of Training Data : Millions of data is
required
2. Nonrepresentative Training Data: Localised output because
of trained with localised data
3. Poor-Quality Data: Outliers and missing data
4. Irrelevant Features : Garbage In Garbage Out (our model is
“AWESOME” and we feed it with garbage data)
5. Overfitting the Training Data : Low Bias, High Variance
(Bias means training set error, Variance means test set
error)
6. Underfitting the Training Data : High Bias and High Variance
Statistical learning.
Structuring and visualizing data are important aspects of data science
When the goal is to interpret the model and quantify the uncertainty
in the data, this analysis is usually referred to as statistical learning
There are two major goals for modeling data:
1) to accurately predict some future quantity of interest, given some
observed data, and
2) to discover unusual or interesting patterns in the data.
To achieve these goals, one must rely on knowledge from
three important pillars of the mathematical science
1. Function approximation:The most natural way to
represent the relationship between variables is via a
mathematical function or map.
Thus, data scientists have to understand how best to
approximate and represent functions using the least
amount of computer processing and memory.
Statistical learning cont.,
2. Optimization:Given a class of mathematical models, we
wish to find the best possible model in that class.
This step usually requires knowledge of optimization
algorithms and efficient computer coding or programming.
3. Probability and statistics: The knowledge of probability and
statistics is needed to fit or train algorithm and generate a
model.
Predictions: In machine learning, predictions are made
based on models or algorithms. These predictions are
estimations or forecasts of certain outcomes, denoted
as "ŷ" (y-hat).
Response y: This refers to the actual or observed
outcomes that are being predicted. In many cases, this
is the ground truth or the real data values
corresponding to the situations for which predictions
are being made. This is denoted as "y."
Loss function: A loss function, also known as a cost
function or objective function, is a mathematical
function that quantifies the difference between the
predicted values (ŷ) and the actual values (y). It
essentially measures how well or poorly the model is
performing. The goal is to minimize this function.
This loss function provides a quantitative
measure of the model's performance.
Mathematical function g: This refers to a model or an
algorithm represented by the mathematical function
g(x). In the context of predictions, g(x) would be used
to estimate or predict corresponding values y based on
given inputs x.
Accurate predictions: The term "accurate predictions"
implies that the mathematical function should provide
outputs that closely match the true outcomes observed
in the real world.
All possible pairs (x, y) in Nature: Nature is diverse and
complex.
Vast range of scenarios and data pairs encounter in the
natural world.
The possibility of finding a single mathematical
function that can accurately predict outcomes for
every conceivable combination of input and output
values.
When dealing with complex real-world data, it's
common to use a variety of models or a more
sophisticated approach, such as machine learning,
where the algorithm adapts and learns from the data to
make predictions
“Even with the same input x, the output y may be
different“.
Explain Weather forecasting example
(location, temperature, humidity, wind speed, and atmospheric pressure)
Meteorologists acknowledge that, even with
sophisticated models and accurate initial
measurements, perfect predictability in weather
forecasting is challenging due to the inherent
complexity and variability of atmospheric processes.
Deterministic and Probabilistic
We adopt a probabilistic approach and assume that
each pair (x, y) is the outcome of a random pair (X, Y)
that has some joint probability density f(x, y).
The relationship between the variables x and y is
treated as a result of a random process (X,Y).
We then assess the predictive performance
via the expected loss, usually called the risk
for g:
ℓ(g) = E Loss(Y, g(X)).
Our goal is thus to “learn” the unknown g∗ using
the n examples in the training set T.
Let us denote this as gT
The best approximation for g ∗ that we can construct
from T
Tower property
Let's consider a sequence of random variables X, Y, and
Z. The tower property states:
E[E[X∣Y,Z]]=E[E[X∣Y]],
Tower property says that the expectation of the
conditional expectation of X given both Y and Z is equal
to the expectation of the conditional expectation of X
given only Y.
The learner learns the relationship with examples,
this type of learning is called supervised learning.
In contrast, Unsupervised learning makes no
distinction between response and explanatory
variables.
Objective is simply to learn the structure of the
unknown distribution of the data.
Debugging a learning algorithm
• You have built you awesome linear regression model predicting price
• Work perfectly on you testing data
Source: Andrew Ng
Debugging a learning algorithm
• You have built you awesome linear regression model predicting price
• Work perfectly on you testing data
• Then it fails miserably when you test it on the new data you collected
Source: Andrew Ng
Debugging a learning algorithm
• You have built you awesome linear regression model predicting price
• Work perfectly on you testing data
• Then it fails miserably when you test it on the new data you collected
• What to do now?
Source: Andrew Ng
Things You Can Try
Get more data
Try different features
Try tuning your hyperparameter
Things You Can Try
Get more data
Try different features
Try tuning your hyperparameter
But which should I try first?
Diagnosing Machine Learning System
Figure out what is wrong first
Diagnosing your system takes time, but it can
save your time as well
Ultimate goal: low generalization error
Diagnosing Machine Learning System
Figure out what is wrong first
Diagnosing your system takes time, but it can save your time as well
Ultimate goal: low generalization error
Source: reddit?
Diagnosing Machine Learning System
Figure out what is wrong first
Diagnosing your system takes time, but it can save your time as well
Ultimate goal: low generalization error
Source: reddit?
Problem: Fail to Generalize
Model does not generalize to unseen data
Fail to predict things that are not in training sample
Pick a model that has lower generalization error
Evaluate Your Hypothesis
Price
($)
Size (ft)
Price
($)
Size (ft)
Price
($)
Size (ft)
Source: Andrew Ng
Evaluate Your Hypothesis
Price
($)
Size (ft)
Price
($)
Size (ft)
Price
($)
Size (ft)
Underfit Overfit
Just right
Source: Andrew Ng
Evaluate Your Hypothesis
Price
($)
Size (ft)
Price
($)
Size (ft)
Price
($)
Size (ft)
Underfit Overfit
Just right
What if the feature dimension is too high?
Source: Andrew Ng
Model Selection
Model does not generalize to unseen data
Fail to predict things that are not in training sample
Pick a model that has lower generalization error
Model Selection
Model does not generalize to unseen data
Fail to predict things that are not in training sample
Pick a model that has lower generalization error
How to evaluate generalization error?
Model Selection
Model does not generalize to unseen data
Fail to predict things that are not in training sample
Pick a model that has lower generalization error
How to evaluate generalization error?
Split your data into train, validation, and test set.
Use test set error as an estimator of generalization
error
Model Selection
Training error
Validation error
Test error
Model Selection
Training error
Validation error
Test error
Procedure:
Step 1. Train on training set
Step 2. Evaluate validation error
Step 3. Pick the best model based on Step 2.
Step 4. Evaluate the test error
Bias/Variance Trade-off
Price
($)
Size (ft)
Price
($)
Size (ft)
Price
($)
Size (ft)
Underfit Overfit
Just right
Source: Andrew Ng
Bias/Variance Trade-off
Price
($)
Size (ft)
Price
($)
Size (ft)
Price
($)
Size (ft)
Underfit
High bias
Overfit
High Variance
Just right
Source: Andrew Ng
Bias/Variance Trade-off
Price
($)
Size (ft)
Price
($)
Size (ft)
Price
($)
Size (ft)
Underfit
High bias
Too simple
Overfit
High Variance
Too Complex
Just right
Source: Andrew Ng
Linear Regression with Regularization
Price
($)
Size (ft)
Price
($)
Size (ft)
Price
($)
Size (ft)
Underfit
High bias
Too simple
Too much regularization
Overfit
High Variance
Too Complex
Too little regularization
Just right
Source: Andrew Ng
Bias / Variance Trade-off
Training error
Cross-validation error
Loss
Degree of Polynomial
Source: Andrew Ng
Bias / Variance Trade-off
Training error
Cross-validation error
Loss
Degree of Polynomial
High bias High Variance
Problem: Fail to Generalize
Should we get more data?
Problem: Fail to Generalize
Should we get more data?
Getting more data does not always help
Problem: Fail to Generalize
Should we get more data?
Getting more data does not always help
How do we know if we should collect more data?
Learning Curve
m=1
m=3
m=5
m=2
m=4
m=6
Learning Curve
m=1
m=3
m=5
m=2
m=4
m=6
Learning Curve
Learning Curve
Underfit
High bias
Overfit
High Variance
Learning Curve
Underfit
High bias
Does adding more data help?
Price
($)
Size (ft)
Learning Curve
Underfit
High bias
Does adding more data help?
Price
($)
Size (ft)
Learning Curve
Does adding more data help?
Price
($)
Size (ft)
Price
($)
Size (ft)
More data doesn't help when your model has high bias
Learning Curve
Does adding more data help?
Overfit
High Variance
Price
($)
Size (ft)
Learning Curve
Does adding more data help?
Overfit
High Variance
Price
($)
Size (ft)
Learning Curve
Does adding more data help?
More data is likely to help when your model has high variance
Price
($)
Size (ft)
Price
($)
Size (ft)
Things You Can Try
Get more data
When you have high variance
Try different features
Adding feature helps fix high bias
Using smaller sets of feature fix high variance
Try tuning your hyperparameter
Decrease regularization when bias is high
Increase regularization when variance is high
Machine learning ppt unit one syllabuspptx

More Related Content

Similar to Machine learning ppt unit one syllabuspptx

Intro to machine learning
Intro to machine learningIntro to machine learning
Intro to machine learningAkshay Kanchan
 
5. Machine Learning.pptx
5.  Machine Learning.pptx5.  Machine Learning.pptx
5. Machine Learning.pptxssuser6654de1
 
Big Data & Machine Learning - TDC2013 São Paulo - 12/0713
Big Data & Machine Learning - TDC2013 São Paulo - 12/0713Big Data & Machine Learning - TDC2013 São Paulo - 12/0713
Big Data & Machine Learning - TDC2013 São Paulo - 12/0713Mathieu DESPRIEE
 
Introduction to machine learning-2023-IT-AI and DS.pdf
Introduction to machine learning-2023-IT-AI and DS.pdfIntroduction to machine learning-2023-IT-AI and DS.pdf
Introduction to machine learning-2023-IT-AI and DS.pdfSisayNegash4
 
Fundementals of Machine Learning and Deep Learning
Fundementals of Machine Learning and Deep Learning Fundementals of Machine Learning and Deep Learning
Fundementals of Machine Learning and Deep Learning ParrotAI
 
Big Data & Machine Learning - TDC2013 Sao Paulo
Big Data & Machine Learning - TDC2013 Sao PauloBig Data & Machine Learning - TDC2013 Sao Paulo
Big Data & Machine Learning - TDC2013 Sao PauloOCTO Technology
 
Design principle of pattern recognition system and STATISTICAL PATTERN RECOGN...
Design principle of pattern recognition system and STATISTICAL PATTERN RECOGN...Design principle of pattern recognition system and STATISTICAL PATTERN RECOGN...
Design principle of pattern recognition system and STATISTICAL PATTERN RECOGN...TEJVEER SINGH
 
G. Barcaroli, The use of machine learning in official statistics
G. Barcaroli, The use of machine learning in official statisticsG. Barcaroli, The use of machine learning in official statistics
G. Barcaroli, The use of machine learning in official statisticsIstituto nazionale di statistica
 
slides
slidesslides
slidesbutest
 
slides
slidesslides
slidesbutest
 
Machine Learning Contents.pptx
Machine Learning Contents.pptxMachine Learning Contents.pptx
Machine Learning Contents.pptxNaveenkushwaha18
 
Regression with Microsoft Azure & Ms Excel
Regression with Microsoft Azure & Ms ExcelRegression with Microsoft Azure & Ms Excel
Regression with Microsoft Azure & Ms ExcelDr. Abdul Ahad Abro
 
Lecture 09(introduction to machine learning)
Lecture 09(introduction to machine learning)Lecture 09(introduction to machine learning)
Lecture 09(introduction to machine learning)Jeet Das
 
Unit 1 - ML - Introduction to Machine Learning.pptx
Unit 1 - ML - Introduction to Machine Learning.pptxUnit 1 - ML - Introduction to Machine Learning.pptx
Unit 1 - ML - Introduction to Machine Learning.pptxjawad184956
 
Study and Analysis of K-Means Clustering Algorithm Using Rapidminer
Study and Analysis of K-Means Clustering Algorithm Using RapidminerStudy and Analysis of K-Means Clustering Algorithm Using Rapidminer
Study and Analysis of K-Means Clustering Algorithm Using RapidminerIJERA Editor
 

Similar to Machine learning ppt unit one syllabuspptx (20)

Introduction to machine learning
Introduction to machine learningIntroduction to machine learning
Introduction to machine learning
 
Ml ppt at
Ml ppt atMl ppt at
Ml ppt at
 
Machine Learning.pptx
Machine Learning.pptxMachine Learning.pptx
Machine Learning.pptx
 
Intro to machine learning
Intro to machine learningIntro to machine learning
Intro to machine learning
 
5. Machine Learning.pptx
5.  Machine Learning.pptx5.  Machine Learning.pptx
5. Machine Learning.pptx
 
Big Data & Machine Learning - TDC2013 São Paulo - 12/0713
Big Data & Machine Learning - TDC2013 São Paulo - 12/0713Big Data & Machine Learning - TDC2013 São Paulo - 12/0713
Big Data & Machine Learning - TDC2013 São Paulo - 12/0713
 
Introduction to machine learning-2023-IT-AI and DS.pdf
Introduction to machine learning-2023-IT-AI and DS.pdfIntroduction to machine learning-2023-IT-AI and DS.pdf
Introduction to machine learning-2023-IT-AI and DS.pdf
 
Fundementals of Machine Learning and Deep Learning
Fundementals of Machine Learning and Deep Learning Fundementals of Machine Learning and Deep Learning
Fundementals of Machine Learning and Deep Learning
 
Big Data & Machine Learning - TDC2013 Sao Paulo
Big Data & Machine Learning - TDC2013 Sao PauloBig Data & Machine Learning - TDC2013 Sao Paulo
Big Data & Machine Learning - TDC2013 Sao Paulo
 
Design principle of pattern recognition system and STATISTICAL PATTERN RECOGN...
Design principle of pattern recognition system and STATISTICAL PATTERN RECOGN...Design principle of pattern recognition system and STATISTICAL PATTERN RECOGN...
Design principle of pattern recognition system and STATISTICAL PATTERN RECOGN...
 
Data Science Machine
Data Science Machine Data Science Machine
Data Science Machine
 
G. Barcaroli, The use of machine learning in official statistics
G. Barcaroli, The use of machine learning in official statisticsG. Barcaroli, The use of machine learning in official statistics
G. Barcaroli, The use of machine learning in official statistics
 
slides
slidesslides
slides
 
slides
slidesslides
slides
 
Machine Learning Contents.pptx
Machine Learning Contents.pptxMachine Learning Contents.pptx
Machine Learning Contents.pptx
 
Regression with Microsoft Azure & Ms Excel
Regression with Microsoft Azure & Ms ExcelRegression with Microsoft Azure & Ms Excel
Regression with Microsoft Azure & Ms Excel
 
Lecture 09(introduction to machine learning)
Lecture 09(introduction to machine learning)Lecture 09(introduction to machine learning)
Lecture 09(introduction to machine learning)
 
module 6 (1).ppt
module 6 (1).pptmodule 6 (1).ppt
module 6 (1).ppt
 
Unit 1 - ML - Introduction to Machine Learning.pptx
Unit 1 - ML - Introduction to Machine Learning.pptxUnit 1 - ML - Introduction to Machine Learning.pptx
Unit 1 - ML - Introduction to Machine Learning.pptx
 
Study and Analysis of K-Means Clustering Algorithm Using Rapidminer
Study and Analysis of K-Means Clustering Algorithm Using RapidminerStudy and Analysis of K-Means Clustering Algorithm Using Rapidminer
Study and Analysis of K-Means Clustering Algorithm Using Rapidminer
 

Recently uploaded

Oxy acetylene welding presentation note.
Oxy acetylene welding presentation note.Oxy acetylene welding presentation note.
Oxy acetylene welding presentation note.eptoze12
 
GDSC ASEB Gen AI study jams presentation
GDSC ASEB Gen AI study jams presentationGDSC ASEB Gen AI study jams presentation
GDSC ASEB Gen AI study jams presentationGDSCAESB
 
Heart Disease Prediction using machine learning.pptx
Heart Disease Prediction using machine learning.pptxHeart Disease Prediction using machine learning.pptx
Heart Disease Prediction using machine learning.pptxPoojaBan
 
Artificial-Intelligence-in-Electronics (K).pptx
Artificial-Intelligence-in-Electronics (K).pptxArtificial-Intelligence-in-Electronics (K).pptx
Artificial-Intelligence-in-Electronics (K).pptxbritheesh05
 
Sheet Pile Wall Design and Construction: A Practical Guide for Civil Engineer...
Sheet Pile Wall Design and Construction: A Practical Guide for Civil Engineer...Sheet Pile Wall Design and Construction: A Practical Guide for Civil Engineer...
Sheet Pile Wall Design and Construction: A Practical Guide for Civil Engineer...Dr.Costas Sachpazis
 
Application of Residue Theorem to evaluate real integrations.pptx
Application of Residue Theorem to evaluate real integrations.pptxApplication of Residue Theorem to evaluate real integrations.pptx
Application of Residue Theorem to evaluate real integrations.pptx959SahilShah
 
CCS355 Neural Network & Deep Learning UNIT III notes and Question bank .pdf
CCS355 Neural Network & Deep Learning UNIT III notes and Question bank .pdfCCS355 Neural Network & Deep Learning UNIT III notes and Question bank .pdf
CCS355 Neural Network & Deep Learning UNIT III notes and Question bank .pdfAsst.prof M.Gokilavani
 
SPICE PARK APR2024 ( 6,793 SPICE Models )
SPICE PARK APR2024 ( 6,793 SPICE Models )SPICE PARK APR2024 ( 6,793 SPICE Models )
SPICE PARK APR2024 ( 6,793 SPICE Models )Tsuyoshi Horigome
 
Study on Air-Water & Water-Water Heat Exchange in a Finned Tube Exchanger
Study on Air-Water & Water-Water Heat Exchange in a Finned Tube ExchangerStudy on Air-Water & Water-Water Heat Exchange in a Finned Tube Exchanger
Study on Air-Water & Water-Water Heat Exchange in a Finned Tube ExchangerAnamika Sarkar
 
High Profile Call Girls Nagpur Meera Call 7001035870 Meet With Nagpur Escorts
High Profile Call Girls Nagpur Meera Call 7001035870 Meet With Nagpur EscortsHigh Profile Call Girls Nagpur Meera Call 7001035870 Meet With Nagpur Escorts
High Profile Call Girls Nagpur Meera Call 7001035870 Meet With Nagpur EscortsCall Girls in Nagpur High Profile
 
Introduction to Microprocesso programming and interfacing.pptx
Introduction to Microprocesso programming and interfacing.pptxIntroduction to Microprocesso programming and interfacing.pptx
Introduction to Microprocesso programming and interfacing.pptxvipinkmenon1
 
APPLICATIONS-AC/DC DRIVES-OPERATING CHARACTERISTICS
APPLICATIONS-AC/DC DRIVES-OPERATING CHARACTERISTICSAPPLICATIONS-AC/DC DRIVES-OPERATING CHARACTERISTICS
APPLICATIONS-AC/DC DRIVES-OPERATING CHARACTERISTICSKurinjimalarL3
 
Microscopic Analysis of Ceramic Materials.pptx
Microscopic Analysis of Ceramic Materials.pptxMicroscopic Analysis of Ceramic Materials.pptx
Microscopic Analysis of Ceramic Materials.pptxpurnimasatapathy1234
 
What are the advantages and disadvantages of membrane structures.pptx
What are the advantages and disadvantages of membrane structures.pptxWhat are the advantages and disadvantages of membrane structures.pptx
What are the advantages and disadvantages of membrane structures.pptxwendy cai
 
IVE Industry Focused Event - Defence Sector 2024
IVE Industry Focused Event - Defence Sector 2024IVE Industry Focused Event - Defence Sector 2024
IVE Industry Focused Event - Defence Sector 2024Mark Billinghurst
 
OSVC_Meta-Data based Simulation Automation to overcome Verification Challenge...
OSVC_Meta-Data based Simulation Automation to overcome Verification Challenge...OSVC_Meta-Data based Simulation Automation to overcome Verification Challenge...
OSVC_Meta-Data based Simulation Automation to overcome Verification Challenge...Soham Mondal
 

Recently uploaded (20)

Oxy acetylene welding presentation note.
Oxy acetylene welding presentation note.Oxy acetylene welding presentation note.
Oxy acetylene welding presentation note.
 
GDSC ASEB Gen AI study jams presentation
GDSC ASEB Gen AI study jams presentationGDSC ASEB Gen AI study jams presentation
GDSC ASEB Gen AI study jams presentation
 
Heart Disease Prediction using machine learning.pptx
Heart Disease Prediction using machine learning.pptxHeart Disease Prediction using machine learning.pptx
Heart Disease Prediction using machine learning.pptx
 
Artificial-Intelligence-in-Electronics (K).pptx
Artificial-Intelligence-in-Electronics (K).pptxArtificial-Intelligence-in-Electronics (K).pptx
Artificial-Intelligence-in-Electronics (K).pptx
 
Sheet Pile Wall Design and Construction: A Practical Guide for Civil Engineer...
Sheet Pile Wall Design and Construction: A Practical Guide for Civil Engineer...Sheet Pile Wall Design and Construction: A Practical Guide for Civil Engineer...
Sheet Pile Wall Design and Construction: A Practical Guide for Civil Engineer...
 
Application of Residue Theorem to evaluate real integrations.pptx
Application of Residue Theorem to evaluate real integrations.pptxApplication of Residue Theorem to evaluate real integrations.pptx
Application of Residue Theorem to evaluate real integrations.pptx
 
CCS355 Neural Network & Deep Learning UNIT III notes and Question bank .pdf
CCS355 Neural Network & Deep Learning UNIT III notes and Question bank .pdfCCS355 Neural Network & Deep Learning UNIT III notes and Question bank .pdf
CCS355 Neural Network & Deep Learning UNIT III notes and Question bank .pdf
 
young call girls in Rajiv Chowk🔝 9953056974 🔝 Delhi escort Service
young call girls in Rajiv Chowk🔝 9953056974 🔝 Delhi escort Serviceyoung call girls in Rajiv Chowk🔝 9953056974 🔝 Delhi escort Service
young call girls in Rajiv Chowk🔝 9953056974 🔝 Delhi escort Service
 
SPICE PARK APR2024 ( 6,793 SPICE Models )
SPICE PARK APR2024 ( 6,793 SPICE Models )SPICE PARK APR2024 ( 6,793 SPICE Models )
SPICE PARK APR2024 ( 6,793 SPICE Models )
 
Study on Air-Water & Water-Water Heat Exchange in a Finned Tube Exchanger
Study on Air-Water & Water-Water Heat Exchange in a Finned Tube ExchangerStudy on Air-Water & Water-Water Heat Exchange in a Finned Tube Exchanger
Study on Air-Water & Water-Water Heat Exchange in a Finned Tube Exchanger
 
Exploring_Network_Security_with_JA3_by_Rakesh Seal.pptx
Exploring_Network_Security_with_JA3_by_Rakesh Seal.pptxExploring_Network_Security_with_JA3_by_Rakesh Seal.pptx
Exploring_Network_Security_with_JA3_by_Rakesh Seal.pptx
 
High Profile Call Girls Nagpur Meera Call 7001035870 Meet With Nagpur Escorts
High Profile Call Girls Nagpur Meera Call 7001035870 Meet With Nagpur EscortsHigh Profile Call Girls Nagpur Meera Call 7001035870 Meet With Nagpur Escorts
High Profile Call Girls Nagpur Meera Call 7001035870 Meet With Nagpur Escorts
 
Introduction to Microprocesso programming and interfacing.pptx
Introduction to Microprocesso programming and interfacing.pptxIntroduction to Microprocesso programming and interfacing.pptx
Introduction to Microprocesso programming and interfacing.pptx
 
9953056974 Call Girls In South Ex, Escorts (Delhi) NCR.pdf
9953056974 Call Girls In South Ex, Escorts (Delhi) NCR.pdf9953056974 Call Girls In South Ex, Escorts (Delhi) NCR.pdf
9953056974 Call Girls In South Ex, Escorts (Delhi) NCR.pdf
 
APPLICATIONS-AC/DC DRIVES-OPERATING CHARACTERISTICS
APPLICATIONS-AC/DC DRIVES-OPERATING CHARACTERISTICSAPPLICATIONS-AC/DC DRIVES-OPERATING CHARACTERISTICS
APPLICATIONS-AC/DC DRIVES-OPERATING CHARACTERISTICS
 
Microscopic Analysis of Ceramic Materials.pptx
Microscopic Analysis of Ceramic Materials.pptxMicroscopic Analysis of Ceramic Materials.pptx
Microscopic Analysis of Ceramic Materials.pptx
 
What are the advantages and disadvantages of membrane structures.pptx
What are the advantages and disadvantages of membrane structures.pptxWhat are the advantages and disadvantages of membrane structures.pptx
What are the advantages and disadvantages of membrane structures.pptx
 
IVE Industry Focused Event - Defence Sector 2024
IVE Industry Focused Event - Defence Sector 2024IVE Industry Focused Event - Defence Sector 2024
IVE Industry Focused Event - Defence Sector 2024
 
🔝9953056974🔝!!-YOUNG call girls in Rajendra Nagar Escort rvice Shot 2000 nigh...
🔝9953056974🔝!!-YOUNG call girls in Rajendra Nagar Escort rvice Shot 2000 nigh...🔝9953056974🔝!!-YOUNG call girls in Rajendra Nagar Escort rvice Shot 2000 nigh...
🔝9953056974🔝!!-YOUNG call girls in Rajendra Nagar Escort rvice Shot 2000 nigh...
 
OSVC_Meta-Data based Simulation Automation to overcome Verification Challenge...
OSVC_Meta-Data based Simulation Automation to overcome Verification Challenge...OSVC_Meta-Data based Simulation Automation to overcome Verification Challenge...
OSVC_Meta-Data based Simulation Automation to overcome Verification Challenge...
 

Machine learning ppt unit one syllabuspptx

  • 2. Course Objectives: The learning objectives of this course are: 1. Familiarity with a set of well-known supervised, unsupervised and semi-supervised learning algorithms. 2. The ability to implement some basic machine learning algorithms. 3. Understanding of how machine learning algorithms are evaluated
  • 3. Course Outcomes: On completion of this course, students can 1. Explain the fundamental usage of the concept Machine Learning system. 2. Demonstrate on various regression Technique. 3. Analyze the Ensemble Learning Methods. 4. Illustrate the Clustering Techniques and Dimensionality Reduction Models in Machine Learning. 5. Discuss the Neural Network Models and Fundamentals concepts of Deep Learning.
  • 4. Text(T) / Reference(R) Books : T1 Hands-On Machine Learning with Scikit-Learn, Keras, and TensorFlow, 2nd Edition, O’Reilly Publications, 2019 T2 Data Science and Machine Learning Mathematical and Statistical Methods,Dirk P. Kroese, Zdravko I. Botev, Thomas Taimre, Radislav Vaisman,25th November 2020 R1 Understanding Machine Learning: From Theory to algorithms, Shai Shalev- Shwartz, Shai Ben-David, Cambridge. R2 Machine Learning Probabilistic Approach, Kevin P. Murphy, MIT Press, 2012 W1 https://www.tutorialspoint.com/what-is-machine-learning W2 https://www.analyticsvidhya.com/machine-learning/ W3 https://www.youtube.com/watch?v=eq7KF7JTinU
  • 5. What is Machine Learning? “Machine learning … gives computers the ability to learn without being explicitly programmed.” Arthur Samuel
  • 6. What is Machine Learning? • Tom Mitchell: Algorithms that • improve their performance 𝑃 • at task 𝑇 • with experience 𝐸 • A well-defined machine learning task is given by 𝑃, 𝑇, 𝐸 “A computer program is said to learn from experience E with respect to some class of tasks T and performance measure P if its performance at tasks in T, as measured by P, improves with experience E.” Tom Mitchell
  • 7. Example: Game Playing • Tom Mitchell: Algorithms that • improve their performance 𝑃 • at task 𝑇 • with experience 𝐸 • 𝑇 = playing Checkers • 𝑃 = win rate against opponents • 𝐸 = playing games against itself
  • 8.
  • 9.
  • 10. Example: Prediction Image:https://www.flickr.com/photos/gsfc/5937 35 199688/ Data from https://nsidc.org/arcticseaicenews/sea-ice-tools/ 9.0 8.0 7.0 6.0 5.0 4.0 3.0 2.0 1.0 0.0 1975 1985 1995 2005 2015 2025 Arctic Sea Ice Extent (millions of sq km) Year NSIDC Index of Arctic Sea Ice in September Photo by NASA Goddard ??
  • 11. Example: Prediction • Tom Mitchell: Algorithms that • improve their performance 𝑃 • at some task 𝑇 • with experience 𝐸 • 𝑇 = predict Arctic sea ice extent • 𝑃 = prediction error (e.g., absolute difference) • 𝐸 = historical data
  • 12. Machine Learning for Prediction Data 𝑍 Machine learning algorithm Model 𝑓 New input Predicted output
  • 13. Example: Prediction 9.0 8.0 7.0 6.0 5.0 4.0 3.0 2.0 1.0 0.0 1975 1985 1995 2005 2015 2025 Arctic Sea Ice Extent (millions of sq km) Year NSIDC Index of Arctic Sea Ice in September Photo by NASA Goddard ?? Image:https://www.flickr.com/photos/gsfc/5937599688/ Data from https://nsidc.org/arcticseaicenews/sea-ice-tools/
  • 14. Types of Learning • Supervised learning • Input: Examples of inputs and outputs • Output: Model that predicts unknown output given a new input • Unsupervised learning • Input: Examples of some data (no “outputs”) • Output: Representation of structure in the data • Reinforcement learning • Input: Sequence of interactions with an environment • Output: Policy that performs a desired task
  • 15. Supervised Learning 1. Cost of house depending on size of the house. 2. Regression and Classification 3. Drop a ball from a height, need to calculate distance travelled
  • 16. Supervised Learning Image:https://www.flickr.com/photos/gsfc/5937 35 899688/ Data from https://nsidc.org/arcticseaicenews/sea-ice-tools/ 9.0 8.0 7.0 6.0 5.0 4.0 3.0 2.0 1.0 0.0 1975 • Given 𝑥1, 𝑦1 , … , 𝑥𝑛, 𝑦𝑛 , learn a function that predicts 𝑦 given 𝑥 • Regression: Labels 𝑦 are real-valued NSIDC Index of Arctic Sea Ice in September 1985 1995 2005 2015 2025 Arctic Sea Ice Extent (millions of sq km) Year Photo by NASA Goddard
  • 17. Supervised Learning • Given 𝑥1, 𝑦1 , … , 𝑥𝑛, 𝑦𝑛 , learn a function that predicts 𝑦 given 𝑥 • Classification: Labels 𝑦 are categories Tumor Size Ocular Tumor (Malignant / Benign) 𝑓(𝑥) Predict Benign Predict Malignant Malignant Benign
  • 18. Supervised Learning • Given 𝑥1, 𝑦1 , … , 𝑥𝑛, 𝑦𝑛 , learn a function that predicts 𝑦 given 𝑥 • Inputs 𝑥 can be multi-dimensional (SVM will do it) Tumor Size Age • Patient age • Clump thickness • Tumor Color • Cell type • …
  • 20. Unsupervised Learning • Given 𝑥1, … , 𝑥𝑛 (no labels), output hidden structure in 𝑥’s • E.g., clustering
  • 22. Explain Cocktail Party Problem Unsupervised Learning
  • 23. Reinforcement Learning • Learn how to perform a task from interactions with the environment • Examples: • Autonomous vehicle • Playing chess (interact with the game) • Robot grasping an object (interact with the object/real world) • Optimize inventory allocations (interact with the inventory system) environment agent
  • 25. 1. Explain Training dog good dog, bad dog 2. Optimum way of a. Earth Movers having two sticks in hand b. Helicopter flying if flies well Reinforcement Learning https://www.youtube.com/watch?v=LfmAG4dk-rU https://www.youtube.com/watch?v=tF4DML7FIWk
  • 26. Applications of Machine Learning 45 1.Cortana, Alexa 2.Traffic prediction 3.Judiciary 4.Medical 5.Every area
  • 28. Radiology and Medicine https://www.nature.com/articles/s41746-020-00376-2 Input: Brain scans Output: Neurological disease labels https://www.nature.com/articles/s41573-019-0024-5
  • 29. Main Challenges of Machine Learning 1. Insufficient Quantity of Training Data : Millions of data is required 2. Nonrepresentative Training Data: Localised output because of trained with localised data 3. Poor-Quality Data: Outliers and missing data 4. Irrelevant Features : Garbage In Garbage Out (our model is “AWESOME” and we feed it with garbage data) 5. Overfitting the Training Data : Low Bias, High Variance (Bias means training set error, Variance means test set error) 6. Underfitting the Training Data : High Bias and High Variance
  • 30.
  • 31.
  • 32.
  • 33. Statistical learning. Structuring and visualizing data are important aspects of data science When the goal is to interpret the model and quantify the uncertainty in the data, this analysis is usually referred to as statistical learning There are two major goals for modeling data: 1) to accurately predict some future quantity of interest, given some observed data, and 2) to discover unusual or interesting patterns in the data.
  • 34. To achieve these goals, one must rely on knowledge from three important pillars of the mathematical science 1. Function approximation:The most natural way to represent the relationship between variables is via a mathematical function or map. Thus, data scientists have to understand how best to approximate and represent functions using the least amount of computer processing and memory. Statistical learning cont.,
  • 35. Statistical learning cont., 2. Optimization:Given a class of mathematical models, we wish to find the best possible model in that class. This step usually requires knowledge of optimization algorithms and efficient computer coding or programming. 3. Probability and statistics: The knowledge of probability and statistics is needed to fit or train algorithm and generate a model.
  • 36.
  • 37.
  • 38.
  • 39.
  • 40.
  • 41.
  • 42.
  • 43.
  • 44.
  • 45. Predictions: In machine learning, predictions are made based on models or algorithms. These predictions are estimations or forecasts of certain outcomes, denoted as "ŷ" (y-hat). Response y: This refers to the actual or observed outcomes that are being predicted. In many cases, this is the ground truth or the real data values corresponding to the situations for which predictions are being made. This is denoted as "y."
  • 46. Loss function: A loss function, also known as a cost function or objective function, is a mathematical function that quantifies the difference between the predicted values (ŷ) and the actual values (y). It essentially measures how well or poorly the model is performing. The goal is to minimize this function. This loss function provides a quantitative measure of the model's performance.
  • 47. Mathematical function g: This refers to a model or an algorithm represented by the mathematical function g(x). In the context of predictions, g(x) would be used to estimate or predict corresponding values y based on given inputs x. Accurate predictions: The term "accurate predictions" implies that the mathematical function should provide outputs that closely match the true outcomes observed in the real world.
  • 48. All possible pairs (x, y) in Nature: Nature is diverse and complex. Vast range of scenarios and data pairs encounter in the natural world. The possibility of finding a single mathematical function that can accurately predict outcomes for every conceivable combination of input and output values.
  • 49. When dealing with complex real-world data, it's common to use a variety of models or a more sophisticated approach, such as machine learning, where the algorithm adapts and learns from the data to make predictions
  • 50. “Even with the same input x, the output y may be different“. Explain Weather forecasting example (location, temperature, humidity, wind speed, and atmospheric pressure) Meteorologists acknowledge that, even with sophisticated models and accurate initial measurements, perfect predictability in weather forecasting is challenging due to the inherent complexity and variability of atmospheric processes.
  • 51. Deterministic and Probabilistic We adopt a probabilistic approach and assume that each pair (x, y) is the outcome of a random pair (X, Y) that has some joint probability density f(x, y). The relationship between the variables x and y is treated as a result of a random process (X,Y).
  • 52. We then assess the predictive performance via the expected loss, usually called the risk for g: ℓ(g) = E Loss(Y, g(X)).
  • 53. Our goal is thus to “learn” the unknown g∗ using the n examples in the training set T. Let us denote this as gT The best approximation for g ∗ that we can construct from T
  • 54.
  • 55. Tower property Let's consider a sequence of random variables X, Y, and Z. The tower property states: E[E[X∣Y,Z]]=E[E[X∣Y]], Tower property says that the expectation of the conditional expectation of X given both Y and Z is equal to the expectation of the conditional expectation of X given only Y.
  • 56. The learner learns the relationship with examples, this type of learning is called supervised learning. In contrast, Unsupervised learning makes no distinction between response and explanatory variables. Objective is simply to learn the structure of the unknown distribution of the data.
  • 57. Debugging a learning algorithm • You have built you awesome linear regression model predicting price • Work perfectly on you testing data Source: Andrew Ng
  • 58. Debugging a learning algorithm • You have built you awesome linear regression model predicting price • Work perfectly on you testing data • Then it fails miserably when you test it on the new data you collected Source: Andrew Ng
  • 59. Debugging a learning algorithm • You have built you awesome linear regression model predicting price • Work perfectly on you testing data • Then it fails miserably when you test it on the new data you collected • What to do now? Source: Andrew Ng
  • 60. Things You Can Try Get more data Try different features Try tuning your hyperparameter
  • 61. Things You Can Try Get more data Try different features Try tuning your hyperparameter But which should I try first?
  • 62. Diagnosing Machine Learning System Figure out what is wrong first Diagnosing your system takes time, but it can save your time as well Ultimate goal: low generalization error
  • 63. Diagnosing Machine Learning System Figure out what is wrong first Diagnosing your system takes time, but it can save your time as well Ultimate goal: low generalization error Source: reddit?
  • 64. Diagnosing Machine Learning System Figure out what is wrong first Diagnosing your system takes time, but it can save your time as well Ultimate goal: low generalization error Source: reddit?
  • 65. Problem: Fail to Generalize Model does not generalize to unseen data Fail to predict things that are not in training sample Pick a model that has lower generalization error
  • 66. Evaluate Your Hypothesis Price ($) Size (ft) Price ($) Size (ft) Price ($) Size (ft) Source: Andrew Ng
  • 67. Evaluate Your Hypothesis Price ($) Size (ft) Price ($) Size (ft) Price ($) Size (ft) Underfit Overfit Just right Source: Andrew Ng
  • 68. Evaluate Your Hypothesis Price ($) Size (ft) Price ($) Size (ft) Price ($) Size (ft) Underfit Overfit Just right What if the feature dimension is too high? Source: Andrew Ng
  • 69. Model Selection Model does not generalize to unseen data Fail to predict things that are not in training sample Pick a model that has lower generalization error
  • 70. Model Selection Model does not generalize to unseen data Fail to predict things that are not in training sample Pick a model that has lower generalization error How to evaluate generalization error?
  • 71. Model Selection Model does not generalize to unseen data Fail to predict things that are not in training sample Pick a model that has lower generalization error How to evaluate generalization error? Split your data into train, validation, and test set. Use test set error as an estimator of generalization error
  • 73. Model Selection Training error Validation error Test error Procedure: Step 1. Train on training set Step 2. Evaluate validation error Step 3. Pick the best model based on Step 2. Step 4. Evaluate the test error
  • 74. Bias/Variance Trade-off Price ($) Size (ft) Price ($) Size (ft) Price ($) Size (ft) Underfit Overfit Just right Source: Andrew Ng
  • 75. Bias/Variance Trade-off Price ($) Size (ft) Price ($) Size (ft) Price ($) Size (ft) Underfit High bias Overfit High Variance Just right Source: Andrew Ng
  • 76. Bias/Variance Trade-off Price ($) Size (ft) Price ($) Size (ft) Price ($) Size (ft) Underfit High bias Too simple Overfit High Variance Too Complex Just right Source: Andrew Ng
  • 77. Linear Regression with Regularization Price ($) Size (ft) Price ($) Size (ft) Price ($) Size (ft) Underfit High bias Too simple Too much regularization Overfit High Variance Too Complex Too little regularization Just right Source: Andrew Ng
  • 78. Bias / Variance Trade-off Training error Cross-validation error Loss Degree of Polynomial Source: Andrew Ng
  • 79. Bias / Variance Trade-off Training error Cross-validation error Loss Degree of Polynomial High bias High Variance
  • 80. Problem: Fail to Generalize Should we get more data?
  • 81. Problem: Fail to Generalize Should we get more data? Getting more data does not always help
  • 82. Problem: Fail to Generalize Should we get more data? Getting more data does not always help How do we know if we should collect more data?
  • 87. Learning Curve Underfit High bias Does adding more data help? Price ($) Size (ft)
  • 88. Learning Curve Underfit High bias Does adding more data help? Price ($) Size (ft)
  • 89. Learning Curve Does adding more data help? Price ($) Size (ft) Price ($) Size (ft) More data doesn't help when your model has high bias
  • 90. Learning Curve Does adding more data help? Overfit High Variance Price ($) Size (ft)
  • 91. Learning Curve Does adding more data help? Overfit High Variance Price ($) Size (ft)
  • 92. Learning Curve Does adding more data help? More data is likely to help when your model has high variance Price ($) Size (ft) Price ($) Size (ft)
  • 93. Things You Can Try Get more data When you have high variance Try different features Adding feature helps fix high bias Using smaller sets of feature fix high variance Try tuning your hyperparameter Decrease regularization when bias is high Increase regularization when variance is high