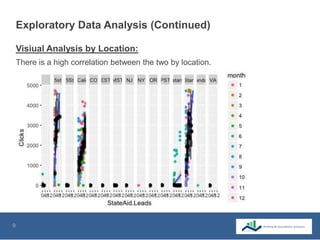
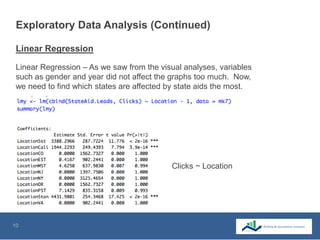
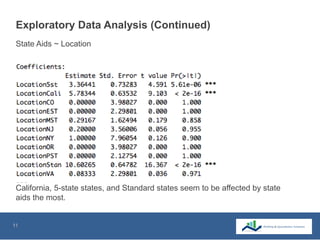
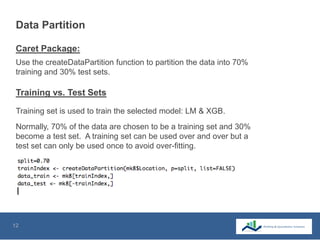
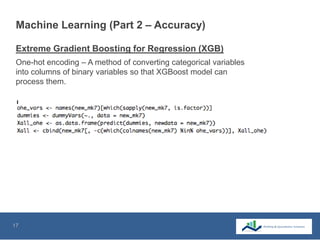
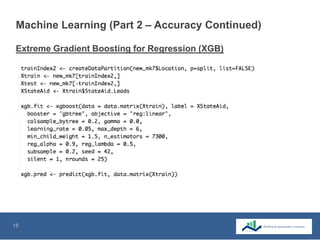
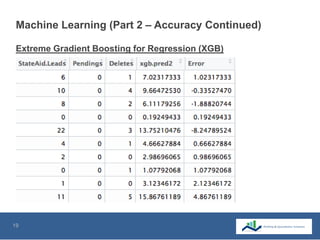
QUALITY • ANALYTICS • PERFORMANCE
Machine Learning At Work
QUALITY • ANALYTICS • PERFORMANCE
December 6, 2017
Prepared for Data Science Event
2
Introduction
The Stealth Media – Media Advertisement Startup Agency on
Facebook
Clients – 1800Dentist, FIJI Water, FabFitFun, Wonderful Company,
and etc
Role at the company – Data Analyst & Jack-of-all-trades
Banking & Quantitative Solutions LLC – Founder/Data Scientist of a
Data Analytics Startup
Main Project – Building AI machines and Recommendation
systems
Current Company:
Previous Company:
3
Definitions & The Objective
How to reduce state aids when maximizing clicks that lead to
conversions?
Is there a correlation between clicks and state aids?
If there is a correlation between the two, what can we do to
optimize the situation?
Clicks – a number of times that a user clicks on a specific facebook
advertisement.
State Aids – a number that shows a given conversion received an
aid from the State where the conversion occurred.
Conversion – a number of purchase
The Objective for this client:
Definitions:
4
Collecting & Compiling Data
Each element of data contains year, month, and day information
besides media information so data can easily be organized,
compiled, or downloaded by year, month, or day.
For the purpose of this presentation, a portion of data was
extracted from the database in csv form.
Data is collected from multiple sources: Facebook and 3rd party
pixel recording softwares.
Once Data iscollected from multiple sources, it is uploaded in our
database (MySql).
Collection:
Compilation:
5
Tidying Data
In a simple phrase, data preprocessing means data cleansing and
normalizing so that it can produce an accurate analysis.
Preprocessing:
Example Coding:
6
Tidying Data (Continued)
Example Coding:
7
Exploratory Data Analysis
There is a moderate to high correlation between the two by year.
Visiual Analysis by Year:
8
Exploratory Data Analysis (Continued)
There is a high correlation between the two by gender.
Visiual Analysis by Gender:
9
Exploratory Data Analysis (Continued)
There is a high correlation between the two by location.
Visiual Analysis by Location:
10
Exploratory Data Analysis (Continued)
Linear Regression – As we saw from the visual analyses, variables
such as gender and year did not affect the graphs too much. Now,
we need to find which states are affected by state aids the most.
Linear Regression
Clicks ~ Location
11
Exploratory Data Analysis (Continued)
California, 5-state states, and Standard states seem to be affected by state
aids the most.
State Aids ~ Location
12
Data Partition
Training set is used to train the selected model: LM & XGB.
Normally, 70% of the data are chosen to be a training set and 30%
become a test set. A training set can be used over and over but a
test set can only be used once to avoid over-fitting.
Use the createDataPartition function to partition the data into 70%
training and 30% test sets.
Caret Package:
Training vs. Test Sets
13
Definitions
Regression – Output variable takes continuous values
Classification – Output variable takes class labels
Supervised Learning – All data is labeled and algorithms are used
to predict the output from the input data.
Unsupervised Learning – All data is not labeled and algorithms are
used to learn inherent structure from the input data.
Supervised vs. Unsupervised Learnings
Regression vs. Classification
14
Machine Learning Chart
15
Machine Learning (Part 1 – Speed)
You delete more features as you train the model. The accuracy should
increase when the test set is fed into the trained model.
The last column shows the
predicted values.
16
Machine Learning (Part 1 – Speed Continued)
The linear regression is very quick to calculate however it seems that its
accuracy is not that great.
17
Machine Learning (Part 2 – Accuracy)
One-hot encoding – A method of converting categorical variables
into columns of binary variables so that XGBoost model can
process them.
Extreme Gradient Boosting for Regression (XGB)
18
Machine Learning (Part 2 – Accuracy Continued)
Extreme Gradient Boosting for Regression (XGB)
19
Machine Learning (Part 2 – Accuracy Continued)
Extreme Gradient Boosting for Regression (XGB)
20
Outcome & Conclusion
We shut down some of the high performing ads in each of those 3
regions as soon as we got an alert from our AI machine and
focused on other regions. It greatly limited the state aid reception
by the client and optimized the state aid and click ratio.
What the machine learning did:
This did not necessarily increase our profit but it definitely
prolonged our contract with the company that we worked with as
their pure sales went up.
Thank You!

Practical Machine Learning at Work

  • 1.
    QUALITY • ANALYTICS• PERFORMANCE Machine Learning At Work QUALITY • ANALYTICS • PERFORMANCE December 6, 2017 Prepared for Data Science Event
  • 2.
    2 Introduction The Stealth Media– Media Advertisement Startup Agency on Facebook Clients – 1800Dentist, FIJI Water, FabFitFun, Wonderful Company, and etc Role at the company – Data Analyst & Jack-of-all-trades Banking & Quantitative Solutions LLC – Founder/Data Scientist of a Data Analytics Startup Main Project – Building AI machines and Recommendation systems Current Company: Previous Company:
  • 3.
    3 Definitions & TheObjective How to reduce state aids when maximizing clicks that lead to conversions? Is there a correlation between clicks and state aids? If there is a correlation between the two, what can we do to optimize the situation? Clicks – a number of times that a user clicks on a specific facebook advertisement. State Aids – a number that shows a given conversion received an aid from the State where the conversion occurred. Conversion – a number of purchase The Objective for this client: Definitions:
  • 4.
    4 Collecting & CompilingData Each element of data contains year, month, and day information besides media information so data can easily be organized, compiled, or downloaded by year, month, or day. For the purpose of this presentation, a portion of data was extracted from the database in csv form. Data is collected from multiple sources: Facebook and 3rd party pixel recording softwares. Once Data iscollected from multiple sources, it is uploaded in our database (MySql). Collection: Compilation:
  • 5.
    5 Tidying Data In asimple phrase, data preprocessing means data cleansing and normalizing so that it can produce an accurate analysis. Preprocessing: Example Coding:
  • 6.
  • 7.
    7 Exploratory Data Analysis Thereis a moderate to high correlation between the two by year. Visiual Analysis by Year:
  • 8.
    8 Exploratory Data Analysis(Continued) There is a high correlation between the two by gender. Visiual Analysis by Gender:
  • 9.
    9 Exploratory Data Analysis(Continued) There is a high correlation between the two by location. Visiual Analysis by Location:
  • 10.
    10 Exploratory Data Analysis(Continued) Linear Regression – As we saw from the visual analyses, variables such as gender and year did not affect the graphs too much. Now, we need to find which states are affected by state aids the most. Linear Regression Clicks ~ Location
  • 11.
    11 Exploratory Data Analysis(Continued) California, 5-state states, and Standard states seem to be affected by state aids the most. State Aids ~ Location
  • 12.
    12 Data Partition Training setis used to train the selected model: LM & XGB. Normally, 70% of the data are chosen to be a training set and 30% become a test set. A training set can be used over and over but a test set can only be used once to avoid over-fitting. Use the createDataPartition function to partition the data into 70% training and 30% test sets. Caret Package: Training vs. Test Sets
  • 13.
    13 Definitions Regression – Outputvariable takes continuous values Classification – Output variable takes class labels Supervised Learning – All data is labeled and algorithms are used to predict the output from the input data. Unsupervised Learning – All data is not labeled and algorithms are used to learn inherent structure from the input data. Supervised vs. Unsupervised Learnings Regression vs. Classification
  • 14.
  • 15.
    15 Machine Learning (Part1 – Speed) You delete more features as you train the model. The accuracy should increase when the test set is fed into the trained model. The last column shows the predicted values.
  • 16.
    16 Machine Learning (Part1 – Speed Continued) The linear regression is very quick to calculate however it seems that its accuracy is not that great.
  • 17.
    17 Machine Learning (Part2 – Accuracy) One-hot encoding – A method of converting categorical variables into columns of binary variables so that XGBoost model can process them. Extreme Gradient Boosting for Regression (XGB)
  • 18.
    18 Machine Learning (Part2 – Accuracy Continued) Extreme Gradient Boosting for Regression (XGB)
  • 19.
    19 Machine Learning (Part2 – Accuracy Continued) Extreme Gradient Boosting for Regression (XGB)
  • 20.
    20 Outcome & Conclusion Weshut down some of the high performing ads in each of those 3 regions as soon as we got an alert from our AI machine and focused on other regions. It greatly limited the state aid reception by the client and optimized the state aid and click ratio. What the machine learning did: This did not necessarily increase our profit but it definitely prolonged our contract with the company that we worked with as their pure sales went up.
  • 21.