Downloaded 203 times
![30
7. The higher the frequency of a wave,
a. the lowerits speed c. the greater its amplitude
b. the shorter its wavelength d. the longer its period
8. Of the following properties of a wave, the one that is independent of the others is its
a. amplitude c. wavelength
b. wave speed d. frequency
9. Waves in a lake are 5.00 m in length and pass an anchored boat 1.25 s apart. The speed of the waves is
a. 0.25 m/s
b. 4.00 m/s
c. 6.25 m/s
d. impossible to find from the information given
10. Energy from the sun reaches the earth through
a. ultraviolet waves
b. infrared waves
c. mechanical waves
d. electromagnetic waves
References and Web Links
Anatomy of an electromagnetic wave. Available at: http://missionscience.nasa.gov/ems/02_anatomy.html
Electromagnetic waves. Available at: http://www.colorado.edu/physics/2000/waves_particles/
[3] Hewitt, P. (2006). Conceptual Physics 10th Ed. USA: Pearson Addison-Wesley.
The anatomy of a wave. Available at: http://www.physicsclassroom.com/class/waves/u10l2a.cfm
The nature of a wave. Available at: http://www.physicsclassroom.com/class/waves/u10l1c.cfm](https://image.slidesharecdn.com/q3-q4learnersmodulev1-141029005025-conversion-gate01/75/Learners-Module-Quarter-3-and-4-Grade-7-30-2048.jpg)


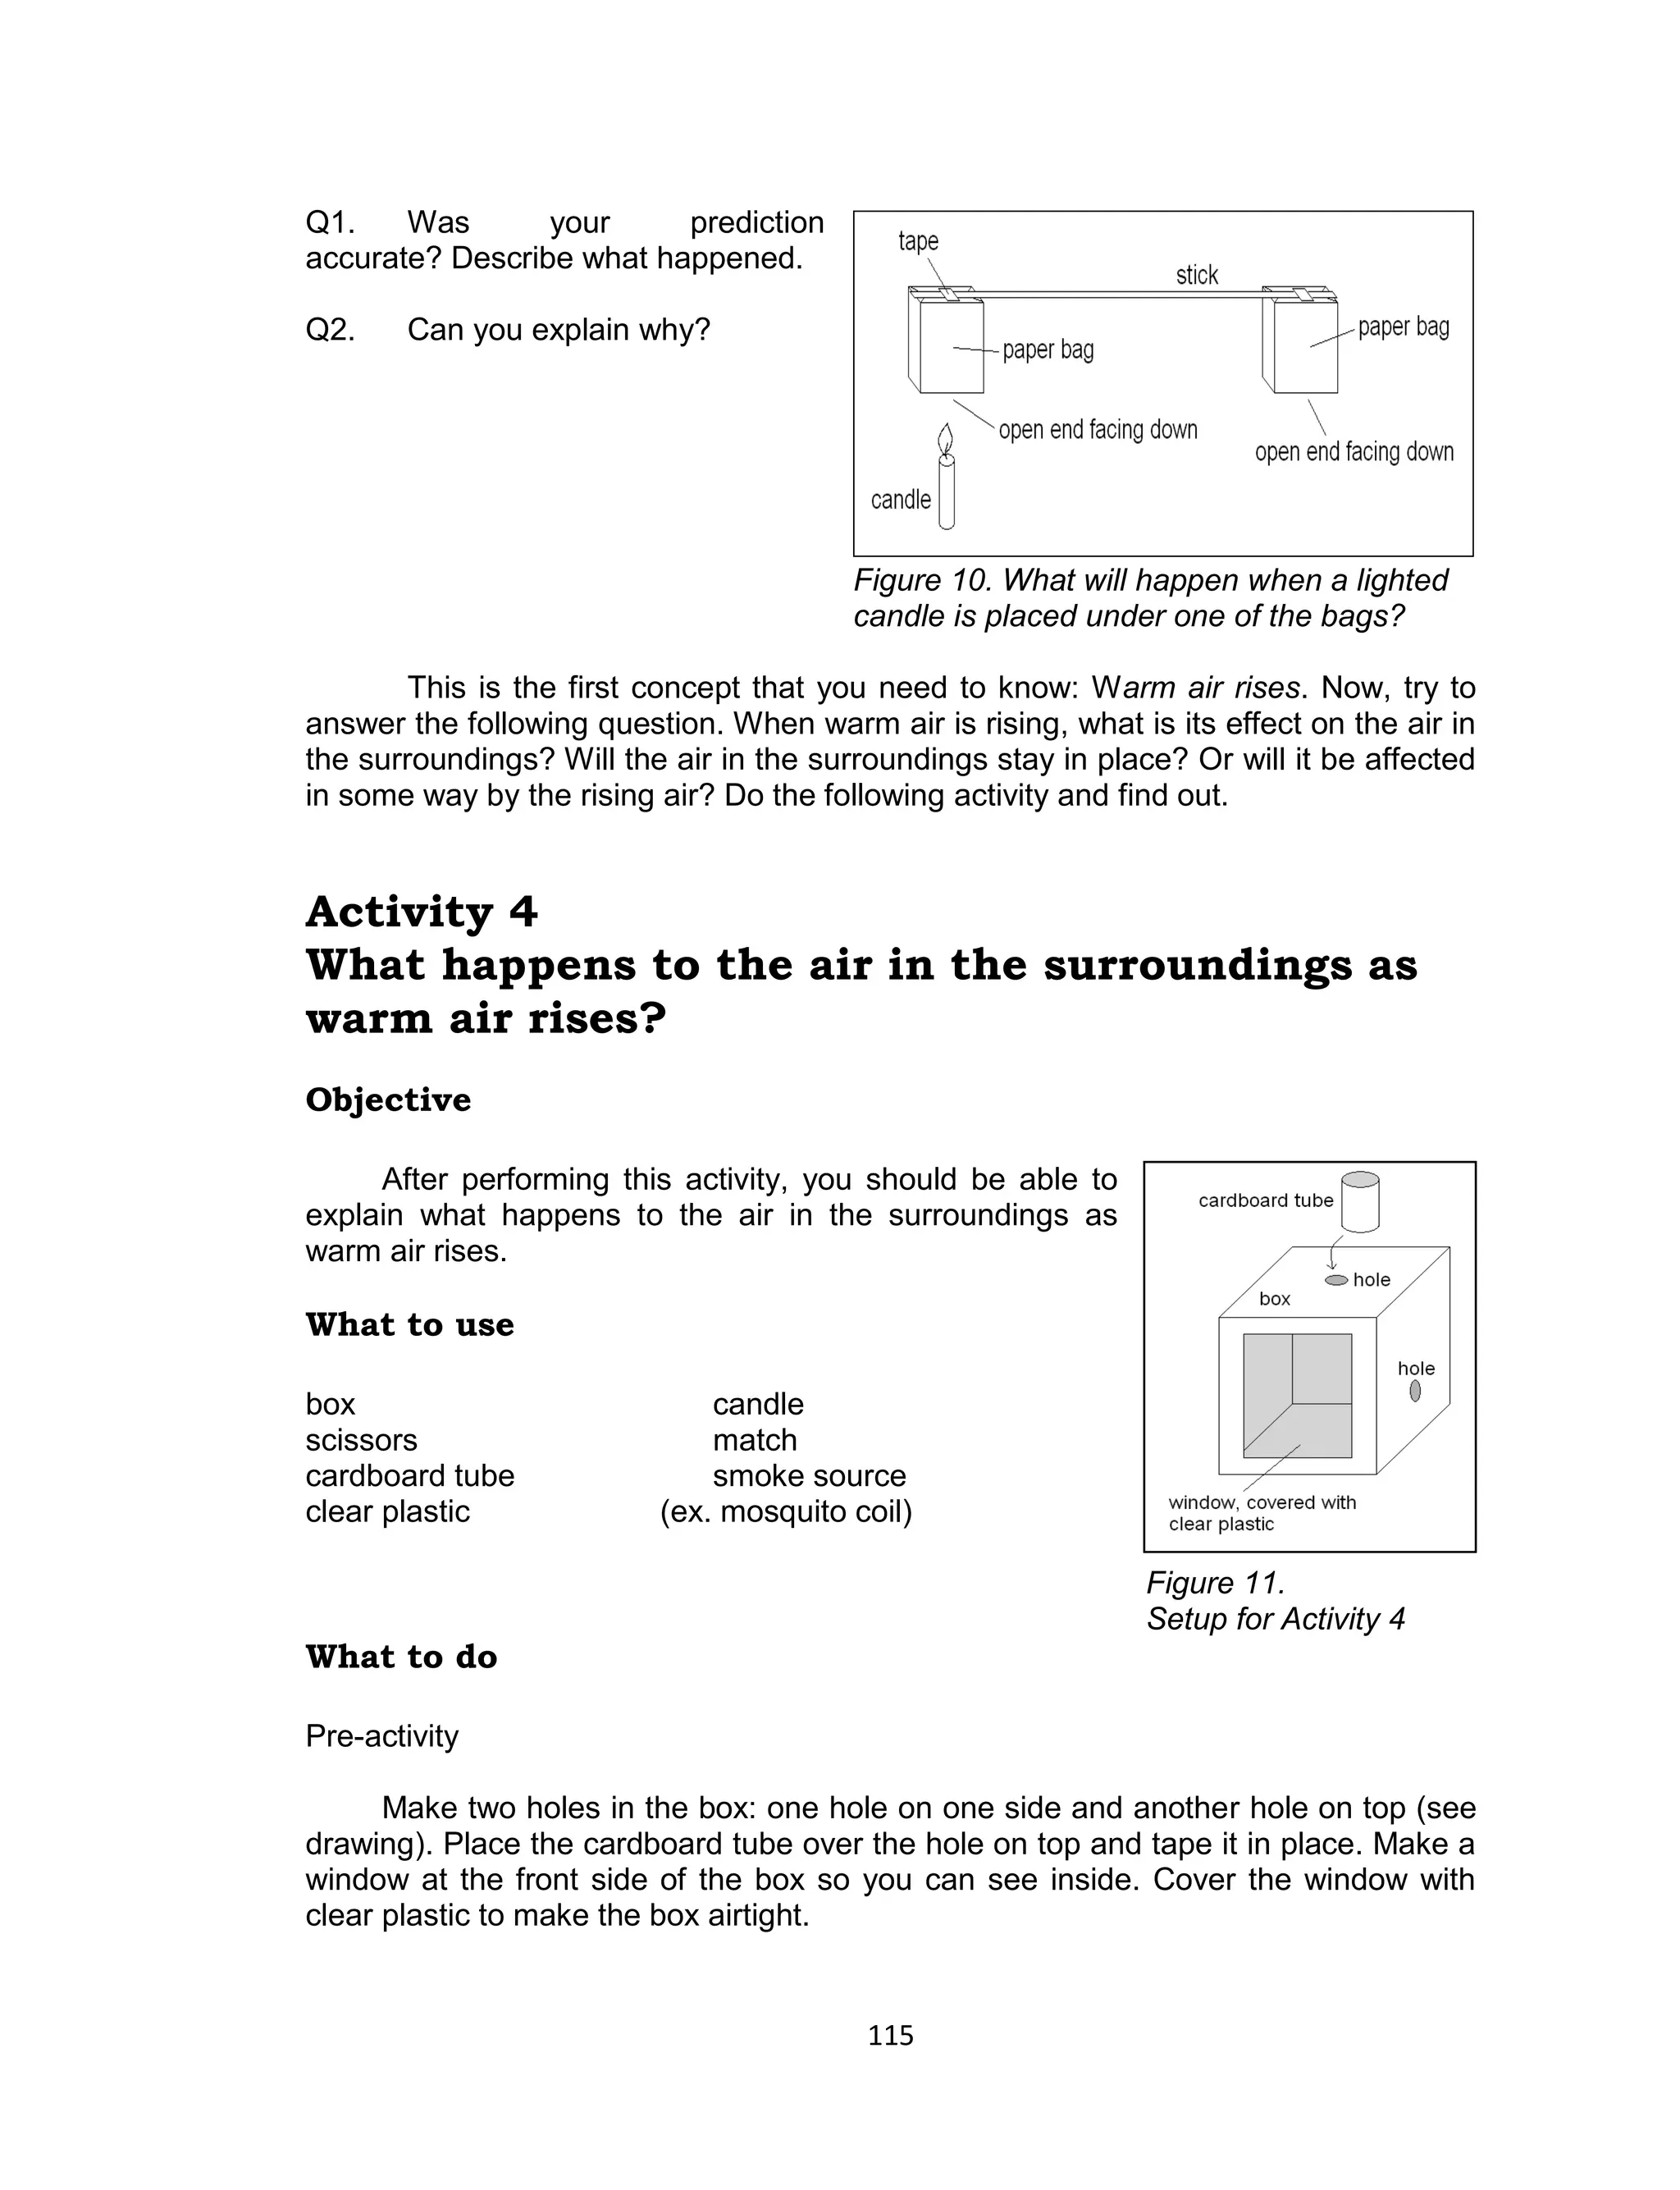

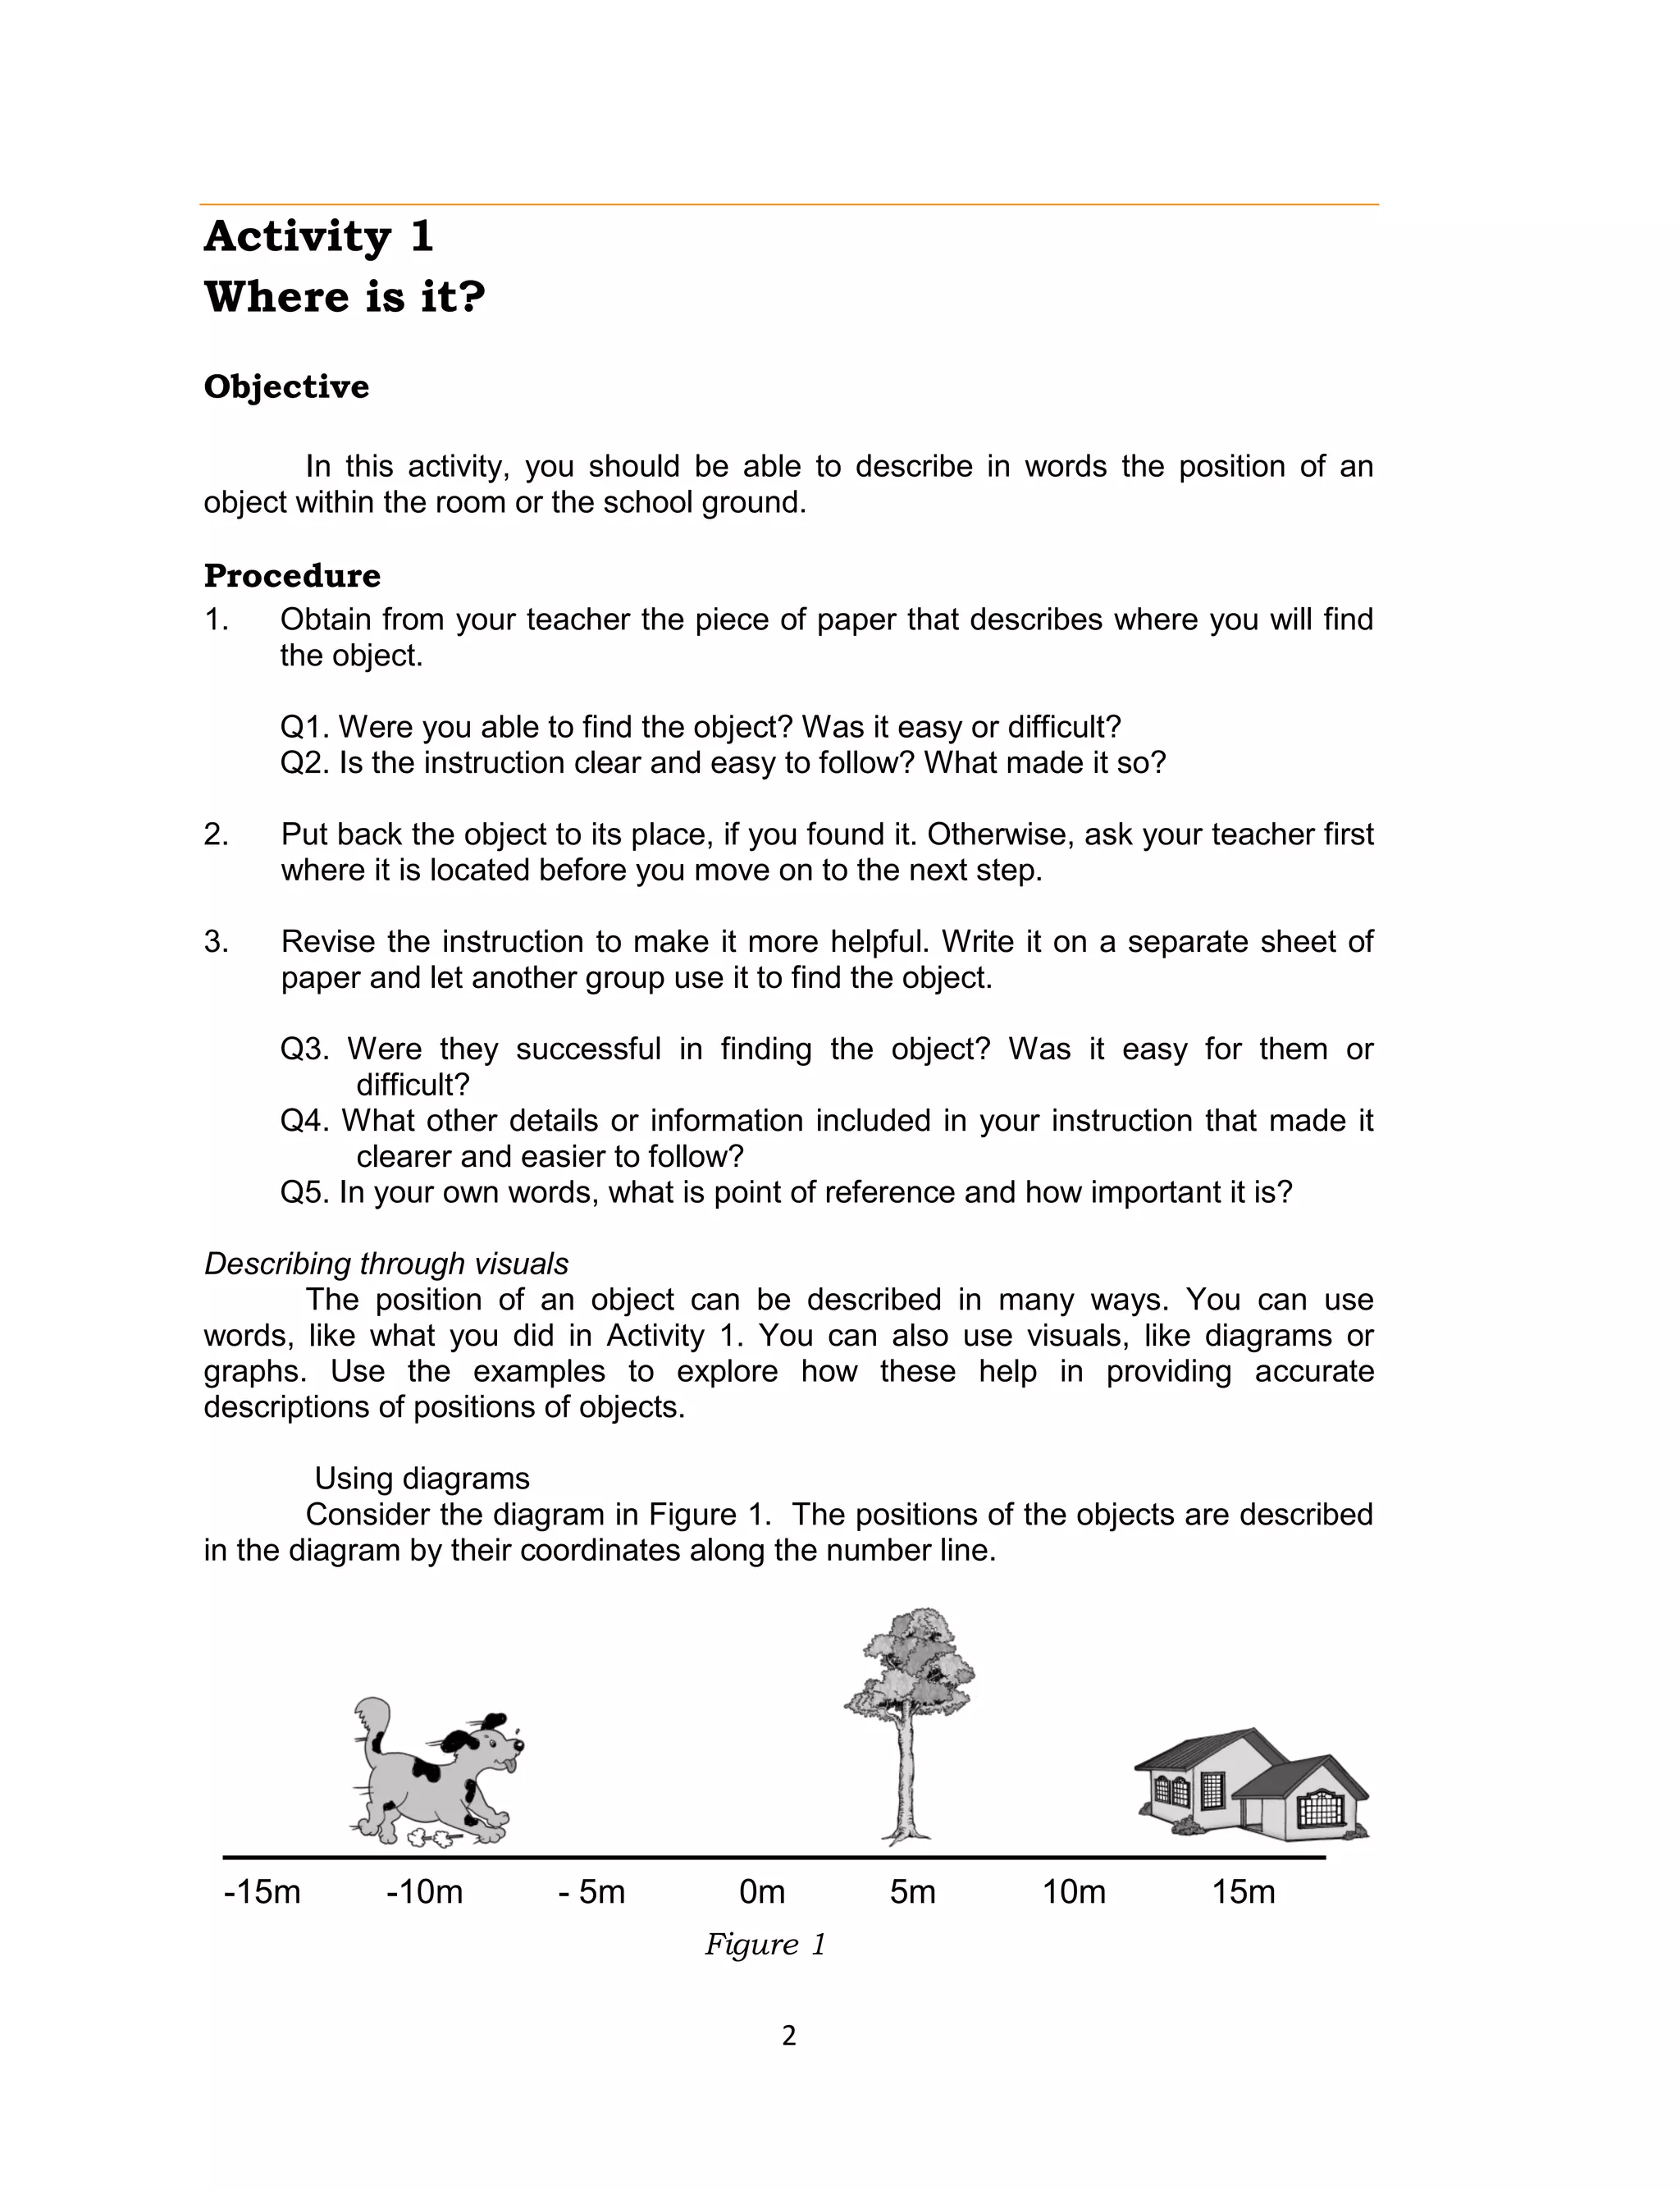
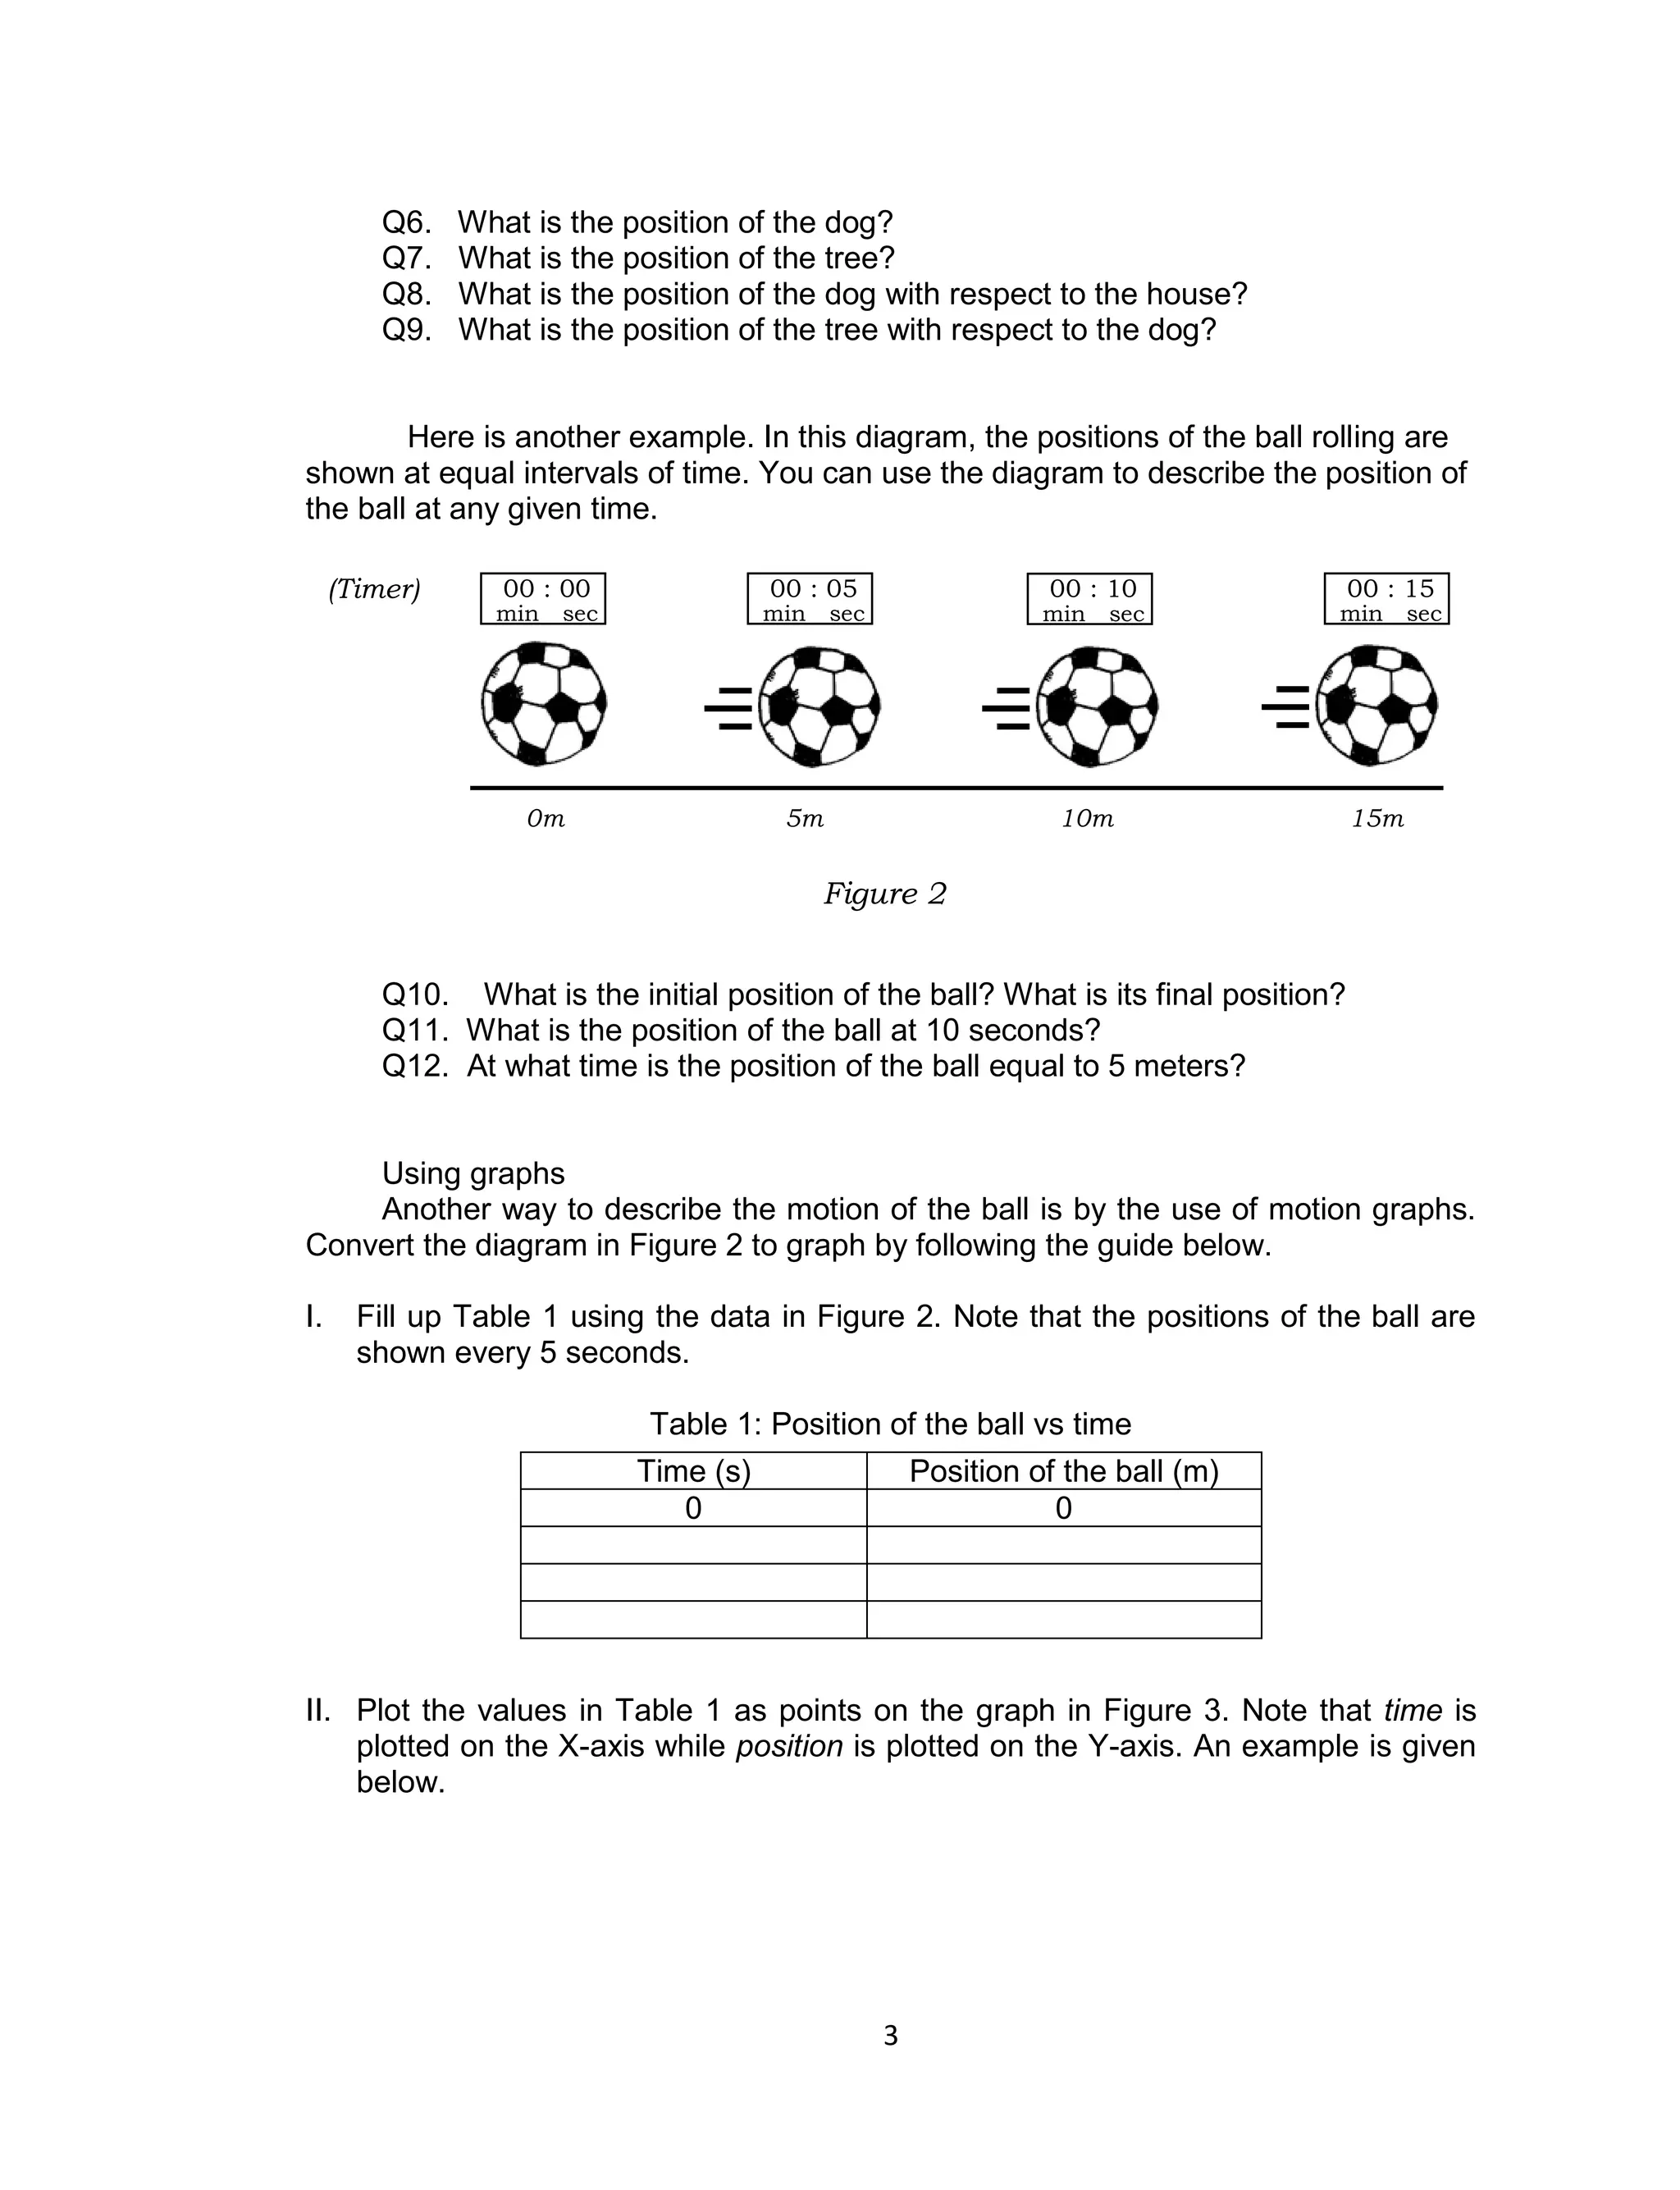
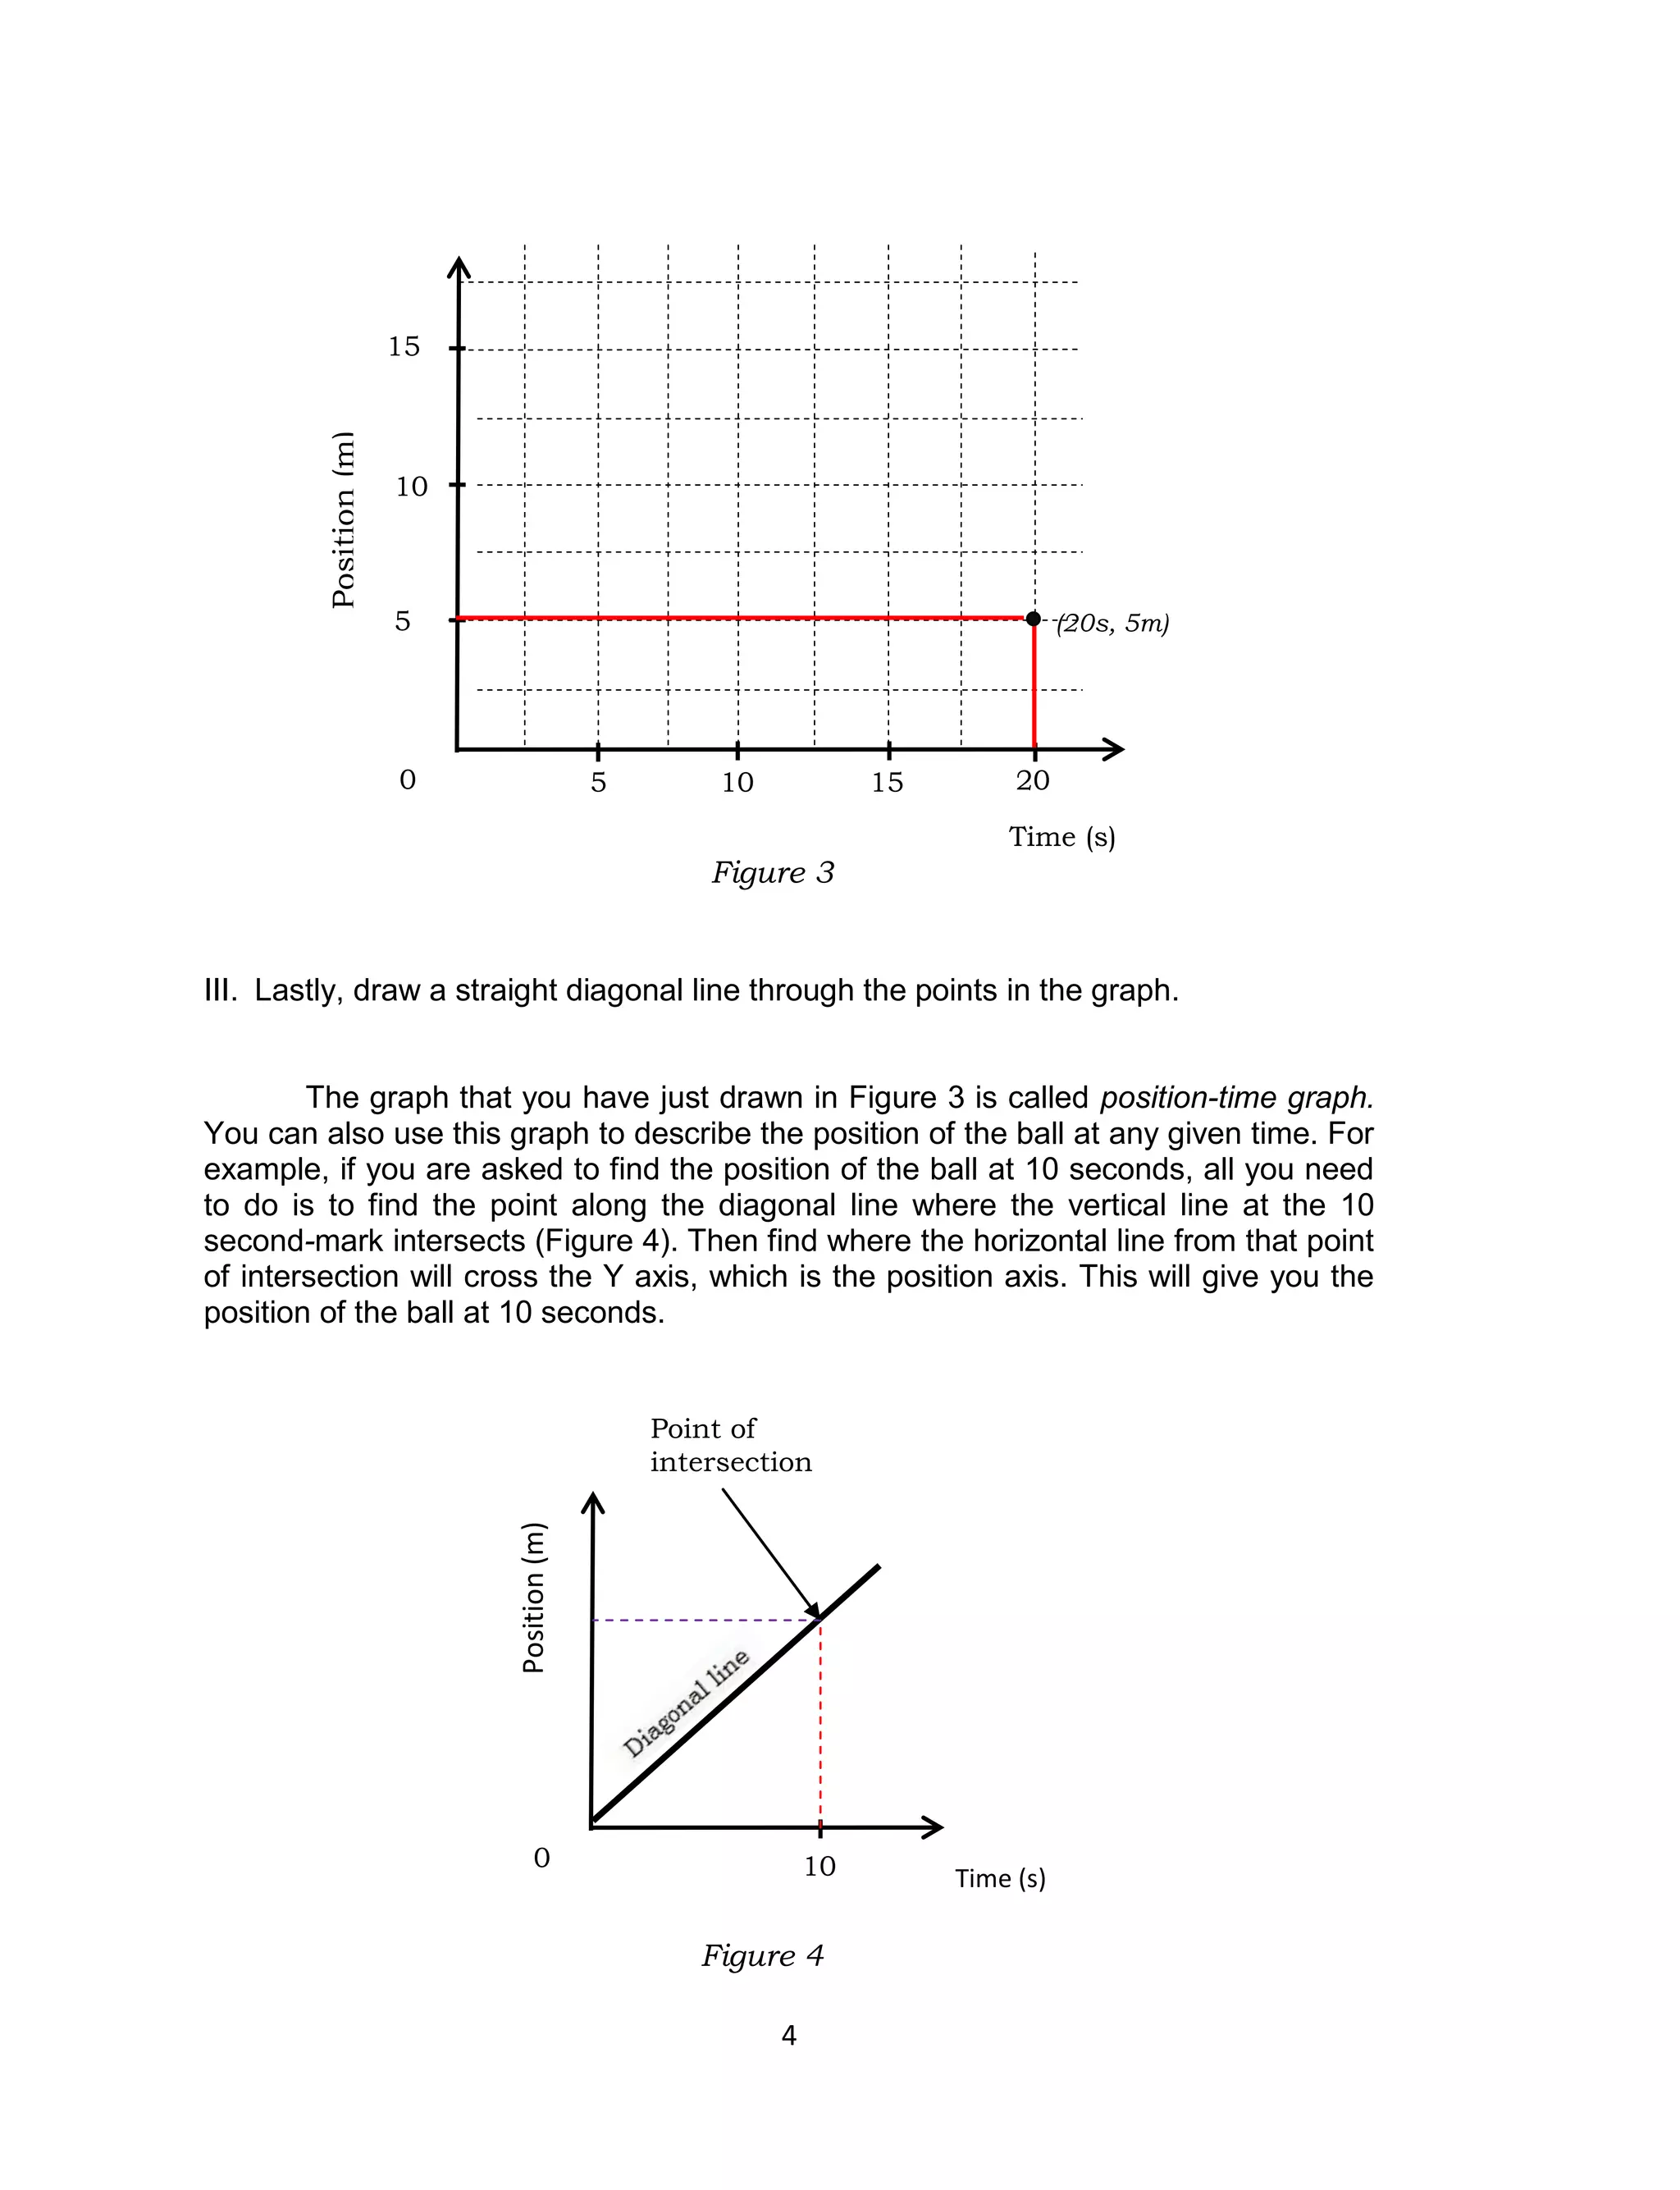
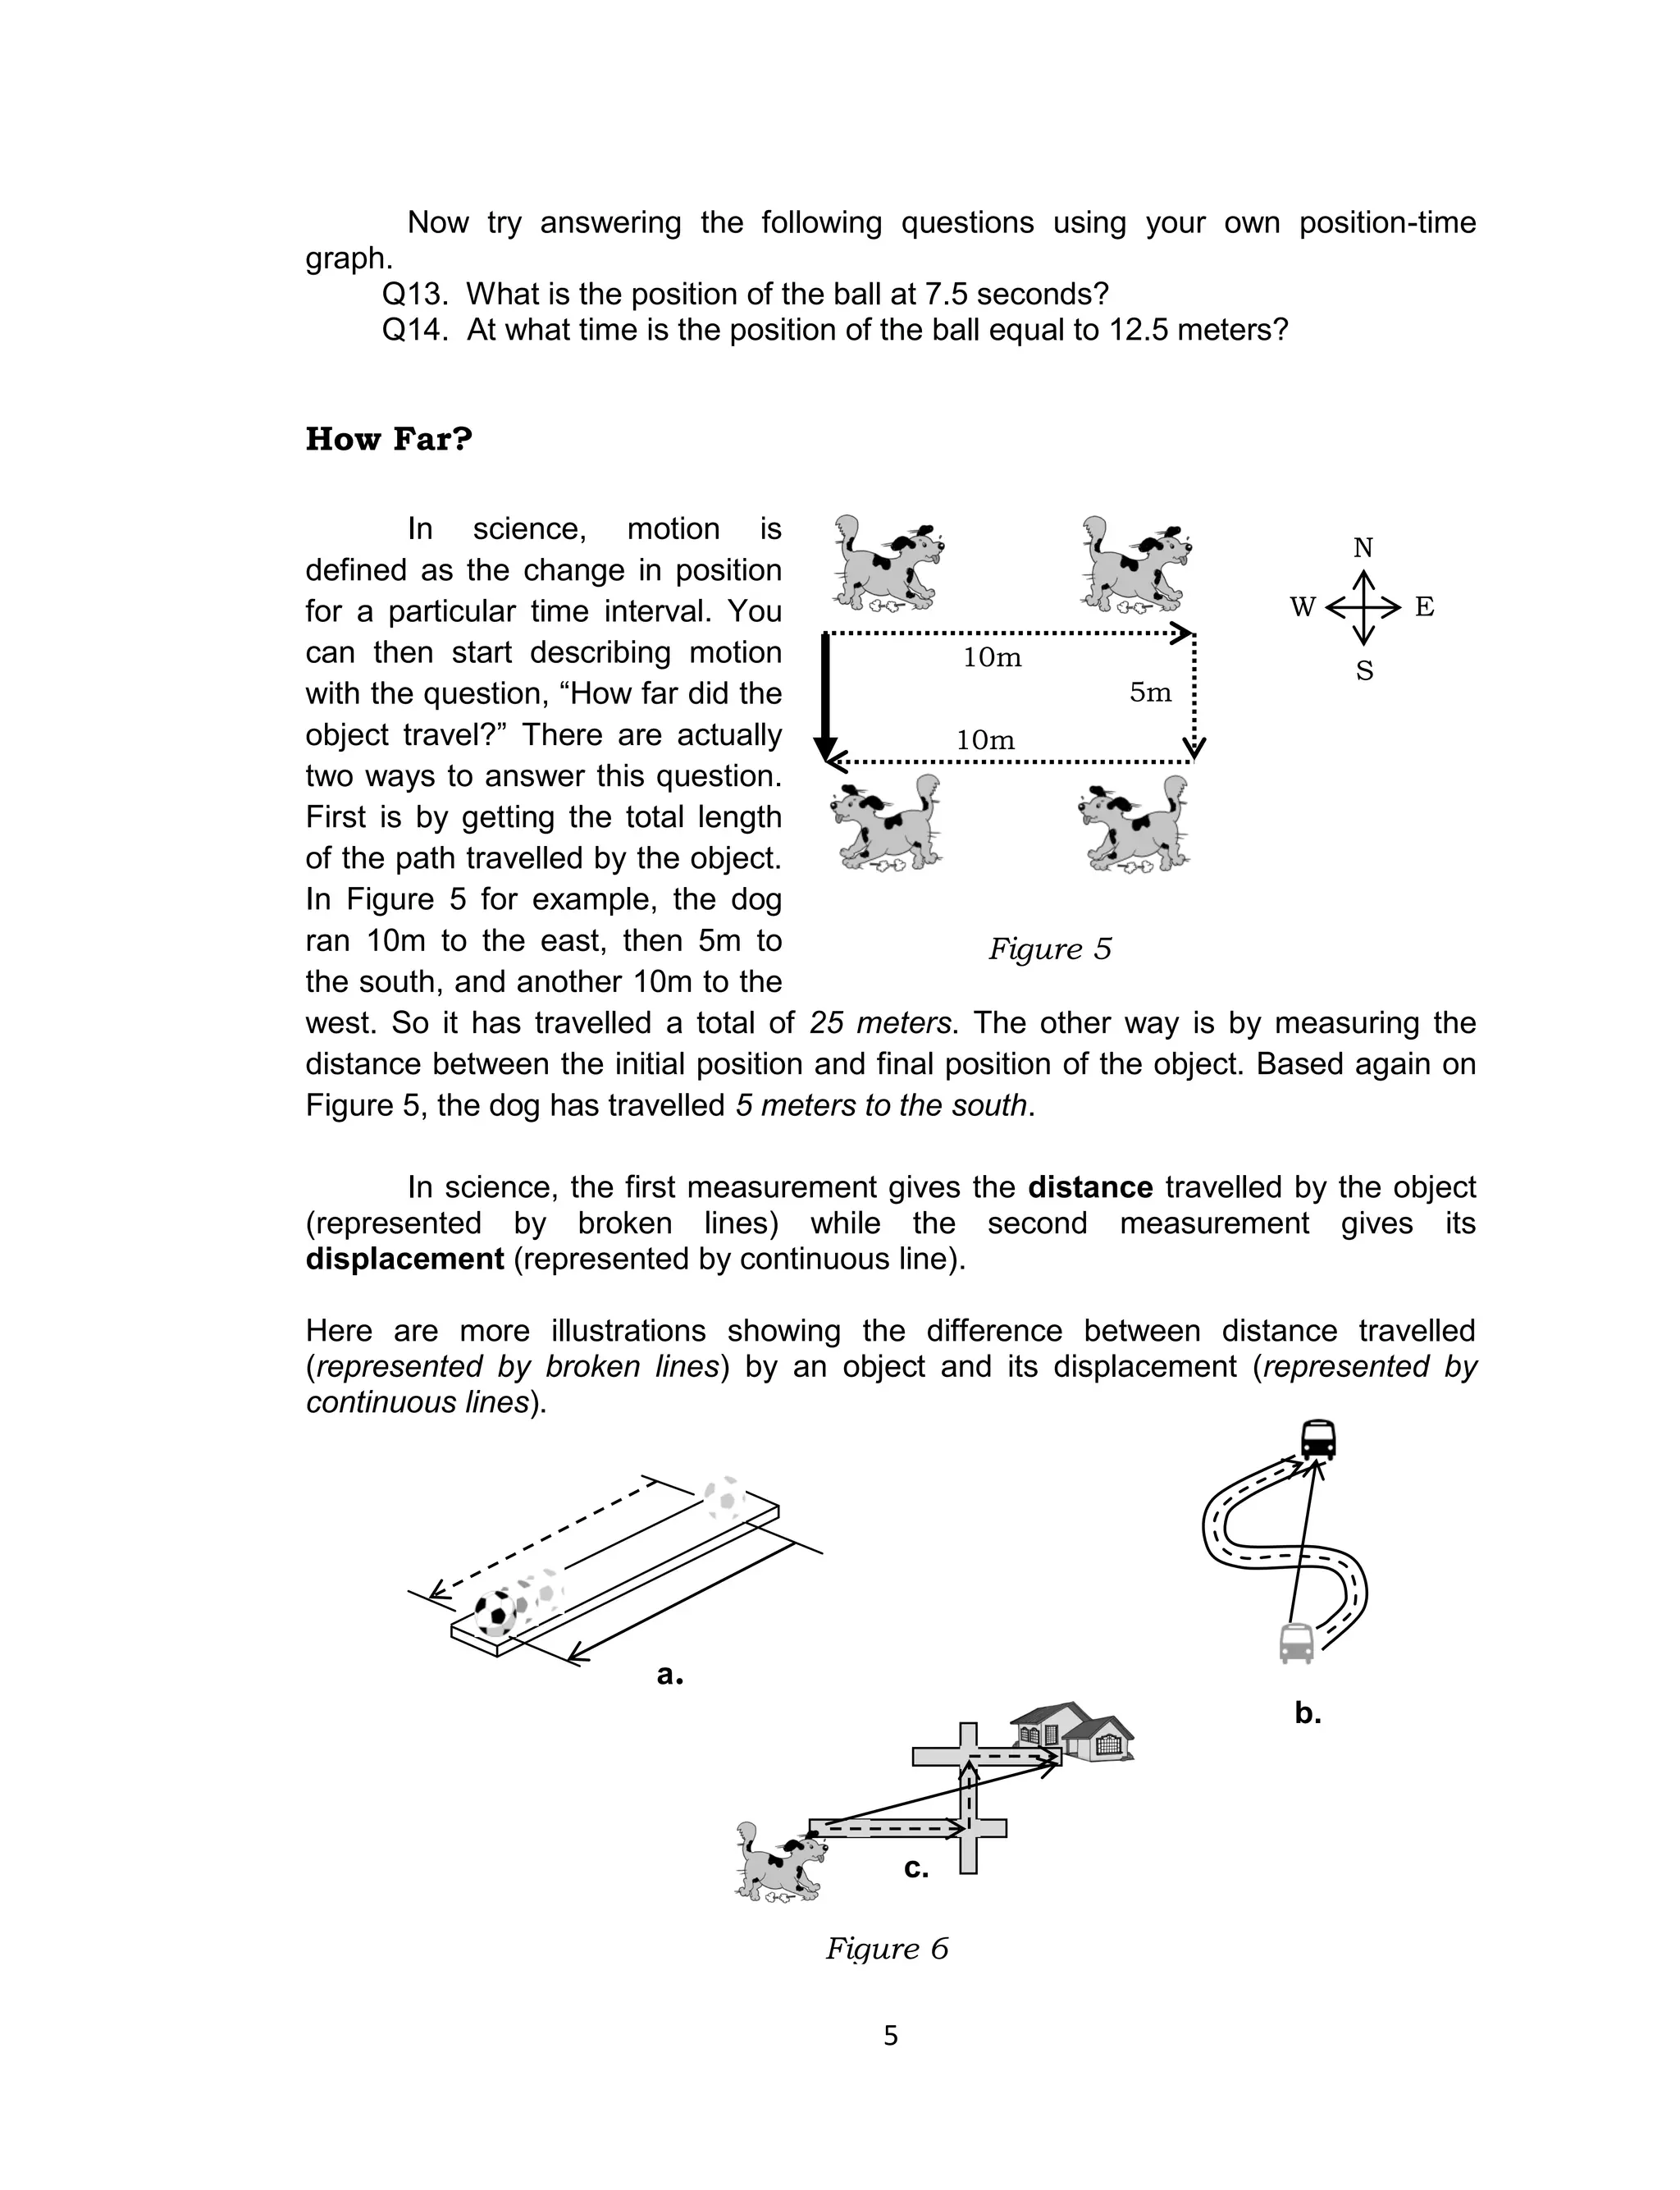
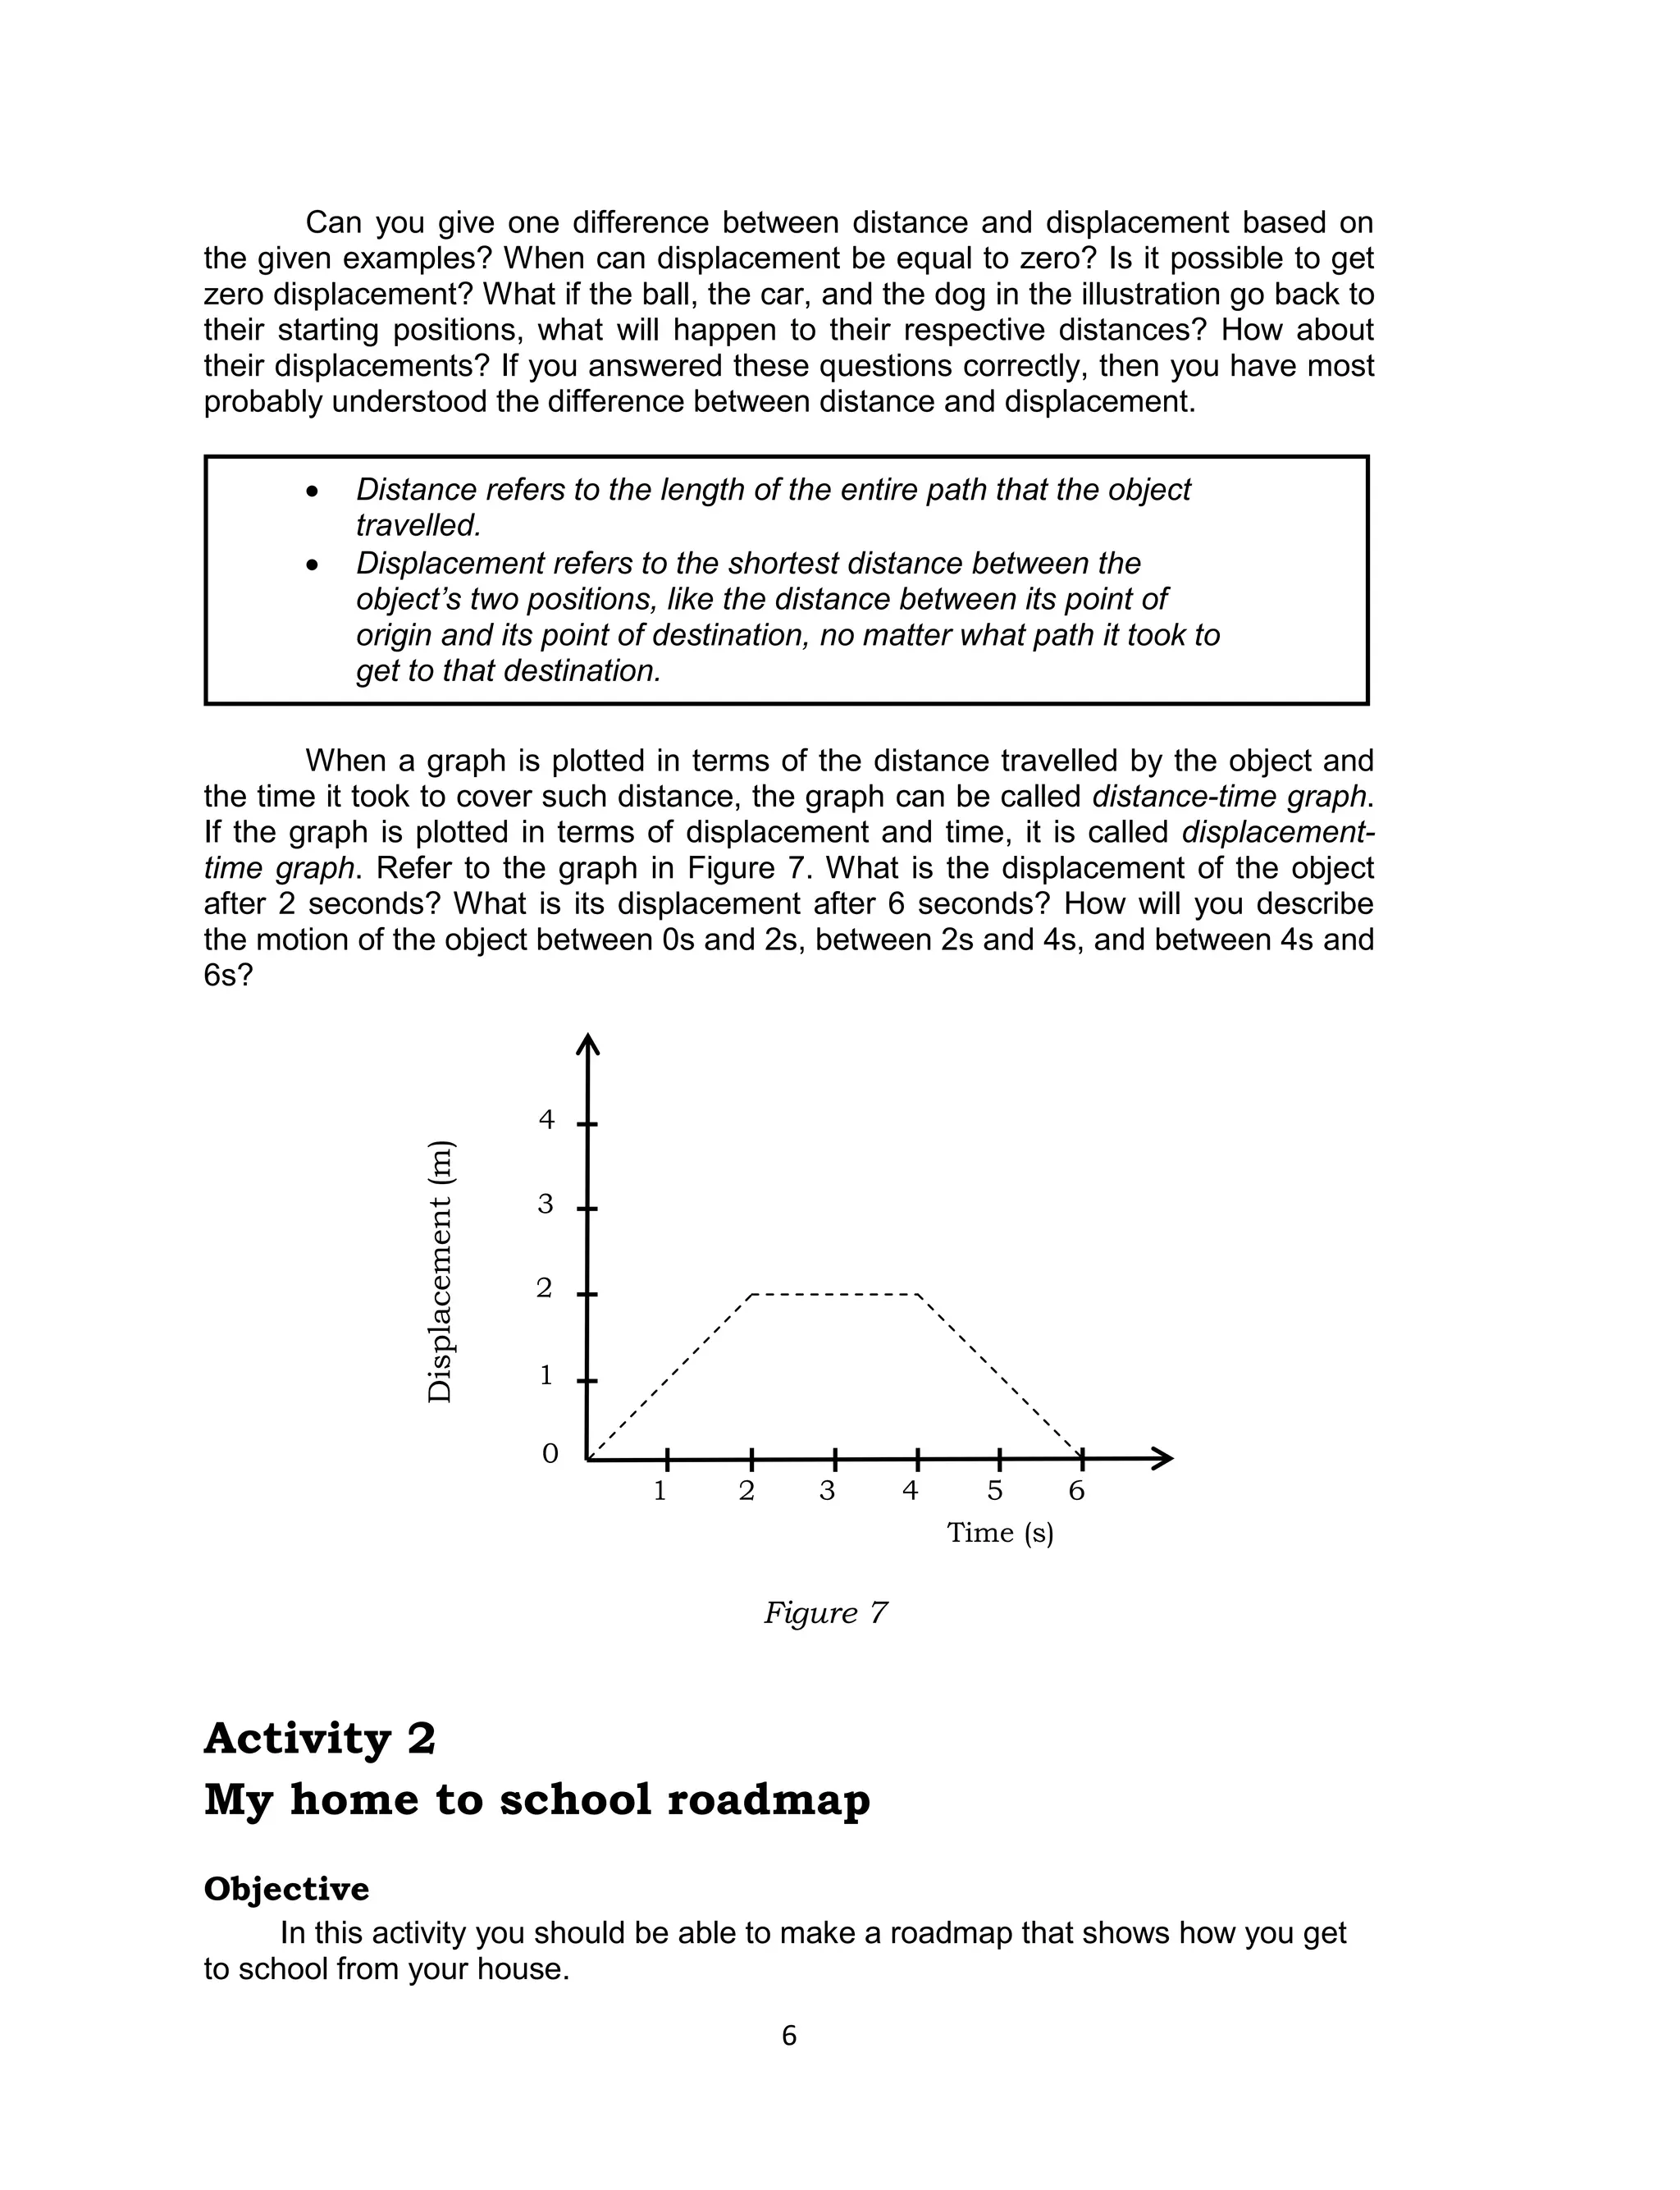
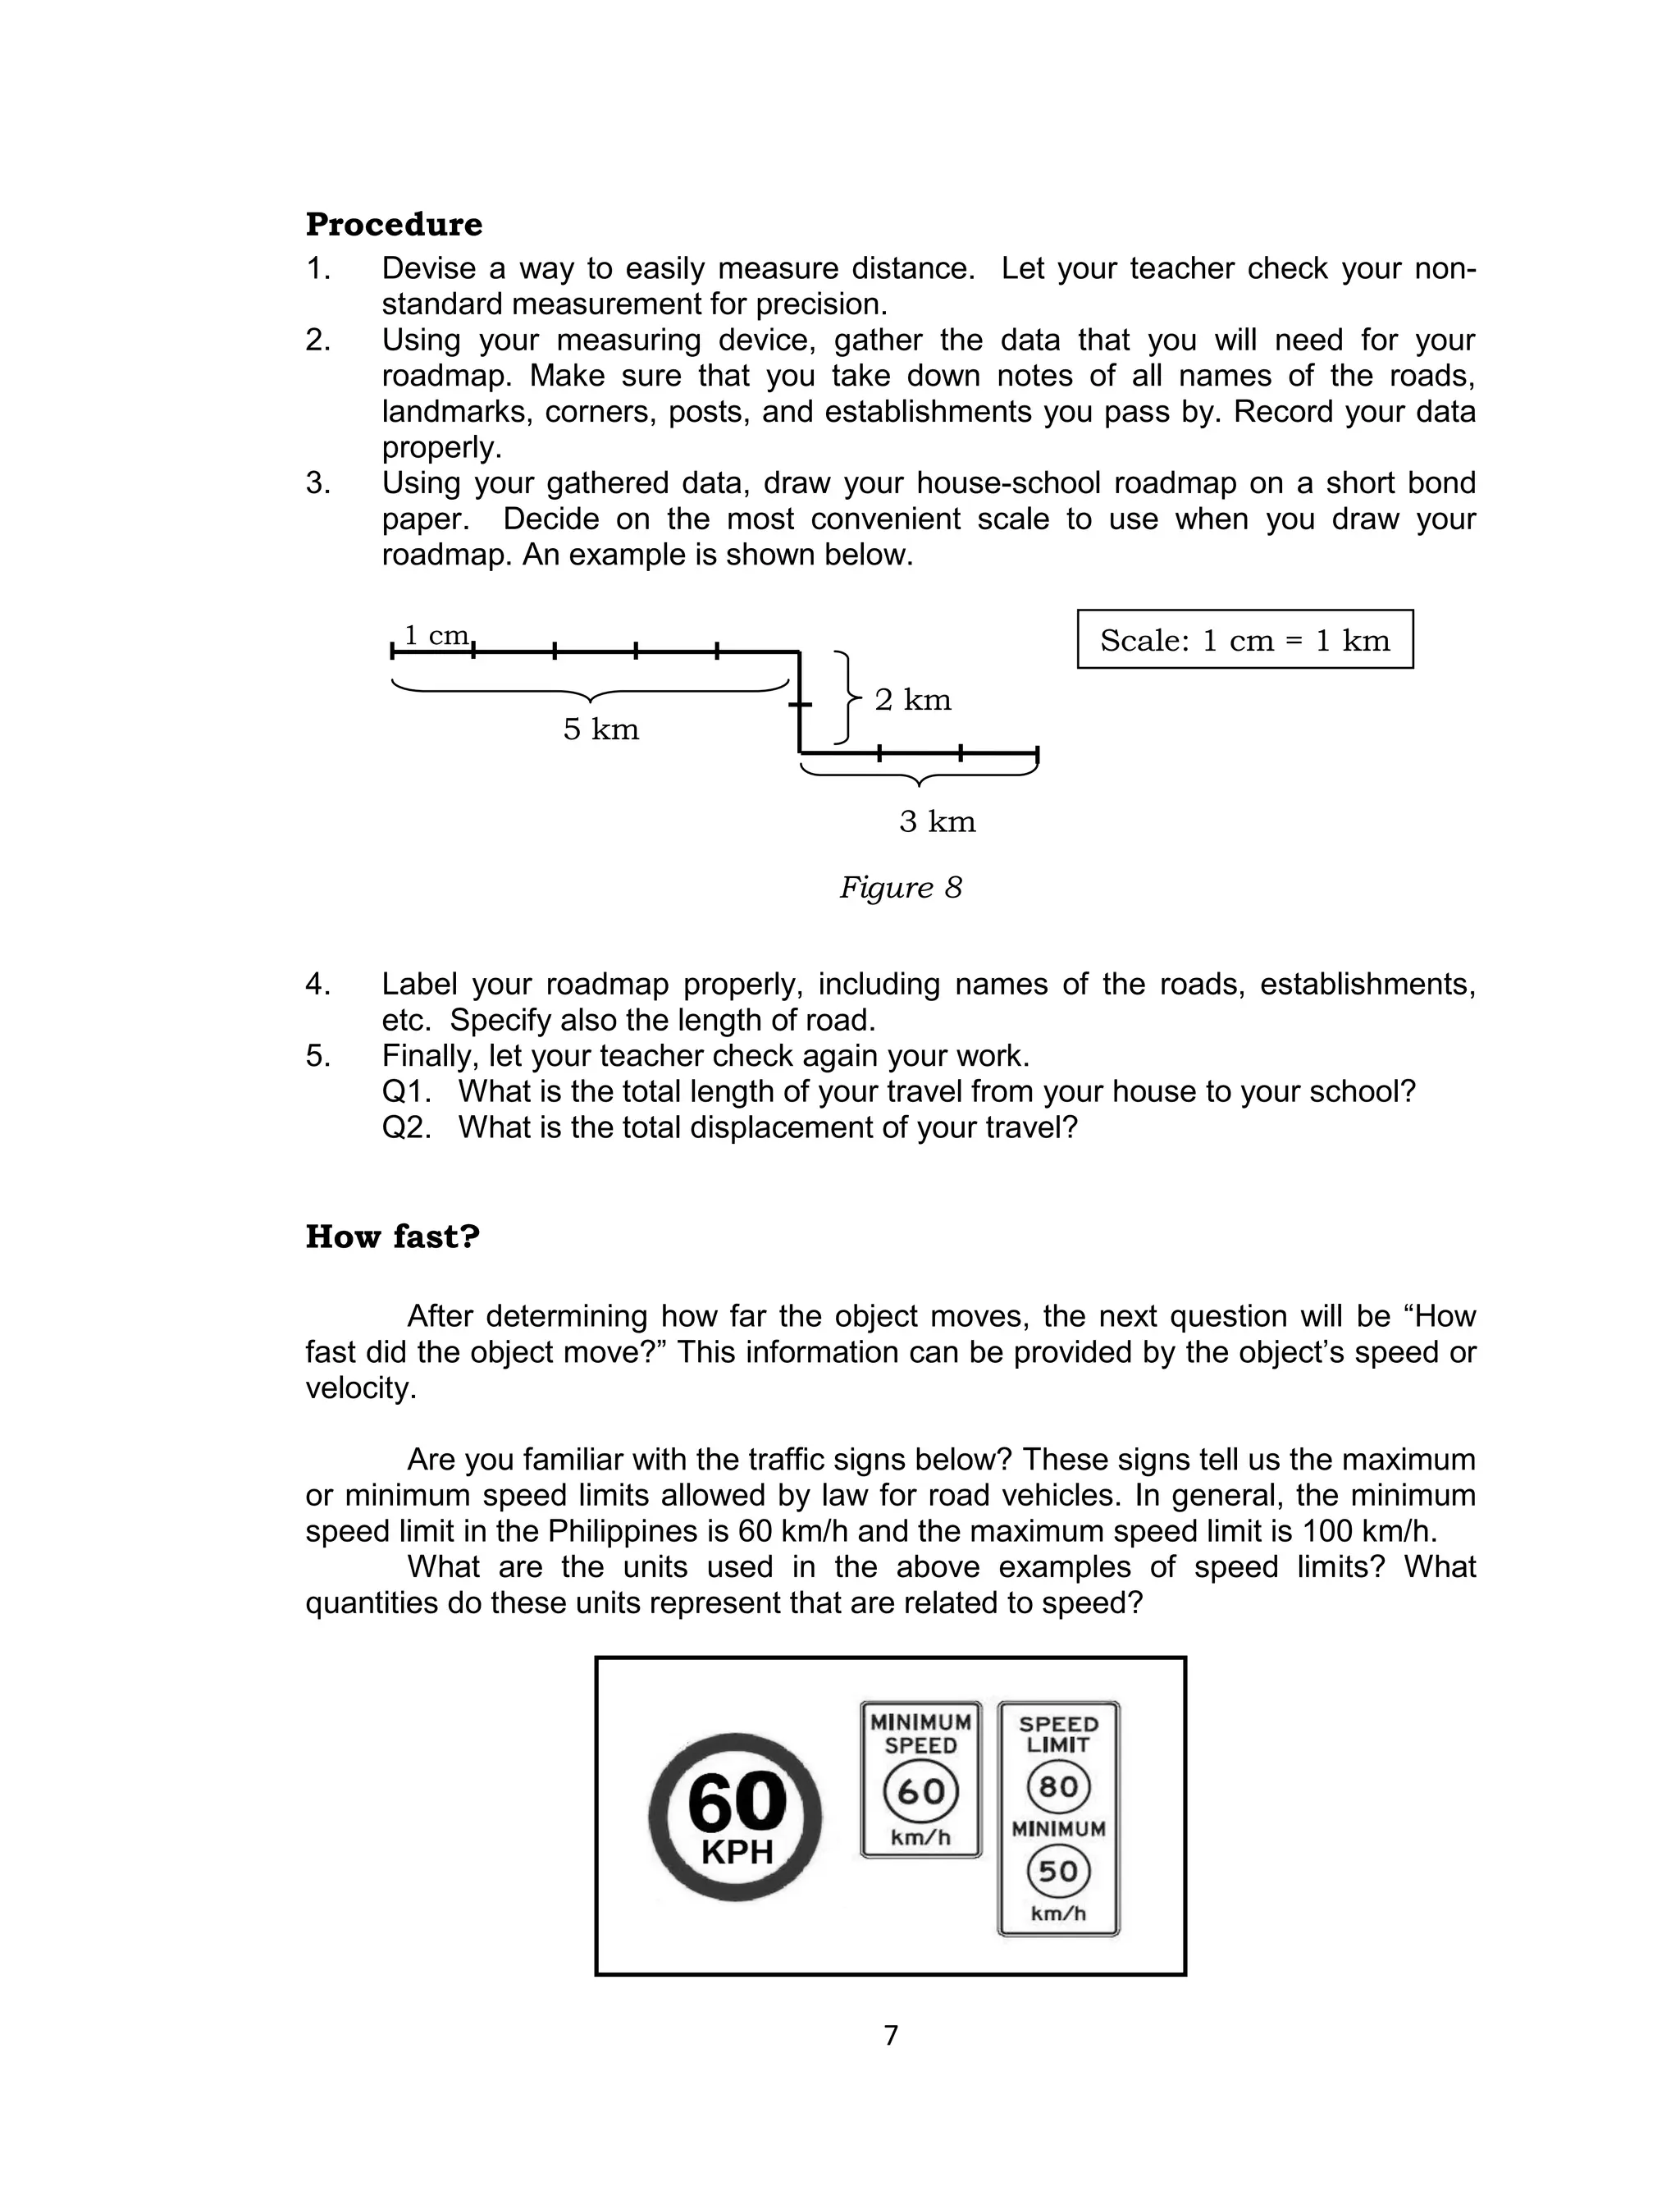
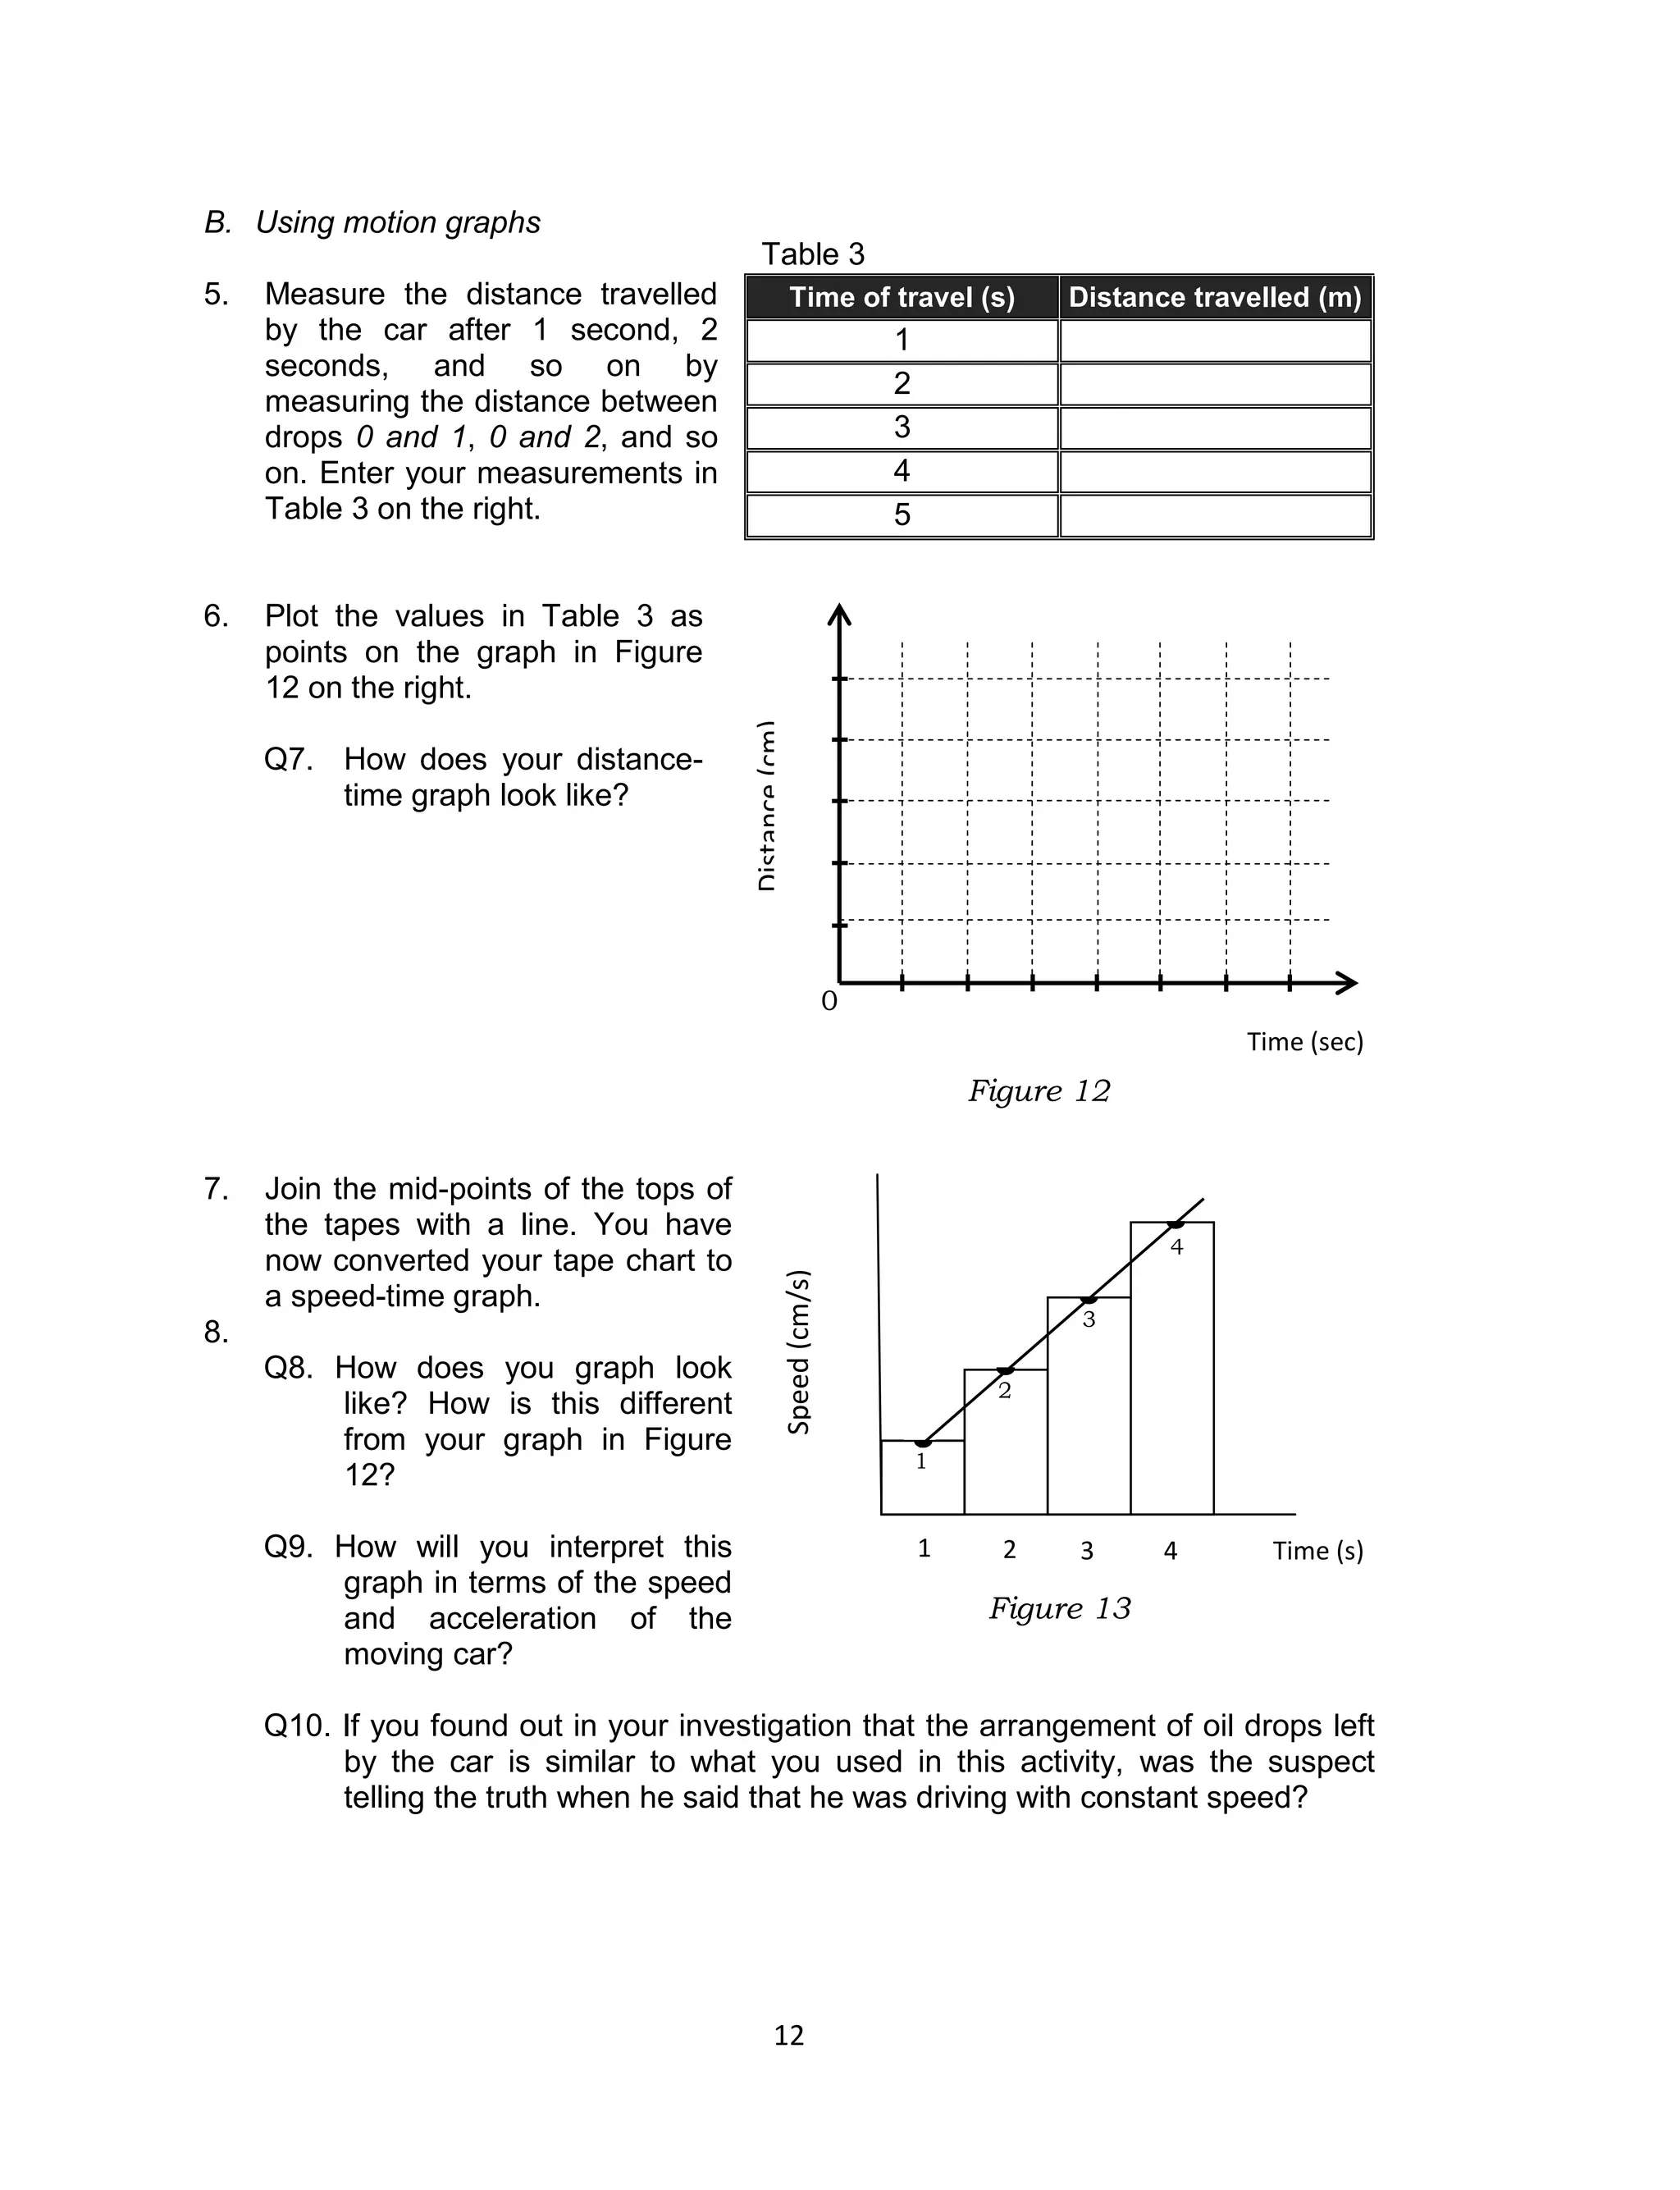
This document provides information about describing motion, including key concepts like position, distance, displacement, speed, velocity, constant vs changing speed, and using diagrams, graphs, and tape charts to analyze motion. It contains two activities: 1) An activity where students describe the position of an object using words and diagrams. This reinforces the importance of reference points and visual representations of position. 2) An imaginary scenario where students analyze "oil spots" left by a suspected hit-and-run vehicle to determine if it was moving at a constant speed, as claimed, or with changing speed. Students would create a tape chart or motion graph to compare distances between spots over time. This allows them to make inferences about the