Downloaded 1,291 times


![7. The higher the frequency of a wave,
a. the lower its speed
b. the shorter its wavelength
c. the greater its amplitude
d. the longer its period
8. Of the following properties of a wave, the one that is independent of the
others is its
a. amplitude
b. wave speed
c. wavelength
d. frequency
9. Waves in a lake are 5.00 m in length and pass an anchored boat 1.25 s
apart. The speed of the waves is
a. 0.25 m/s
b. 4.00 m/s
c. 6.25 m/s
d. impossible to find from the information given
10. Energy from the sun reaches the earth through
a. ultraviolet waves
b. infrared waves
c. mechanical waves
d. electromagnetic waves
References and Web Links
Anatomy of an electromagnetic wave. Available at:
http://missionscience.nasa.gov/ems/02_anatomy.html
Electromagnetic waves. Available at:
http://www.colorado.edu/physics/2000/waves_particles/
[3] Hewitt, P. (2006). Conceptual Physics 10th Ed. USA: Pearson Addison-
Wesley.
The anatomy of a wave. Available at:
http://www.physicsclassroom.com/class/waves/u10l2a.cfm
The nature of a wave. Available at:
http://www.physicsclassroom.com/class/waves/u10l1c.cfm
34 Grade 7 Science: Learner’s Material (Second Part)
Grade 7 Science: Energy In Motion 116](https://image.slidesharecdn.com/integratedsciencemoduleforgrade-7-quarter3-4-140907063615-phpapp01/85/Integrated-Science-Module-for-Grade-7-Quarter-3-4-40-320.jpg)


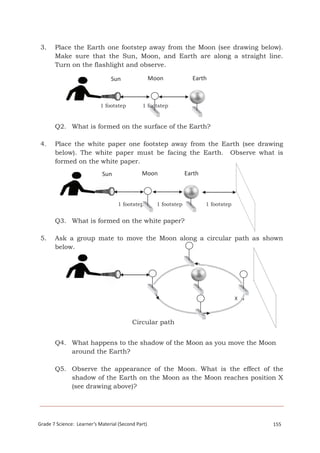


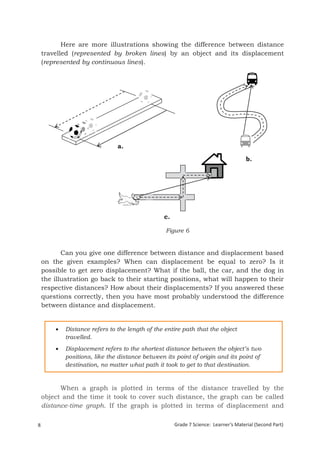
This document provides instructions for an activity to describe the position of objects. It discusses using words, diagrams, and graphs to describe position. In the activity, students are given a description of an object's location and must find the object. They then improve the instructions and have another group use the revised ones. The document emphasizes that an object's position must be described in relation to a point of reference, and it provides examples of diagrams that visually depict positions along a number line or at intervals of time.