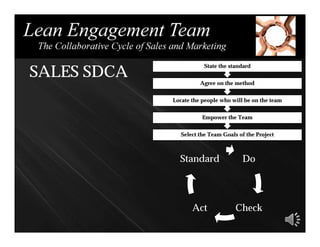
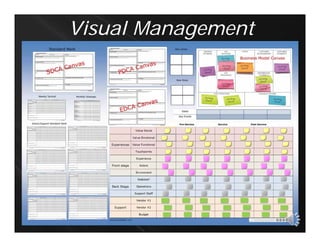
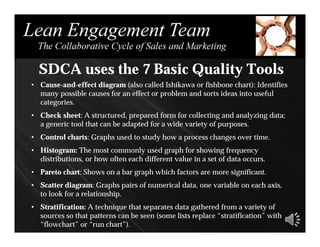
SERVICE
by Joe Dager, Business901
Lean
DesignService
EDCASDCA
PDCA
Visual Management
Standard
Work
for the
Lean Engagement
Team
EDCA PDCA SDCA
How important is Standard Work?
Standard Work puts the food on the table!
• Clarity on What to do
• Commitment on When to do it
• Translation from Goals to Actions, the Why
• Enablement of the actions, How
• Accountability thru establishing the Who
• Line of sight on Where your circle of influence
effects
Standard Work provides discipline thru
Standard Work in 1 word
Execution
SALES SDCA
Do
CheckAct
Standard
Select the Team Goals of the Project
Empower the Team
Locate the people who will be on the team
Agree on the method
State the standard
Do
CheckAct
Standard
Select the Team Goals of the Project
Empower the Team
Locate the people who will be on the team
Agree on the method
State the standard
S: State the standard
• Standard work is the best practice for a given
process.
• Provide a routine for consistent delivery of work.
• Must be stated clearly.
• Provide a clear line of sight to the
• Value Stream Manager
• Team Coordinator
• Team Members
A: Agree on the method.
• Method you are going to use for the
documentation of standard work.
• Provide necessary components of a reporting
system that ensures the work is being done as
expected.
• Use the practices you are currently doing
L: Locate the people who will be on the team.
• List the members of your team
• Including position and role they will play.
Name Position Role
E: Empower the Team
• Team is autonomous and completely responsible for
the tasks within this stage
• Clarity is most critical factor for empowering a team
• Outline Meetings, Daily Stand-ups, Weekly Tactical,
Monthly Strategic and others as needed
• Agree on Standard Work
S: Select the Team Goals of the Project
• Team fully understands the exact goals and
outcomes expected for this particular cycle
• Team agrees to the exact goals and outcomes
expected for this particular cycle
• Team accepts responsibilities of outcomes.
Actors
S:  Standard 
• Review the method.
• Document the actions needed and who will complete 
each action step.
• Clarify the resources needed for each action step. 
• Decide on what constitutes variation and 
required action.   Actors
D: Do the plan
• Perform to the standard.
• Provide line of sight through Kanban Board, Task
Board, Action Planner.
• Demonstrate work flow and problems
encountered.
Actors
C: Check (Study) see if improvement was made
• Did the plan work?
• Collect and analyze data to demonstrate if standard
was done.
• Determine what changes are needed for improvement.
Actors
A: Act (Adjust)
• Is the standard being completed?
• Has Customers’ needs been completed?
• If not, reconsider and continue improvement
• Can customer can be handed off to next
stage/cycle, document steps taken.
Actors
Visual Management
Example of Team Member Standard Work
Actors
Provides Line of Sight for Team at Daily
Standup
Actors
Team Coordinator/Leader Standard Work
Line of Site for resources needed at weekly tactical
Providing a visual, simple and
easily access document is the
key.
Value Stream Manager Standard
Work
Line of Site for Goal review at Monthly Strategic
Actors
SDCA uses the 7 Basic Quality Tools
• Cause-and-effect diagram (also called Ishikawa or fishbone chart): Identifies
many possible causes for an effect or problem and sorts ideas into useful
categories.
• Check sheet: A structured, prepared form for collecting and analyzing data;
a generic tool that can be adapted for a wide variety of purposes.
• Control charts: Graphs used to study how a process changes over time.
• Histogram: The most commonly used graph for showing frequency
distributions, or how often each different value in a set of data occurs.
• Pareto chart: Shows on a bar graph which factors are more significant.
• Scatter diagram: Graphs pairs of numerical data, one variable on each axis,
to look for a relationship.
• Stratification: A technique that separates data gathered from a variety of
sources so that patterns can be seen (some lists replace “stratification” with
“flowchart” or “run chart”).
Frame
Problems as Opportunities
Always DRAW for
• Yourself
• Team
• Organization
• Customers
Visual Management
http://leanmarketinglab.com
• Over 130 Free eBooks
• Regular Blog Posts
• Free Tools
• Discussion Groups
• Podcast with Celebrated Authors, Industry
Practitioners and Leading Thought Leaders
Our Mission is to bring
Continuous Improvement to Sales and Marketing.

Lean Service Design SDCA

  • 1.
    SERVICE by Joe Dager,Business901 Lean DesignService EDCASDCA PDCA
  • 2.
  • 3.
  • 4.
    EDCA PDCA SDCA Howimportant is Standard Work? Standard Work puts the food on the table!
  • 5.
    • Clarity onWhat to do • Commitment on When to do it • Translation from Goals to Actions, the Why • Enablement of the actions, How • Accountability thru establishing the Who • Line of sight on Where your circle of influence effects Standard Work provides discipline thru
  • 6.
    Standard Work in1 word Execution
  • 8.
    SALES SDCA Do CheckAct Standard Select theTeam Goals of the Project Empower the Team Locate the people who will be on the team Agree on the method State the standard
  • 9.
    Do CheckAct Standard Select the TeamGoals of the Project Empower the Team Locate the people who will be on the team Agree on the method State the standard
  • 11.
    S: State thestandard • Standard work is the best practice for a given process. • Provide a routine for consistent delivery of work. • Must be stated clearly. • Provide a clear line of sight to the • Value Stream Manager • Team Coordinator • Team Members
  • 12.
    A: Agree onthe method. • Method you are going to use for the documentation of standard work. • Provide necessary components of a reporting system that ensures the work is being done as expected. • Use the practices you are currently doing
  • 13.
    L: Locate thepeople who will be on the team. • List the members of your team • Including position and role they will play. Name Position Role
  • 14.
    E: Empower theTeam • Team is autonomous and completely responsible for the tasks within this stage • Clarity is most critical factor for empowering a team • Outline Meetings, Daily Stand-ups, Weekly Tactical, Monthly Strategic and others as needed • Agree on Standard Work
  • 15.
    S: Select theTeam Goals of the Project • Team fully understands the exact goals and outcomes expected for this particular cycle • Team agrees to the exact goals and outcomes expected for this particular cycle • Team accepts responsibilities of outcomes.
  • 16.
  • 17.
    S:  Standard  • Review the method. • Document the actions needed and who will complete  each action step. •Clarify the resources needed for each action step.  • Decide on what constitutes variation and  required action.   Actors
  • 18.
    D: Do theplan • Perform to the standard. • Provide line of sight through Kanban Board, Task Board, Action Planner. • Demonstrate work flow and problems encountered. Actors
  • 19.
    C: Check (Study)see if improvement was made • Did the plan work? • Collect and analyze data to demonstrate if standard was done. • Determine what changes are needed for improvement. Actors
  • 20.
    A: Act (Adjust) •Is the standard being completed? • Has Customers’ needs been completed? • If not, reconsider and continue improvement • Can customer can be handed off to next stage/cycle, document steps taken. Actors
  • 21.
  • 22.
    Example of TeamMember Standard Work Actors
  • 23.
    Provides Line ofSight for Team at Daily Standup Actors
  • 24.
  • 25.
    Line of Sitefor resources needed at weekly tactical Providing a visual, simple and easily access document is the key.
  • 26.
    Value Stream ManagerStandard Work
  • 27.
    Line of Sitefor Goal review at Monthly Strategic Actors
  • 28.
    SDCA uses the7 Basic Quality Tools • Cause-and-effect diagram (also called Ishikawa or fishbone chart): Identifies many possible causes for an effect or problem and sorts ideas into useful categories. • Check sheet: A structured, prepared form for collecting and analyzing data; a generic tool that can be adapted for a wide variety of purposes. • Control charts: Graphs used to study how a process changes over time. • Histogram: The most commonly used graph for showing frequency distributions, or how often each different value in a set of data occurs. • Pareto chart: Shows on a bar graph which factors are more significant. • Scatter diagram: Graphs pairs of numerical data, one variable on each axis, to look for a relationship. • Stratification: A technique that separates data gathered from a variety of sources so that patterns can be seen (some lists replace “stratification” with “flowchart” or “run chart”).
  • 29.
  • 30.
    Always DRAW for •Yourself • Team • Organization • Customers
  • 31.
  • 32.
    http://leanmarketinglab.com • Over 130Free eBooks • Regular Blog Posts • Free Tools • Discussion Groups • Podcast with Celebrated Authors, Industry Practitioners and Leading Thought Leaders Our Mission is to bring Continuous Improvement to Sales and Marketing.