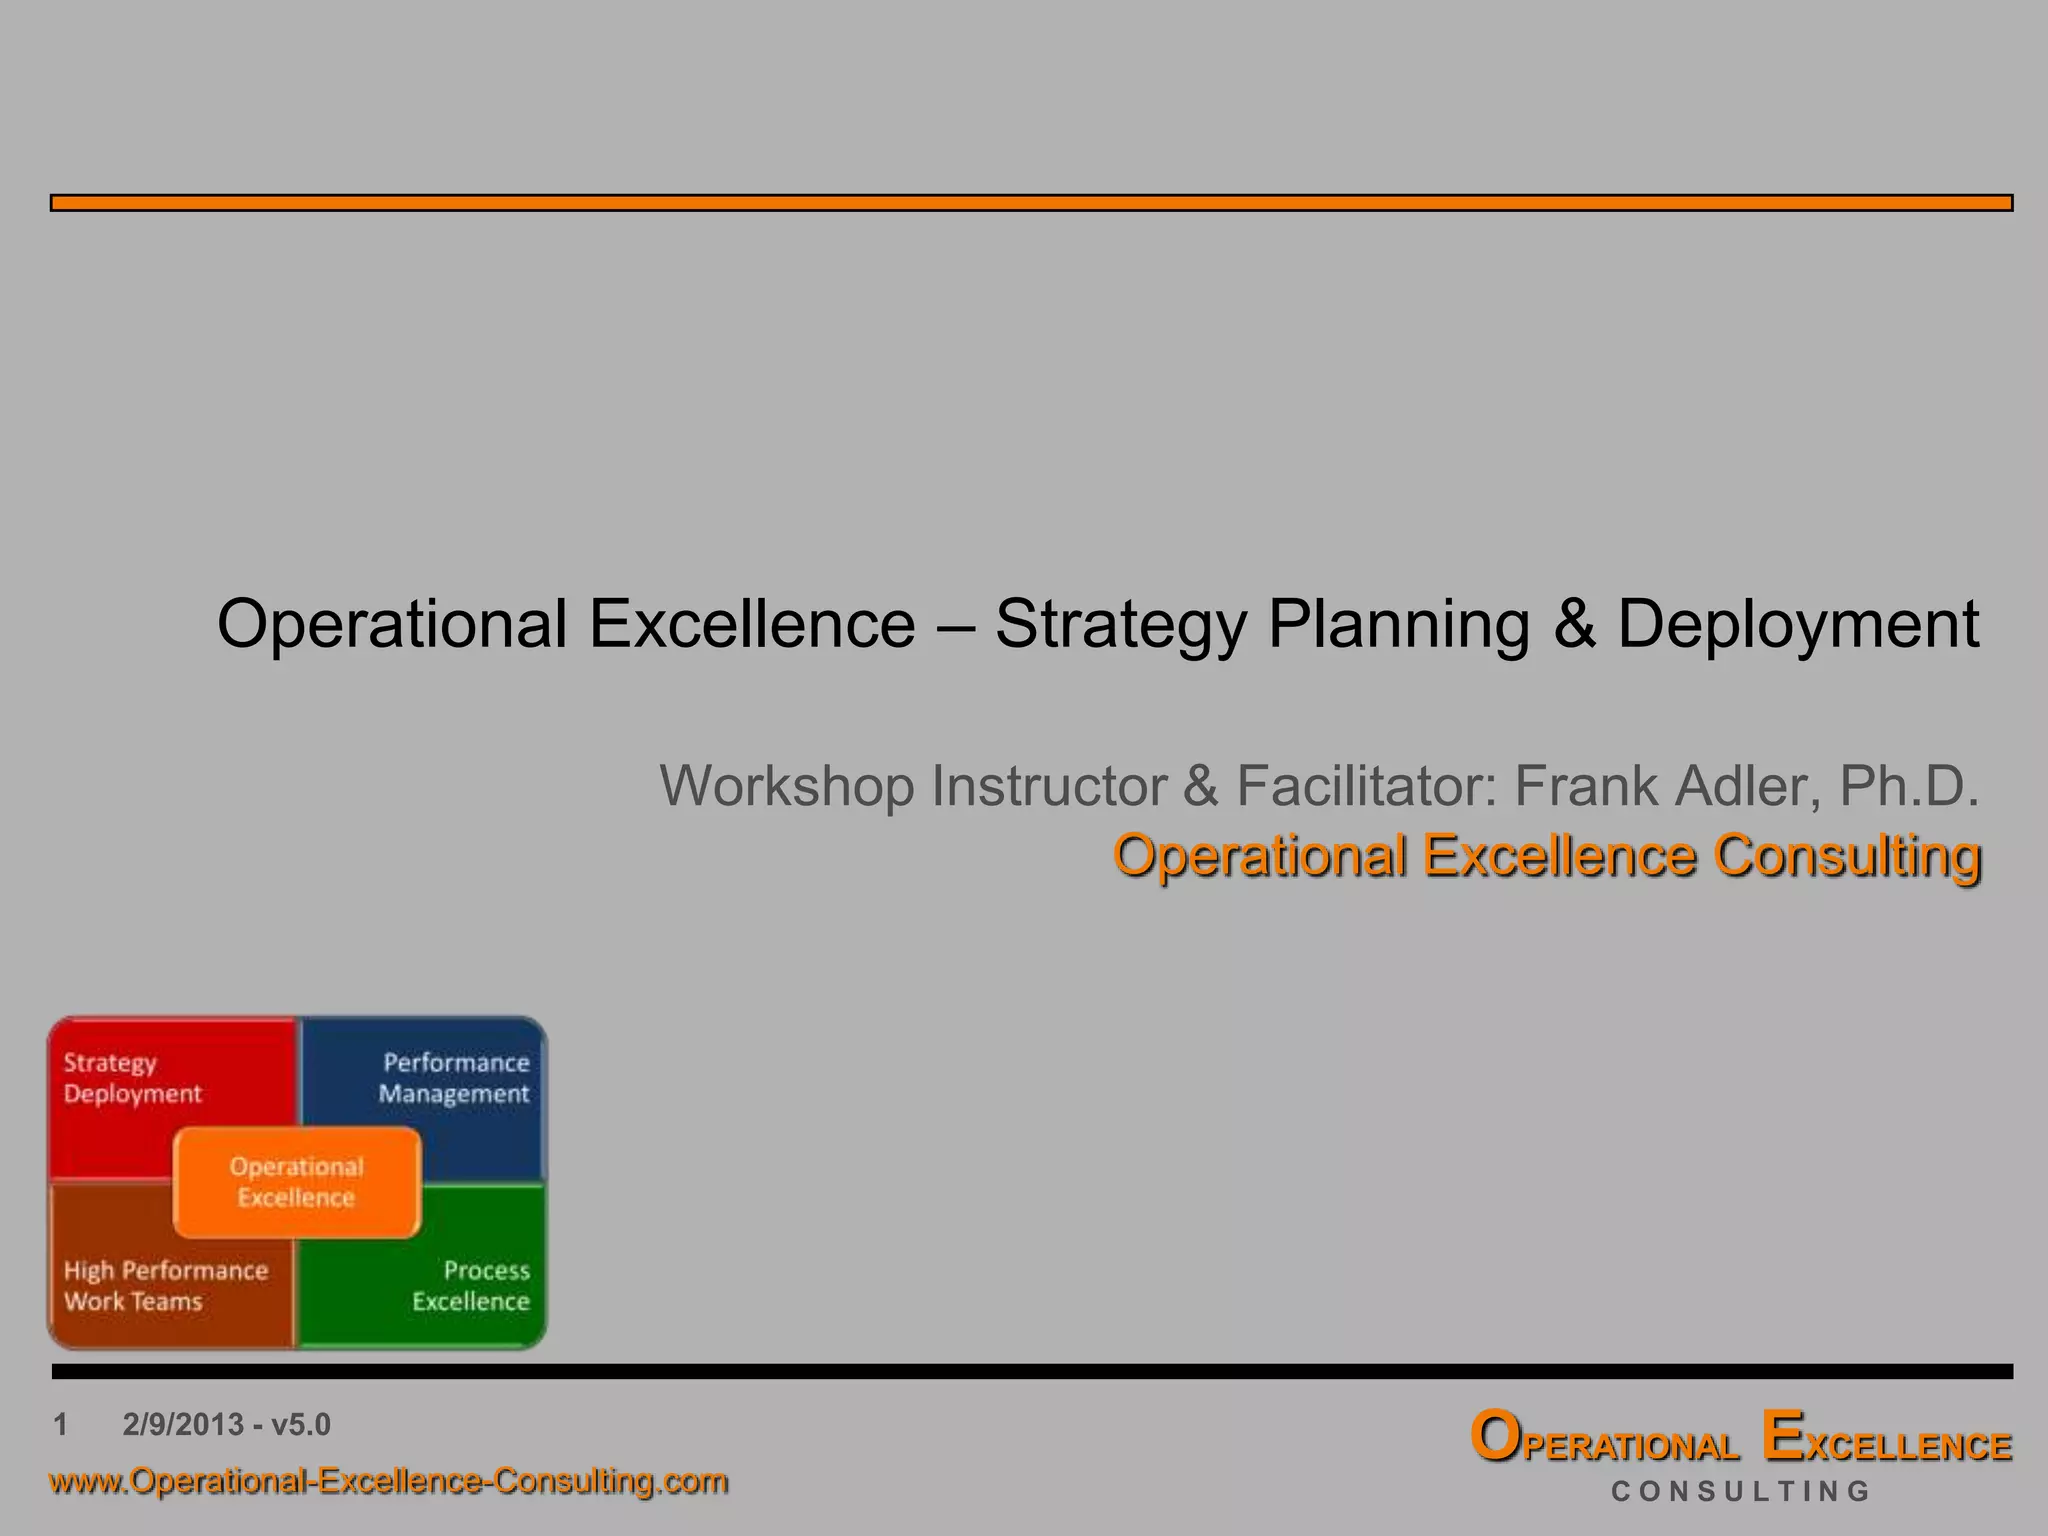
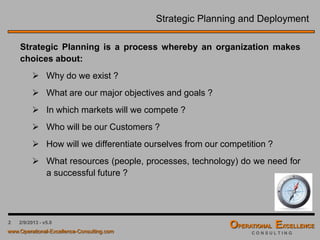
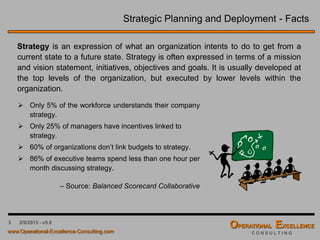
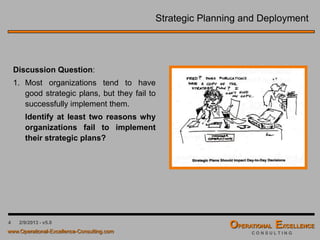
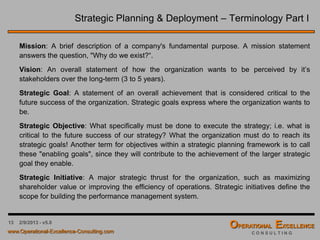
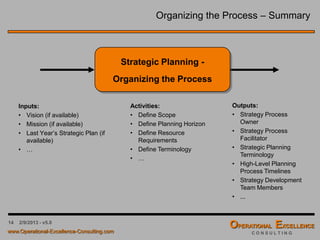
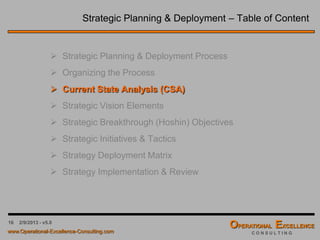
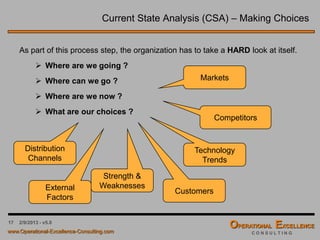
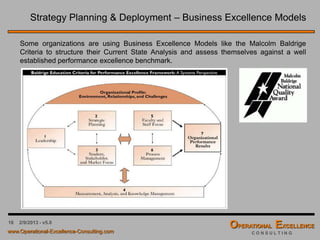
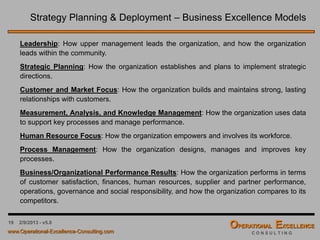
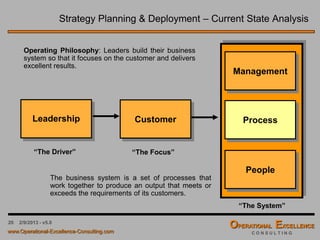
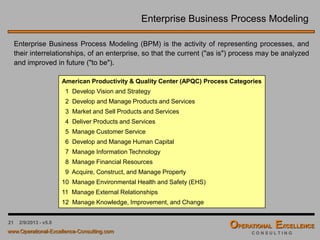
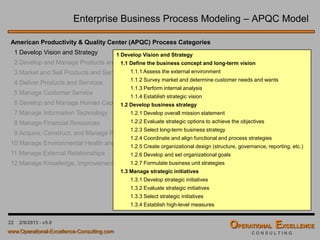
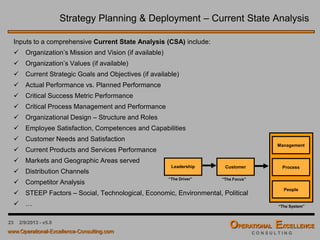
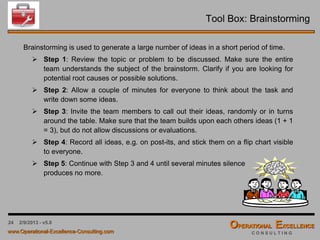
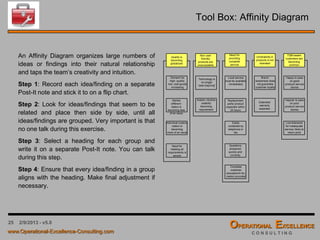
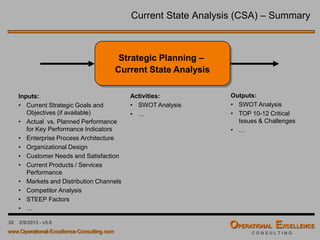
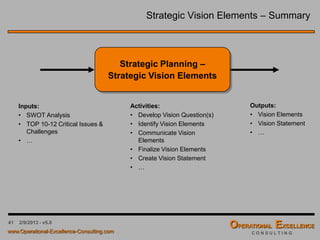
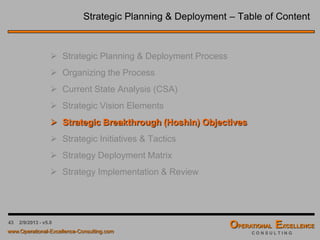
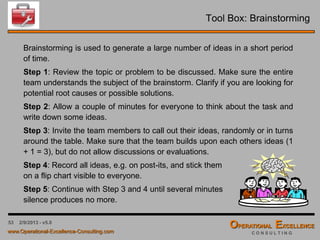
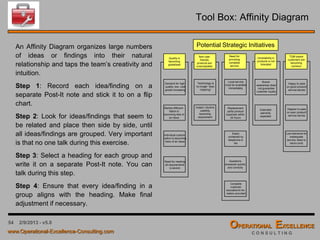
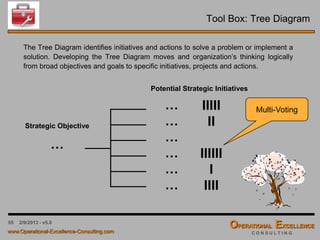
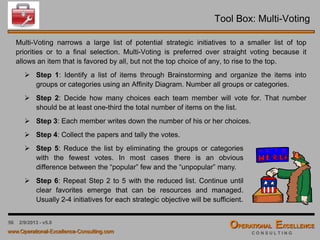
The Strategy Planning and Deployment Training Module v6.0 includes:
1. MS PowerPoint Presentation including 97 slides covering our Strategy Planning and Deployment Process using Strategy Maps and Hoshin Kanri, including Introduction to Strategy Planning, Organizing the Process, Current State Analysis (CSA), Strategic Vision Elements, Strategic Breakthrough Objectives, Strategy Maps, Strategic Initiatives and Tactics, Strategy Deployment Matrix, and Strategy Implementation and Review.
2. MS Excel Templates for Annual Planning, Criticality Analysis, Force Field Analysis, Radar Gap Analysis Chart, Strategy Grid Alignment Matrix, Strategy Grid Correlation Matrix, Project Selection Matrix, Bowling Chart, and Strategy Implementation Review Table.
3. MS Word Current State Analysis (CSA) Questionnaire
4. MS Excel Hoshin Kanri Strategy Deployment X-Matrix Template
The An Introduction to Operational Excellence v9.0 presentation is free-of-charge and includes:
1. MS PowerPoint Presentation including 41 slides covering an Introduction to the 4 Building Blocks of Operational Excellence - Strategy Deployment & Hoshin Planning, Performance Management & Balanced Scorecards, Process Excellence & Lean Six Sigma, and High Performance Work Teams.
Leadership and Managerial Skills Toolkit - Framework, Best Practices and Temp...Aurelien Domont, MBA
This Toolkit was created by ex-McKinsey, Deloitte & BCG Management Consultants specialized in coaching leaders and managers. It will help you (I) Resolve complex problems and structure your reasoning, (II) Communicate effectively, (III) Negotiate effectively, (IV) Manage your time, (V) Manage your team, (VI) Define who you want to be, and what you want to achieve. This Toolkit was used to train the leadership team and the managers of multiple Fortune Global 1000 firms. This Slideshare Powerpoint presentation is only a small preview of our Toolkit. You can download the entire Toolkit in Powerpoint and Excel at www.slidebooks.com
"You can download this product from SlideTeam.net"
Showcase the ways of performance improvement with our creatively designed Operational Excellence Powerpoint Presentation Slides. This business operational excellence framework presentation deck covers various professionally designed templates such as company history of operational excellence capabilities, evaluate the existing operational gaps, design an evaluation process, ensure continuous improvement, implementing regional operations, analytics of achieving operational excellence, monitor performance, etc. Furthermore, to cover all the important concepts our designers have included additional templates e.g. meet our team, mission and vision, timeline, target, thank you, area and bar chart, etc. Establish the most effective organization structure with the help of the organization process excellence PPT visuals. The operation management ppt slides have all visually appealing graphics with in-depth researched content. Apart from this with the support of our PPT, you can portray various concepts like strategy deployment, performance management, continuous improvement, organizational excellence, process excellence, leadership people and culture, etc. Download business plan operation strategy PowerPoint templates for the smooth operation of business processes. Create an extraordinary business experience. Drive the elation with our Operational Excellence Powerpoint Presentation Slides. https://bit.ly/3bjZ4ll
This Strategy Toolkit was created by ex-McKinsey, Deloitte and BCG Strategy Consultants, after more than 3,000 hours of work. It is considered the world's best & most comprehensive Strategy Toolkit. It includes all the Frameworks, Analysis Tools & Document Templates required to excel in a Strategy position and define & implement a winning Strategy for your organization. This Slideshare presentation is only a small sample of our Toolkit. You can download the entire Toolkit at www.slidebooks.com
Hoshin Kanri: Creating a Strategy Deployment Plan That Gets Results TKMG, Inc.
Recorded webinar: http://slidesha.re/1mRBbSd
Subscribe: http://www.ksmartin.com/subscribe
To purchase the book: http://bit.ly/TOObk
Hoshin Kanri (also known as strategy deployment) is a highly effective way for organizations to select and prioritize the important work they need to do to realize their business goals. Done properly, the approach results in organization-wide alignment about what matters and a more focused approach for realizing results.
In this webinar, you'll learn how strategy deployment can help your organization, department, or work team accomplish far more in a given year, with far less stress and far better results. The approach also leads to far higher levels of employee engagement.
Rick Austin - Portfolio mangement in an agile world [Agile DC]LeadingAgile
When organizations move to agile for software delivery, there is often tension with traditional portfolio management. This talk will illustrate how an organization can move from traditional portfolio management approaches to one that embraces agile software delivery. Doing so enables organizations to become predictable, improve the flow of value delivered, and pivot more quickly if necessary.
We will demonstrate the use of governance that allows a more adaptive portfolio management approach. We will cover topics that enable agile portfolio management including:
Lean techniques for managing flow
Effective prioritization techniques
Long range road-mapping
Demand management and planning
Progressively elaborated business cases
Validation of outcomes
Support for audit and compliance needs
These topics will be illustrated by real-world examples of portfolio management that have been proven over the last five years with a wide range of clients.
ANI | Agile Kolkata | PI Planning in Action | Anand Pandey | 19th Oct 2019AgileNetwork
Abstract
The primary purpose of PI planning in SAFe is to gain alignment between business owners and program teams on a common, committed set of Program Objectives and Team Objectives for the next release (PI) time-box. This workshop is to experience PI planning in action.
Key Takeaways
1. Understanding of the importance of PI planning
2. Good practices for an effective PI planning
3. Preparatory work required for a PI planning
What is strategic planning?
Identify and explain different levels of planning in organisations.
Understand the relationship between corporate & functional plans.
What should be included in the strategic plan?
Evaluate the role of strategic planning.
What are the benefits of strategic planning to the firm?
What challenges are associated with strategic planning?
Balanced Scorecard Deployment Process Training ModuleFrank-G. Adler
The Balanced Scorecard Deployment Training Module v8.0 includes:
1. MS PowerPoint Presentation including 79 slides covering Balanced Scorecard History & Benefits, Four Dimensions of a Balanced Scorecard, Balanced Scorecard Development & Deployment Process, Balanced Scorecard Deployment Challenges & Resolution Strategies, Balanced Scorecard Template & Detailed Instructions, and Project Evaluation & Selection Matrix.
2. MS Excel Balanced Scorecard Template and Example
3. MS Word Workshop Agenda & Evaluation Sheet for a Balanced Scorecard Development Workshop
4. MS Excel Project Evaluation & Selection Matrix to ensure alignment of Operational Excellence, Lean Management, and Six Sigma projects to the Balanced Scorecard
Delivered to clients in U.A.E and Africa within the past month at their request. Clients had already put in place a project methodology but now wanted support in maximising the benefits.
A straight forward and repeatable approach to creating Enterprise Agility by Connecting Strategy to Execution through the use of Facilitated Articulation, A3 Planning, Kanban Project Management, and Agile technology development. The approach results in alignment and drives effective change management.
Asset integrity services such as KBAI™ (Knowledge Based Asset Integrity) provide risk profiling for key components based on assessment of data from a variety of sources. This allows owners and operators to better predict where problems will occur. Similar approaches are already regularly used by owners and operators in other industries such as oil and gas. Such systems provide a maintenance and/or inspection task plan that is optimised specifically for the asset and the business. - See more at: http://blog.lr.org/2013/05/kbai-the-definitive-addition-to-your-om-strategy/#sthash.TWKPtbTK.dpuf
Why there are so many problems with streamlining data strategy ? What are the major problems ? How do you solve them ?
Using an approach based on Agile and Lean Concepts to achieve the goal of actionable data & analytics
Scenarios - approaches for exploring urban futures Ian Miles
Presentation to "future of cities" network, explaining diofferent types of scenario and describing work undertaken in context of Greater Manchester 2040+ see http://www.gm2040.com/ for more
Mission - Vision - Strategy in Organisationsgueste7f127a
Slide deck I made for a 1 hour presentation about Mission - Vision - Strategy in organisations for first year engineering students. I usually end the presentation with a 10 minute round-up of personal experiences with M-V-S in my entrepreneurial background.
On the 23rd Nov 2015 the British Computer Society (BCS) Enterprise Architecture Specialist Group (which I co-chair) held a practitioners evening.
These are my Slides for the ICT Strategy Session - Setting context and highlighting an approach delivering a ICT strategy rapidly.
Strategic planning is an art of formulating strategies, implementing and evaluating them. Equipping leaders and managers with skills such as problem solving, communication,critical thinking, decision making and leadership that are required to plan strategically in a competitive business environment.
Auraa Image Management and Consulting specializes in training leaders, managers and their teams to develop a growth oriented mindset and hone their skills to formulate and execute strategic business objectives.
If your organization is unable to achieve the expected desired results, it may be time to rethink the organizational strategy. Connect with us and learn how to strategically plan for success.
Contact: +91 9958934766 / +91 7830222285
Email: samira@auraaimage.com / nayanika@auraaimage.com
Website: https://auraaimage.com / https://samiragupta.com/
Sm 11 part_03_03
Strategic Management course version 11
Strategic management in any organization is important as it provides overall direction by developing plans and policies designed to achieve objectives and then allocating resources to implement the plans.
Videos on YouTube:
video 01
https://youtu.be/alh6O6Q_9sc
video 02
https://youtu.be/b2UwGeOTEX0
video 03
https://youtu.be/R7K0W3yinLo
Strategic Planning Toolkit - Framework, Best Practices and TemplatesAurelien Domont, MBA
This Strategic Planning Toolkit was created by ex-McKinsey, Deloitte and BCG Strategy Consultants, after more than 2,000 hours of work. It is considered the world's best & most comprehensive Strategic Planning Toolkit. It includes all the Frameworks, Analysis Tools & Document Templates required to improve your Strategic Planning capability, and become the subject matter expert of your organization. This Slideshare Powerpoint presentation is only a small preview of our Toolkit. You can download the entire Toolkit in Powerpoint and Excel at www.slidebooks.com
Measuremen Systems Analysis Training ModuleFrank-G. Adler
The Six Sigma Measurement Systems Analysis (MSA) Training Module includes a MS PowerPoint Presentation including 62 slides covering an Introduction to Measurement Systems Analysis - Relevance - Discrimination - Accuracy - Stability - Linearity - Precision, Variable Gage R&R Study, and Attribute Gage R&R Study.
Six Sigma Confidence Interval Analysis (CIA) Training ModuleFrank-G. Adler
The Six Sigma Confidence Interval Analysis (CIA) Training Module v1.0 includes:
1. MS PowerPoint Presentation including 72 slides covering theory and examples of Confidence Interval Analysis and Hypothesis Testing for CIA for one Mean Value, Comparison of two Mean Values, Comparison of a Paired Data Sets, CIA for one Standard Deviation, Comparison of two Standard Deviations, CIA for Capability Indices, CIA for one Defect Rate, Comparison of two Defect Rates, CIA for one Count, and Comparison of two Counts.
2. MS Excel Six Sigma Confidence Interval Analysis Calculator making it really easy to calculate Confidence Intervals (mean value, standard deviation, capability indices, defect rate, count) and perform a Comparison of two Statistics (mean values, standard deviations, defect rates, counts).
Six Sigma Statistical Process Control (SPC) Training ModuleFrank-G. Adler
The Statistical Process Control (SPC) Training Module v4.0 includes:
1. MS PowerPoint Presentation including 129 slides covering Introduction to Process Control, Types of Histograms, Measures of Location & Variability, Process Control Charts, Process Control Limits, Out-of-Control Criteria, Sample Size & Frequency, Out-of-Control Action Plan, Process Control Plan, and 6 Workshop Exercises.
2. MS Excel Confidence Interval Analysis Calculator making it really easy to calculate Confidence Intervals (mean value, standard deviation, capability indices, defect rate, count) and perform a Comparison of two Statistics (mean values, standard deviations, defect rates, counts).
3. MS Excel Process Control Plan Template
Six Sigma Process Capability Study (PCS) Training Module Frank-G. Adler
The Process Capability Study (PCS) Training Module v3.0 includes:
1. MS PowerPoint Presentation including 98 slides covering Introduction to Six Sigma, Creating and analyzing a Histogram, Basic Statistics & Product Capability, Statistical Process Control for Variable Data, Definitions of Process Capability Indices, Confidence Interval Analysis for Capability Indices, Capability Study for Non-Normal Distributed Processes, and several Exercises.
2. MS Excel Confidence Interval Analysis Calculator making it really easy to calculate Confidence Intervals for Capability Indices and other Statistics.
Lean Quick Changeover (SMED) Training ModuleFrank-G. Adler
The Lean Quick Changeover (SMED) Training Module v2.0 includes:
1. MS PowerPoint Presentation including 65 slides covering an Introduction to Lean Management, The Seven Lean Wastes, Lean Kaizen Events, and a Step-by-Step Changeover Time Reduction (SMED) Process.
2. MS Excel Changeover Time Analysis Worksheet Template
The Lean Kanban Systems Training Module v2.0 includes:
1. MS PowerPoint Presentation including 83 slides covering an Introduction to Lean Management, Benefits of Lean Kanban Systems, Kanban Size Calculations, Three Types of Kanban Systems - Single Card Kanban - Dual or Machine Card Kanban - In-Process Kanban, and a Step-by-Step Kanban Implementation Process.
Lean Standard or Standardized Work Training ModuleFrank-G. Adler
The Lean Standard Work Training Module v3.0 includes:
1. MS PowerPoint Presentation including 66 slides covering the History of Lean Manufacturing, Five Lean Principles, The Seven Lean Wastes, Introduction to Lean Standard Work (Introduction, Objectives, Benefits), Basic Requirements of Lean Standard Work, Step-by-Step Process using the Four Lean Standard Work Worksheets & Examples, Takt & Cycle Time, Work Balancing, Quick Changeovers, and Kanban Solutions.
2. MS Excel Process Study Worksheet Template
3. MS Excel Process Capacity Worksheet Template & Example
4. MS Excel Work Chart Template & Example
5. MS Excel Work Combination Table Template & Examples
Global 8D Problem Solving Process Training ModuleFrank-G. Adler
The 8D Problem Solving Process Training Module v8.0 includes:
1. MS PowerPoint Presentation including 206 slides covering the Global 8D Problem Solving Process & Tools, a Case Study, and 7 Workshop Exercises.
2. MS Word Problem Solving Process Case Study
3. MS Excel 8D Problem Solving Process Worksheet Template
4. MS Excel Process Variables Map Template, Process FMEA Template, and Process Control Plan Template
5. MS Word 8D Problem Solving Process Report Template
Business Process Improvement (BPI 7) Process Training ModuleFrank-G. Adler
The Business Process Improvement (BPI 7) Methodology Training Module v2.0 includes:
1. MS PowerPoint Presentation including 127 slides covering our seven-steps Business Process Improvement Methodology.
2. MS Word Process Measure Definition Worksheet
3. MS Word Activity Assessment Worksheet
4. MS Word Change Management Worksheet
5. MS Word Process Management Worksheet
Lean 5S Visual Workplace Organization Training ModuleFrank-G. Adler
The Lean 5S Visual Workplace Training Module v4.0 includes:
1. MS PowerPoint Presentation including 49 slides covering Introduction to 5S Visual Workplace Organization, Seven Lean Wastes & Productivity, Benefits, Types of Resistance, Key Success Factors, Step-by-Step 5S Implementation Process, Concept of Discipline, Red Tag Template, Marking Color Guidelines, 5S Area Evaluation Form and Scoring Guidelines.
2. MS PowerPoint Red Tag Template
3. MS Excel Red Tag Template
4. MS Excel Red Tag Inventory Sheet
5. MS Excel 5S Evaluation and Scoring Guidelines
Lean Value Stream Mapping (VSM) Training ModuleFrank-G. Adler
The Lean Value Stream Mapping (VSM) Training Module v8.0 includes:
1. MS PowerPoint Presentation including 154 slides covering History of Lean Manufacturing, Five Lean Principles, Seven Lean Wastes, A Step-by-Step Approach to Value Stream Mapping with Examples, Basic Lean Management Methods and Tools.
2. MS Excel Value Stream Mapping Team Charter Template
3. MS Excel Future State Transformation Plan Template
4. MS Excel Process Study Worksheet Template & Example, Work Chart Template, Work Combination Table Template & Example, and Process Capacity Worksheet Template & Example
Lean Six Sigma Mistake-Proofing Process Training ModuleFrank-G. Adler
The Mistake-Proofing Process Training Module v5.0 includes:
1. MS PowerPoint Presentation including 128 slides covering in detail an Introduction to Process Risk Analysis & Mistake-Proofing, Process Variables Mapping, Cause & Effect Matrix, Process Failure Mode and Effects Analysis, Human Work Model, Sixteen Human Error Modes, Six Mistake-Proofing Principles, Five Mistake-Proofing Methods, Seven Types of Poka-Yoke Devices, Poka-Yoke Examples, Process Control Plan, and 6 Workshop Exercises.
2. MS Word Process FMEA Severity, Occurrence, and Detection Risk Assessment Guidelines
3. MS Excel Process Variables Map Template, Cause & Effect Matrix Template, Process Failure Modes and Effects Analysis Template, and Process Control Plan Template
[Note: This is a partial preview. To download this presentation, visit:
https://www.oeconsulting.com.sg/training-presentations]
Sustainability has become an increasingly critical topic as the world recognizes the need to protect our planet and its resources for future generations. Sustainability means meeting our current needs without compromising the ability of future generations to meet theirs. It involves long-term planning and consideration of the consequences of our actions. The goal is to create strategies that ensure the long-term viability of People, Planet, and Profit.
Leading companies such as Nike, Toyota, and Siemens are prioritizing sustainable innovation in their business models, setting an example for others to follow. In this Sustainability training presentation, you will learn key concepts, principles, and practices of sustainability applicable across industries. This training aims to create awareness and educate employees, senior executives, consultants, and other key stakeholders, including investors, policymakers, and supply chain partners, on the importance and implementation of sustainability.
LEARNING OBJECTIVES
1. Develop a comprehensive understanding of the fundamental principles and concepts that form the foundation of sustainability within corporate environments.
2. Explore the sustainability implementation model, focusing on effective measures and reporting strategies to track and communicate sustainability efforts.
3. Identify and define best practices and critical success factors essential for achieving sustainability goals within organizations.
CONTENTS
1. Introduction and Key Concepts of Sustainability
2. Principles and Practices of Sustainability
3. Measures and Reporting in Sustainability
4. Sustainability Implementation & Best Practices
To download the complete presentation, visit: https://www.oeconsulting.com.sg/training-presentations
Improving profitability for small businessBen Wann
In this comprehensive presentation, we will explore strategies and practical tips for enhancing profitability in small businesses. Tailored to meet the unique challenges faced by small enterprises, this session covers various aspects that directly impact the bottom line. Attendees will learn how to optimize operational efficiency, manage expenses, and increase revenue through innovative marketing and customer engagement techniques.
LA HUG - Video Testimonials with Chynna Morgan - June 2024Lital Barkan
Have you ever heard that user-generated content or video testimonials can take your brand to the next level? We will explore how you can effectively use video testimonials to leverage and boost your sales, content strategy, and increase your CRM data.🤯
We will dig deeper into:
1. How to capture video testimonials that convert from your audience 🎥
2. How to leverage your testimonials to boost your sales 💲
3. How you can capture more CRM data to understand your audience better through video testimonials. 📊
RMD24 | Debunking the non-endemic revenue myth Marvin Vacquier Droop | First ...BBPMedia1
Marvin neemt je in deze presentatie mee in de voordelen van non-endemic advertising op retail media netwerken. Hij brengt ook de uitdagingen in beeld die de markt op dit moment heeft op het gebied van retail media voor niet-leveranciers.
Retail media wordt gezien als het nieuwe advertising-medium en ook mediabureaus richten massaal retail media-afdelingen op. Merken die niet in de betreffende winkel liggen staan ook nog niet in de rij om op de retail media netwerken te adverteren. Marvin belicht de uitdagingen die er zijn om echt aansluiting te vinden op die markt van non-endemic advertising.
At Techbox Square, in Singapore, we're not just creative web designers and developers, we're the driving force behind your brand identity. Contact us today.
The key differences between the MDR and IVDR in the EUAllensmith572606
In the European Union (EU), two significant regulations have been introduced to enhance the safety and effectiveness of medical devices – the In Vitro Diagnostic Regulation (IVDR) and the Medical Device Regulation (MDR).
https://mavenprofserv.com/comparison-and-highlighting-of-the-key-differences-between-the-mdr-and-ivdr-in-the-eu/
Enterprise Excellence is Inclusive Excellence.pdfKaiNexus
Enterprise excellence and inclusive excellence are closely linked, and real-world challenges have shown that both are essential to the success of any organization. To achieve enterprise excellence, organizations must focus on improving their operations and processes while creating an inclusive environment that engages everyone. In this interactive session, the facilitator will highlight commonly established business practices and how they limit our ability to engage everyone every day. More importantly, though, participants will likely gain increased awareness of what we can do differently to maximize enterprise excellence through deliberate inclusion.
What is Enterprise Excellence?
Enterprise Excellence is a holistic approach that's aimed at achieving world-class performance across all aspects of the organization.
What might I learn?
A way to engage all in creating Inclusive Excellence. Lessons from the US military and their parallels to the story of Harry Potter. How belt systems and CI teams can destroy inclusive practices. How leadership language invites people to the party. There are three things leaders can do to engage everyone every day: maximizing psychological safety to create environments where folks learn, contribute, and challenge the status quo.
Who might benefit? Anyone and everyone leading folks from the shop floor to top floor.
Dr. William Harvey is a seasoned Operations Leader with extensive experience in chemical processing, manufacturing, and operations management. At Michelman, he currently oversees multiple sites, leading teams in strategic planning and coaching/practicing continuous improvement. William is set to start his eighth year of teaching at the University of Cincinnati where he teaches marketing, finance, and management. William holds various certifications in change management, quality, leadership, operational excellence, team building, and DiSC, among others.
What is the TDS Return Filing Due Date for FY 2024-25.pdfseoforlegalpillers
It is crucial for the taxpayers to understand about the TDS Return Filing Due Date, so that they can fulfill your TDS obligations efficiently. Taxpayers can avoid penalties by sticking to the deadlines and by accurate filing of TDS. Timely filing of TDS will make sure about the availability of tax credits. You can also seek the professional guidance of experts like Legal Pillers for timely filing of the TDS Return.
The world of search engine optimization (SEO) is buzzing with discussions after Google confirmed that around 2,500 leaked internal documents related to its Search feature are indeed authentic. The revelation has sparked significant concerns within the SEO community. The leaked documents were initially reported by SEO experts Rand Fishkin and Mike King, igniting widespread analysis and discourse. For More Info:- https://news.arihantwebtech.com/search-disrupted-googles-leaked-documents-rock-the-seo-world/
Search Disrupted Google’s Leaked Documents Rock the SEO World.pdf
Strategy Planning and Deployment Process Training Module
1. 1
Strategy Planning & Deployment Process
by Operational Excellence Consulting LLC
4/9/2016 – v6.0
2. 2 4/9/2016 – v6.0
Strategic Planning and Deployment
Strategic Planning is a process whereby an organization makes
choices about:
Why do we exist ?
What are our major objectives and goals ?
In which markets will we compete ?
Who will be our Customers ?
How will we differentiate ourselves from our competition ?
What resources (people, processes, technology) do we need for
a successful future ?
3. 3 4/9/2016 – v6.0
Strategic Planning and Deployment - Facts
Only 5% of the workforce understands their company
strategy.
Only 25% of managers have incentives linked to
strategy.
60% of organizations don’t link budgets to strategy.
86% of executive teams spend less than one hour per
month discussing strategy.
– Source: Balanced Scorecard Collaborative
Strategy is an expression of what an organization intents to do to get from a
current state to a future state. Strategy is often expressed in terms of a mission
and vision statement, initiatives, objectives and goals. It is usually developed at
the top levels of the organization, but executed by lower levels within the
organization.
4. 4 4/9/2016 - v6.0
Strategic Planning and Deployment
Discussion Question:
1. Most organizations tend to have
good strategic plans, but they fail to
successfully implement them.
Identify at least two reasons why
organizations fail to implement
their strategic plans?
5. 5 4/9/2016 – v6.0
Strategic Planning and Deployment - The Non-Strategy Issue
by John S. Hamalian
Lack of a proper strategy is a serious problem that can result in ad hoc improvements that don't
contribute to the organization’s overall needs.
Non-Strategy #1: ‘The Wall Placard Strategy’
Some organizations will go to great lengths to create great Vision and Mission statements, but then
their planning stops there.
Non-Strategy #2: ‘The Stratospheric Strategy’
These strategies start in the clouds and they never come down, making them extremely difficult to
make actionable. The result will usually be some nice slick-looking verbiage for the organization’s
website and annual reports.
Non-Strategy #3: ‘The KPI Strategy’
When asked to present their strategies, some organizations excitedly pull out a beautiful
PowerPoint slide that states their goals in terms of a metric. Examples are ‘double revenue in three
years’ or ‘achieve 20% margin by 2013’. This is not a strategy.
Non-Strategy #4: ‘The Govern-less Strategy’
Some strategies are actually quite well constructed, but they miss one crucial element: a
governance process. A strategy is worthless unless it has a clear process on who will lead the
reviews, what specifically will be covered and what the frequency will be.
6. 6 4/9/2016 - v6.0
Strategic Planning and Deployment
According to the Balanced Scorecard Collaborative,
there are four barriers to strategic implementation:
1. Vision Barrier – No one in the organization
understands the strategic objectives and goals of the
organization.
2. People Barrier – Most people have objectives that
are not linked to the strategy of the organization.
3. Resource Barrier – Time, energy, and money are
not allocated to those things that are critical to the
organization. For example, budgets are not linked to
strategy, resulting in wasted resources.
4. Management Barrier – Management spends too
little time on strategy and too much time on short-term
tactical decision-making.
7. 7 4/9/2016 - v6.0
The 3 Value Propositions or Disciplines
Market leaders choose to excel in delivering extraordinary levels of
one of these three value propositions, while maintaining
reasonable standards in the other disciplines.
Organizations pursuing an Operational Excellence strategy, strive
to deliver a combination of quality, price, and ease of purchase
and service that no other organization in their market or industry
can match.
Operational Excellence: Companies that emphasize operational efficiency usually
provide certain value attributes, such as competitive pricing, on-time delivery, or superb
quality.
Customer Intimacy: Other companies may create value for customers through their
great relationship with the customer.
Product Leadership: Finally, some companies may add value by emphasizing innovative
and unique products and / or services.
8. 8 4/9/2016 - v6.0
The Four Building Blocks of Operational Excellence
Achieving Operational Excellence requires the successful implementation of a
integrated Business Execution System that effectively and seamlessly
integrates the following four building blocks: Strategy Deployment,
Performance Management, Process Excellence, and High Performance
Work Teams.
Strategy or Policy Deployment
is the process that aligns and
links business strategy and
execution.
Performance Management is
the process that translates
strategic initiatives into
measurable objectives and
goals.
Operational Excellence can
be achieved and sustained
with the right attitude, the
right mindset, and the right
competencies.
Well designed, efficient, and
effective Management, Value
Chain, and Support Processes
are necessary to deliver world-
class results.
Strategy
Deployment
Performance
Management
High Performance
Work Teams
Process
Excellence
Operational Excellence
Business Execution
System
9. 9 4/9/2016 - v6.0
Strategic Planning & Deployment – Table of Content
Strategic Planning & Deployment Process
Organizing the Process
Current State Analysis (CSA)
Strategic Vision Elements
Strategic Breakthrough Objectives
Strategic Initiatives & Tactics
Strategy Deployment Matrix
Strategy Implementation & Review
10. 10 4/9/2016 - v6.0
Strategy Planning & Deployment – Organize the Process
Phase III – Strategic Vision Elements
Phase IV – Strategic Breakthrough Objectives
Phase II – Current State Analysis (CSA)
Phase I – Organize the Process
Phase V – Strategic Initiatives & Tactics
Phase VI – Strategy Implementation & Review
11. 11 4/9/2016 - v6.0
Strategic Planning & Deployment – Table of Content
Strategic Planning & Deployment Process
Organizing the Process
Current State Analysis (CSA)
Strategic Vision Elements
Strategic Breakthrough Objectives
Strategic Initiatives & Tactics
Strategy Deployment Matrix
Strategy Implementation & Review
12. 12 4/9/2016 - v6.0
Organizing the Process
Preparing the Strategy Planning Process includes:
Who internally will facilitate/manage the Strategy Planning and Deployment Process?
Decide if an external resource is needed to assist with the Strategy Planning Process
Determine the scope (organization, planning period, …) of the strategic plan
Who will be involved in the Strategy Planning Process?
Determine the key planning steps, responsibilities, timelines, … of the Strategy
Planning Process
Agree on terminology and definitions
What are the expected outcomes and deliverables?
Summarize current plans, vision, mission, and performance
Prepare inputs for Current State Analysis (CSA) phase
Communicate the overall approach and process to the organization
…
13. 13 4/9/2016 - v6.0
Strategic Planning & Deployment – Terminology Part I
Mission: A brief description of a company's fundamental purpose. A mission statement
answers the question, "Why do we exist?“.
Vision: An overall statement of how the organization wants to be perceived by it’s
stakeholders over the long-term (3 to 5 years).
Strategic Goal: A statement of an overall achievement that is considered critical to the
future success of the organization. Strategic goals express where the organization wants to
be.
Strategic Objective: What specifically must be done to execute the strategy; i.e. what is
critical to the future success of our strategy? What the organization must do to reach its
strategic goals! Another term for objectives within a strategic planning framework is to call
these "enabling goals", since they will contribute to the achievement of the larger strategic
goal they enable.
Strategic Initiative: A major strategic thrust for the organization, such as maximizing
shareholder value or improving the efficiency of operations. Strategic initiatives define the
scope for building the performance management system.
14. 14 4/9/2016 - v6.0
Strategic Planning & Deployment – Terminology Part II
Strategic Grid - Strategy Map: A logical framework for organizing a collection of strategic
objectives over four or more dimensions. Everything is linked to capture a cause and effect
relationship. Strategic grids are the foundation for building the Balanced Scorecard.
Dimensions or Perspectives: Four or more different views of what drives the organization.
Perspectives provide a framework for measurement. The four most common perspectives
are: Financials (final outcomes), Customers, “Internal” Processes, and Learning & Growth.
Cause & Effect Relationship: The natural flow of business performance from a lower level
to an upper level within or between dimensions. For example, training employees on
customer relation’s leads to better customer service which in turn leads to improved
financial results. One side is the leader or driver, producing an end result or effect on the
other side.
Measurement or Metrics: A way of monitoring and tracking the progress of strategic
objectives. Measurements can be leading indicators of performance (leads to an end result)
or lagging indicators (the end results).
Target: An expected level of performance or improvement required in the future.
Initiatives, Programs & Projects: Major initiatives, programs or projects that must be
undertaken in order to meet one or more strategic objectives.
15. 15
Strategic Planning: Vision, Goals & Objectives
Goal #1: Land on the moon and return
safely to earth by the end of the decade.
…
Vision: Have the most advance
and successful Space Program
in the world.
Objective #1.1
Develop safe launch and
reentry vehicles
Objective #1.x
Maintain a ground
infrastructure
16. 16 4/9/2016 - v6.0
Organizing the Process – Summary
Inputs:
• Vision (if available)
• Mission (if available)
• Last Year’s Strategic Plan (if
available)
• …
Activities:
• Define Scope
• Define Planning Horizon
• Define Resource
Requirements
• Define Terminology
• …
Outputs:
• Strategy Process
Owner
• Strategy Process
Facilitator
• Strategic Planning
Terminology
• High-Level Planning
Process Timelines
• Strategy Development
Team Members
• ...
Strategic Planning -
Organizing the Process
17. 17 4/9/2016 - v6.0
Strategic Planning & Deployment – Table of Content
Strategic Planning & Deployment Process
Organizing the Process
Current State Analysis (CSA)
Strategic Vision Elements
Strategic Breakthrough Objectives
Strategic Initiatives & Tactics
Strategy Deployment Matrix
Strategy Implementation & Review
18. 18 4/9/2016 - v6.0
Current State Analysis (CSA) – Making Choices
As part of this process step, the organization has to take a HARD look at itself.
Where are we going ?
Where can we go ?
Where are we now ?
What are our choices ?
Markets
Competitors
Technology
Trends
Customers
Strength &
Weaknesses
Distribution
Channels
External
Factors
19. 19 4/9/2016 - v6.0
Strategy Planning & Deployment – Business Excellence Models
Some organizations are using Business Excellence Models like the Malcolm Baldrige
Criteria to structure their Current State Analysis and assess themselves against a well
established performance excellence benchmark.
20. 20 4/9/2016 - v6.0
Strategy Planning & Deployment – Business Excellence Models
Leadership: How upper management leads the organization, and how the organization
leads within the community.
Strategic Planning: How the organization establishes and plans to implement strategic
directions.
Customer and Market Focus: How the organization builds and maintains strong, lasting
relationships with customers.
Measurement, Analysis, and Knowledge Management: How the organization uses data
to support key processes and manage performance.
Human Resource Focus: How the organization empowers and involves its workforce.
Process Management: How the organization designs, manages and improves key
processes.
Business/Organizational Performance Results: How the organization performs in terms
of customer satisfaction, finances, human resources, supplier and partner performance,
operations, governance and social responsibility, and how the organization compares to its
competitors.
21. 21 4/9/2016 - v6.0
Strategy Planning & Deployment – Current State Analysis
Leadership
“The Driver”
Customer
“The Focus”
“The System”
Process
Management
People
Operating Philosophy: Leaders build their business
system so that it focuses on the customer and delivers
excellent results.
The business system is a set of processes that
work together to produce an output that meets or
exceeds the requirements of its customers.
22. 22 4/9/2016 - v6.0
Enterprise Business Process Modeling
Enterprise Business Process Modeling (BPM) is the activity of representing processes, and
their interrelationships, of an enterprise, so that the current ("as is") process may be analyzed
and improved in future ("to be").
American Productivity & Quality Center (APQC) Process Categories
1 Develop Vision and Strategy
2 Develop and Manage Products and Services
3 Market and Sell Products and Services
4 Deliver Products and Services
5 Manage Customer Service
6 Develop and Manage Human Capital
7 Manage Information Technology
8 Manage Financial Resources
9 Acquire, Construct, and Manage Property
10 Manage Environmental Health and Safety (EHS)
11 Manage External Relationships
12 Manage Knowledge, Improvement, and Change
23. 23 4/9/2016 - v6.0
Enterprise Business Process Modeling – APQC Model
American Productivity & Quality Center (APQC) Process Categories
1 Develop Vision and Strategy
2 Develop and Manage Products and Services
3 Market and Sell Products and Services
4 Deliver Products and Services
5 Manage Customer Service
6 Develop and Manage Human Capital
7 Manage Information Technology
8 Manage Financial Resources
9 Acquire, Construct, and Manage Property
10 Manage Environmental Health and Safety (EHS)
11 Manage External Relationships
12 Manage Knowledge, Improvement, and Change
1 Develop Vision and Strategy
1.1 Define the business concept and long-term vision
1.1.1 Assess the external environment
1.1.2 Survey market and determine customer needs and wants
1.1.3 Perform internal analysis
1.1.4 Establish strategic vision
1.2 Develop business strategy
1.2.1 Develop overall mission statement
1.2.2 Evaluate strategic options to achieve the objectives
1.2.3 Select long-term business strategy
1.2.4 Coordinate and align functional and process strategies
1.2.5 Create organizational design (structure, governance, reporting, etc.)
1.2.6 Develop and set organizational goals
1.2.7 Formulate business unit strategies
1.3 Manage strategic initiatives
1.3.1 Develop strategic initiatives
1.3.2 Evaluate strategic initiatives
1.3.3 Select strategic initiatives
1.3.4 Establish high-level measures
24. 24 4/9/2016 - v6.0
Strategy Planning & Deployment – Current State Analysis
Inputs to a comprehensive Current State Analysis (CSA) include:
Organization’s Mission and Vision (if available)
Organization’s Values (if available)
Current Strategic Goals and Objectives (if available)
Actual Performance vs. Planned Performance
Critical Success Metric Performance
Critical Process Management and Performance
Organizational Design – Structure and Roles
Employee Satisfaction, Competences and Capabilities
Customer Needs and Satisfaction
Current Products and Services Performance
Markets and Geographic Areas served
Distribution Channels
Competitor Analysis
STEEP Factors – Social, Technological, Economic, Environmental, Political
…
Leadership
“The Driver”
Customer
“The Focus”
“The System”
Process
Management
People
25. 25 4/9/2016 - v6.0
Tool Box: Brainstorming
Brainstorming is used to generate a large number of ideas in a short period of time.
Step 1: Review the topic or problem to be discussed. Make sure the entire
team understands the subject of the brainstorm. Clarify if you are looking for
potential root causes or possible solutions.
Step 2: Allow a couple of minutes for everyone to think about the task and
write down some ideas.
Step 3: Invite the team members to call out their ideas, randomly or in turns
around the table. Make sure that the team builds upon each others ideas (1 + 1
= 3), but do not allow discussions or evaluations.
Step 4: Record all ideas, e.g. on post-its, and stick them on a flip chart visible
to everyone.
Step 5: Continue with Step 3 and 4 until several minutes silence
produces no more.
26. 26 4/9/2016 - v6.0
Tool Box: Affinity Diagram
An Affinity Diagram organizes large numbers of
ideas or findings into their natural relationship
and taps the team’s creativity and intuition.
Step 1: Record each idea/finding on a separate
Post-It note and stick it to on a flip chart.
Step 2: Look for ideas/findings that seem to be
related and place then side by side, until all
ideas/findings are grouped. Very important is that
no one talk during this exercise.
Step 3: Select a heading for each group and
write it on a separate Post-It note. You can talk
during this step.
Step 4: Ensure that every idea/finding in a group
aligns with the heading. Make final adjustment if
necessary.
Quality is
becoming
globalized
Non-user
friendly
products are
unacceptable
Need for
providing
complete
service
Unreliability in
products is not
tolerated
TQM-aware
customers are
becoming
common
Demand for
high- quality,
low- cost goods
increasing
Technology is
no longer
“awe-inspiring”
Brand-
awareness does
not guarantee
customer loyalty
Market
different-
tiation is
becoming less
of an issue
Individual custom-
ization is
becoming
more of an issue
Need for
meeting all
requirements is
severe
Happy to pass
on good
product/ service
stories
Instant, intuitive
usability
becoming
requirement
Local service
must be available
immediately
Replacement
parts/ product
expected within
24 hours
Easily
contacted by
telephone or
fax
Extended
warranty
expected
Questions
answered
quickly and
correctly
Complete
customer
education/in for-
mation provided
Happier to pass
on poor
product/ service
stories
Low-tolerance
for inadequate
service; likely to
return prod
27. 27 4/9/2016 - v6.0
Tool Box: SWOT Analysis
A SWOT Analysis is an examination of the internal strengths (S), weaknesses (W),
external opportunities (O), and threats (T) affecting an organization.
Harmful
(to achieve future business success)
Helpful
(to achieve future business success)
InternalFactors
(attributesoftheorganization)
ExternalFactors
(attributesoftheenvironment)
S W
O T
Weakness
ThreatsOpportunities
Strength
28. 28 4/9/2016 - v6.0
Tool Box: SWOT Analysis
S W
O T
Strength:
• What advantages does your organization have?
• What do you do better than anyone else?
• What unique or lowest-cost resources can you
draw upon that others can't?
• What do people in your market see as your
strengths?
• What factors mean that you "get the sale"?
• What is your organization's Unique Selling
Proposition (USP)?
Opportunities:
• What good opportunities can you spot?
• What interesting trends are you aware of?
Useful opportunities can come from such things as:
• Changes in technology and markets on both a
broad and narrow scale.
• Changes in government policy related to your field.
• Changes in social patterns, population profiles,
lifestyle changes, and so on.
• Local events.
Weaknesses:
• What could you improve?
• What should you avoid?
• What are people in your market likely to see as
weaknesses?
• What factors lose you sales?
• Do other people seem to perceive weaknesses
that you don't see?
• Are your competitors doing any better than you?
Threats
• What obstacles do you face?
• What are your competitors doing?
• Are quality standards or specifications for your
job, products or services changing?
• Is changing technology threatening your
position?
• Do you have bad debt or cash-flow problems?
• Could any of your weaknesses seriously
threaten your business?
29. 29 4/9/2016 - v6.0
Tool Box: Criticality Matrix
A Criticality Matrix is a useful tool to assess and visualize the “Significance” and
“Probability of Occurrence” for potential or perceived threats (T) identified during the
development of the SWOT Analysis.
Most Current State Analysis will generate 8 – 12 critical issues that will need to be
considered during the strategic planning process.
Probability of
Occurrence High Medium Low
High
Medium
Low
CRITICALITY ANALYSIS
Significance
30. 30 4/9/2016 - v6.0
Group Work: Current State Analysis
The Task:
Perform a Current State Analysis for your
organization and document your key findings
using the “Strategy Deployment - Current
State Analysis” worksheet.
Make a list of any open issues that require
additional research, data and/or analysis.
Assign individuals to each action item and
agree on a timeline.
Develop a SWOT Matrix, including a review of
your organization's Core Competencies,
capturing the key findings of your Current
State Analysis. Utilize Affinity Diagrams to
consolidate and group your findings if needed.
Agree on the next steps to complete the
Current State Analysis phase
31. 31 4/9/2016 - v6.0
Current State Analysis (CSA) – Summary
Inputs:
• Current Strategic Goals and
Objectives (if available)
• Actual vs. Planned Performance
for Key Performance Indicators
• Enterprise Process Architecture
• Organizational Design
• Customer Needs and Satisfaction
• Current Products / Services
Performance
• Markets and Distribution Channels
• Competitor Analysis
• STEEP Factors
• …
Activities:
• SWOT Analysis
• …
Outputs:
• SWOT Analysis
• TOP 10-12 Critical
Issues & Challenges
• …
Strategic Planning –
Current State Analysis
32. 32 4/9/2016 - v6.0
Strategic Planning & Deployment – Table of Content
Strategic Planning & Deployment Process
Organizing the Process
Current State Analysis (CSA)
Strategic Vision Elements
Strategic Breakthrough Objectives
Strategic Initiatives & Tactics
Strategy Deployment Matrix
Strategy Implementation & Review
33. 33 4/9/2016 - v6.0
Characteristics of a Good Vision
A Vision should meet several tests:
A Vision is grounded in the reality of the organization’s Current State;
meaning, it recognizes challenges that the organization now faces as
having somehow been resolved in the ideal future.
A Vision creates some significant problems and challenges for the
organization.
A Vision must reflect the interests of the organization’s stakeholders
(owners, employees, customers, suppliers).
A Vision should be the result of the integrated thinking of the
leadership team, rather then a collection of individual visions, means
it is indeed a Shared Vision.
Most organizations prefer a finite time-frame of a vision, usually three to five
years.
34. 34 4/9/2016 - v6.0
The Visioning Process – The Vision Question
The first step in the process is to develop a “Vision Question”
Strategic Vision Question: “It is 2014 and we are very pleased with
out strategic success; what do we look like and how did we get there?”
Strategic Vision Question: “It is 2014 and we are the market leader in
our industry; what do we look like and how did we get there?”
Tactical Vision Question: “We have designed the ideal Employee
Survey Process; what does it look like and what effect is it having on the
organization?”
Tactical Vision Question: “We are one of the
most desired organizations to work for; how do we
look like and how did we get there?”
35. 35 4/9/2016 - v6.0
Tool Box: Affinity Diagram
An Affinity Diagram organizes large numbers of
ideas or findings into their natural relationship
and taps the team’s creativity and intuition.
Step 1: Record each idea/finding on a separate
Post-It note and stick it to on a flip chart.
Step 2: Look for ideas/findings that seem to be
related and place then side by side, until all
ideas/findings are grouped. Very important is that
no one talk during this exercise.
Step 3: Select a heading for each group and
write it on a separate Post-It note. You can talk
during this step.
Step 4: Ensure that every idea/finding in a group
aligns with the heading. Make final adjustment if
necessary.
Quality is
becoming
globalized
Non-user
friendly
products are
unacceptable
Need for
providing
complete
service
Unreliability in
products is not
tolerated
TQM-aware
customers are
becoming
common
Demand for
high- quality,
low- cost goods
increasing
Technology is
no longer
“awe-inspiring”
Brand-
awareness does
not guarantee
customer loyalty
Market
different-
tiation is
becoming less
of an issue
Individual custom-
ization is
becoming
more of an issue
Need for
meeting all
requirements is
severe
Happy to pass
on good
product/ service
stories
Instant, intuitive
usability
becoming
requirement
Local service
must be available
immediately
Replacement
parts/ product
expected within
24 hours
Easily
contacted by
telephone or
fax
Extended
warranty
expected
Questions
answered
quickly and
correctly
Complete
customer
education/in for-
mation provided
Happier to pass
on poor
product/ service
stories
Low-tolerance
for inadequate
service; likely to
return prod
Vision Elements
36. 36 4/9/2016 - v6.0
Strategic Planning – Importance of a Communication Plan
“I sure wish I’d done a better job of
communicating with GM people. I’d do that
differently a second time around and make
sure they understand and shared my vision for
the company. Then they would know why I was
tearing the place up, taking out whole divisions, changing our whole
production structure . . . I never got this across.”
Roger Smith, CEO of General Motors (1981 - 1990)
37. 37 4/9/2016 - v6.0
The Visioning Process - Catchball
The Vision must be “bought into” by all members of the organization.
An effective way to do this is to share the Vision as an Affinity
Diagram with all other members of the organization, and encourage
additions to the preliminary version, e.g. in form of additional Post-
itsTM in a different color.
Link this process step with a strategic planning road show to explain
the overall planning process to your organization.
38. 38 4/9/2016 - v6.0
The Visioning Process - Vision Statement
The Vision as presented in an Affinity Diagram can be converted into a Vision
Statement by simply incorporating the information in the group headers in to a
narrative or outline “bullet” form.
Microsoft - "A personal computer in every home running Microsoft software.“
Coca-Cola - Our vision serves as the framework for our Roadmap and guides
every aspect of our business by describing what we need to accomplish in order to
continue achieving sustainable, quality growth.
People: Be a great place to work where people are inspired to be the best they can be.
Partners: Nurture a winning network of customers and suppliers, together we create
mutual, enduring value.
Planet: Be a responsible citizen that makes a difference by helping build and support
sustainable communities.
Profit: Maximize long-term return to shareowners while being mindful of our overall
responsibilities.
Productivity: Be a highly effective, lean and fast-moving organization.
39. 39 4/9/2016 - v6.0
Group Work: The Visioning Process
The Task:
Create a “Vision Question” for your organization.
As a team, brainstorm answers to the Vision
Question and record them on Post-itsTM with a bold
pen. The usual rules of brainstorming apply.
Place the Post-itsTM on a flip chart and develop an
Affinity Diagram to synthesize the high level Vision
Elements.
Agree on the next steps to communicate the Affinity
Diagram and Vision Elements, e.g. strategic
planning road show.
Agree on a timeline to create a vision statement
from the Vision Elements for your organization.
40. 40 4/9/2016 - v6.0
Strategic Vision Elements – Summary
Inputs:
• SWOT Analysis
• TOP 10-12 Critical Issues &
Challenges
• …
Activities:
• Develop Vision Question(s)
• Identify Vision Elements
• Communicate Vision
Elements
• Finalize Vision Elements
• Create Vision Statement
• …
Outputs:
• Vision Elements
• Vision Statement
• …
Strategic Planning –
Strategic Vision Elements
41. 41 4/9/2016 - v6.0
Strategic Planning & Deployment – Table of Content
Strategic Planning & Deployment Process
Organizing the Process
Current State Analysis (CSA)
Strategic Vision Elements
Strategic Breakthrough Objectives
Strategic Initiatives & Tactics
Strategy Deployment Matrix
Strategy Implementation & Review
42. 42 4/9/2016 - v6.0
Strategic Objectives – Alignment & Correlation Matrix
One of the biggest mistakes organizations make is failing to focus on
the high-leverage actions that really make a difference in the
organization’s long-term competitiveness.
43. 43 4/9/2016 - v6.0
Tool Box: Strategic Grid Correlation Matrix
The Strategic Grid Correlation Matrix is a tool an organization can use to assess and visualize the
correlation between its core processes & key performance indicators and the defined vision elements.
Core processes with a strong correlation to the identified vision elements need to be highlighted and if
necessary improved or reengineered to ensure long-term competitiveness.
DevelopVisionandStrategy
MarketandSellProductsandServices
DeliverProductsandServices
ManageCustomerService
DevelopandManageHumanCapital
ManageInformationTechnology
ManageFinancialResources
Acquire,Construct,andManageProperty
ManageEnvironmentalHealthandSafety(EHS)
ManageExternalRelationships
ManageKnowledge,Improvement,andChange
Financials
Customer
InternalBusinessProcesses
Learning&Growth
Vision Element #1
No Correlation
Vision Element #2
Vision Element #3
Weak Correlation
Vision Element #4
Vision Element #5
Medium Correlation
Vision Element #6
Vision Element #7
Strong Correlation
Vision Element #8
Critical Processes
To what extent do our Critical Processes support our Vision Elements?
20xx
Vision Elements
Critical Success Metrics
How well do we measure the Vision Elements?
44. 44 4/9/2016 - v6.0
Tool Box: Strategic Grid Alignment Matrix
The Strategic Grid Alignment Matrix is a tool an organization can use to assess and visualize that existing
or planned initiatives drive defined vision elements and that selected key performance indicators are actual
relevant to ensure long-term competitiveness.
Project#1
Project#2
Project#3
Project#4
Project#5
Project#6
Project#7
Project#8
Project#9
Project#10
Project#11
Financials
Customer
InternalBusinessProcesses
Learning&Growth
Vision Element #1
No Correlation
Vision Element #2
Vision Element #3
Weak Correlation
Vision Element #4
Vision Element #5
Medium Correlation
Vision Element #6
Vision Element #7
Strong Correlation
Vision Element #8
Programs and Projects
How well do our programs and projects support our Vision Elements?
20xx
Vision Elements
Critical Success Metrics
How well do we measure the Vision Elements?
45. 45
Tool Box: Radar Chart
A Radar Chart can be used to assess the gap separating the desired future state from the
current reality with respect to each Vision Element.
• Each of the “Assessors” defines the gap
between the future vs. current state for
each Vision Element on a scale from “0”
to “10”, with “0” representing total lack of
the specific Vision Element and “10”
representing “perfect” current
performance.
• The “green” radar plots represent the
individual scores from each assessor for
each Vision Element.
• Vision Elements with a large variation
between the individual scores require
further analysis, as this indicates
significant differences in opinions.
• The “red” radar plot represents the
average score for each Vision Element.
• Vision Elements with the lowest average
scores are candidates for breakthrough
objectives.
Vision Element Gap Analysis
0
1
2
3
4
5
6
7
8
9
10
Vision Element #1
Vision Element #2
Vision Element #3
Vision Element #4
Vision Element #5
Vision Element #6
Vision Element #7
Vision Element #8
Vision Element #9
Vision Element #10
Vision Element #11
Vision Element #12
4/9/2016 - v6.0
46. 46 4/9/2016 - v6.0
Tool Box: Interrelationships Diagram
The interrelationship diagram is an
additional tool that can be used to identify
or verify potential breakthrough
objectives.
Step 1: Place all Vision Elements in a
circle on a flip chart.
Step 2: For each idea, ask “Does this
Vision Element cause or influence any
other Vision Element?”. Draw arrows
from each Vision Element to the ones it
causes or influences.
Step 3: Analyze the diagram by counting
how many arrows in and out each Vision
Element has. Note the number of
incoming and outgoing arrows for each
Vision Element “in/out”.
Step 4: Note which Vision Elements have
primarily outgoing arrows. These are the
basic causes and thus potential
candidates for breakthrough objectives.
3/3
5/0
2/1
5/1
0/5
1/3
2/2
0/5
3/1
Rejection of the
Statistical Thinking
Method
Lack of motivation
to change
Lack of support for
implementation
Lack of consensus
around the right
measurement indices
Data are not
easily accessible
Misunderstanding of
Statistical Thinking
Paradigm
Lack of
Statistical Thinking
Paradigm
Fear of technical
tools and methods
People have
competing
priorities
47. 47 4/9/2016 - v6.0
Group Work: Strategic Breakthrough Objectives
The Task:
If applicable, create a Strategic Grid Alignment Matrix
for your current Vision Elements/Strategic Objectives,
Key Performance Indicators and ongoing Programs/
Projects. Identify any misalignment or gaps.
Create a Strategic Grid Correlation Matrix for your new
Vision Elements, Core Processes and Balanced
Scorecard Dimensions. Document any key findings or
observations.
Perform an individual and team Gap Analysis using a
Radar Chart. Document any key findings and
discussion points, especially if the individual gap
analysis results show significant variation.
Create an Interrelationship Diagram for the new Vision
Elements. Identify the basic causes or vision drivers
and compare the results with the results from the Gap
Analysis. Document any key findings.
Define Strategic Breakthrough Objective(s)
49. 49 4/9/2016 - v6.0
Strategic Planning & Deployment – Table of Content
Strategic Planning & Deployment Process
Organizing the Process
Current State Analysis (CSA)
Strategic Vision Elements
Strategic Breakthrough Objectives
Strategic Initiatives & Tactics
Strategy Deployment Matrix
Strategy Implementation & Review
50. 50 4/9/2016 - v6.0
Developing First-Level Strategic Initiatives
The actions required to achieve a strategic objective are generally called
strategies or strategic initiatives.
The first step in developing strategic initiatives is to formulate an
appropriate question to brainstorm what needs to be done to achieve an
identified strategic objective.
The next step is to brainstorm answers to this question. Answers can
then be organized, grouped and titled utilizing the Affinity Diagram tool.
The team is then asked to examine the candidates for strategic
initiatives (usually the groups identified in the Affinity Diagram), and to
arrange them using a Tree Diagram.
Specially, the team is asked to form a judgment, using data if possible,
on whether each of the candidates is necessary to meet the objective.
51. 51
Strategic Focus Areas & Objectives
Strategic Breakthrough (Hoshin) Objective Strategic Focus Area(s)
By the year 2012, our organization will have the most
innovative product line of smart phones.
Product Innovation
By the year 2014, customer turnover will decline by 30%
through newly created customer service representatives
and pro-active customer maintenance procedures.
Customer Satisfaction
Customer Support Processes
Operating downtimes will get cut in half by cross training
front line personnel and combining all four operating
departments into one single service center.
Operational Efficiency
Competence Development
Organizational Design
Over the next six months, delivery times will decrease by
15% through more localized distribution centers.
Lead Time Reduction
Operational Efficiency
Distribution Management
Collectively, you want to limit our strategic objectives and focus areas to no more
than four to five. This helps ensure successful implementation of your organization’s
strategic vision. Some common strategic focus areas are: Customer Service, Shareholder
Value, Operational Efficiency, Product Innovation, and Social Responsibility.
52. 52
Strategic Focus Areas & Dimensions
Basic Flow of a Strategic Focus Area across the Balanced Scorecard Dimensions
Notice how each lower perspective layer supports and enables the upper perspective
layer; such as “Acquire More Customers” will enable “Revenue Growth”.
Keep in mind that we are trying to link everything together. This is critical to building
an effective Balanced Scorecard; i.e. capturing the cause & effect relationship.
Strategic Focus Area: Increase Shareholder Value
Financials Revenue Growth of 20% in 2014
Customers Acquire More Customers
“Internal”
Processes
Customer Marketing & Service Program
Learning &
Growth
Develop Support Systems & Personnel
Perspectives
53. 53
Strategic Grid & Model
Basic Flow of a Strategic Focus Area within the “Financials” Dimension
We will flow our strategic objectives down each balanced scorecard perspective
within a grid of boxes, making sure everything is linked. This grid will serve as the
foundation for constructing the Balanced Scorecard.
Strategic Focus Area: Increase Shareholder Value
Financials
Revenue Growth of 20% by 2014
Operating Cost Improvements of
15% by 2014
New Sources
of Revenue
Increase
Customer
Profitability
Lower
Operating
Costs
High Utilization
of Assets
54. 54
Strategic Grid & Model
Strategic Objectives defined for all Four Balanced Scorecard Dimensions
Strategic Focus Area: Increase Shareholder Value
Financials Revenue Growth of 20% by 2014
Customers
Acquire More Customers
Become the Price Leader
“Internal”
Processes
Improve Operational Efficiency
Cost Reduction
Program
Knowledge Based
System
Reduce
Non-Core Activities
Learning &
Growth
Training – Lean
Six Sigma
Program
Database Network
on Operational
Performance
Re-Align
Organization with
Core Competencies
Once you have completed the strategic grid, go back and make sure everything fits with your overall
strategy. A set of strategic grids should provide the strategic model for running the business, outlining the
specifics of the strategy. All stakeholders should be able to look at the grids and follow the flow of the
organization’s strategy.
DimensionsorPerspectives
55. 55 4/9/2016 - v6.0
Tool Box: Brainstorming
Brainstorming is used to generate a large number of ideas in a short period
of time.
Step 1: Review the topic or problem to be discussed. Make sure the entire
team understands the subject of the brainstorm. Clarify if you are looking for
potential root causes or possible solutions.
Step 2: Allow a couple of minutes for everyone to think about the task and
write down some ideas.
Step 3: Invite the team members to call out their ideas, randomly or in turns
around the table. Make sure that the team builds upon each others ideas (1
+ 1 = 3), but do not allow discussions or evaluations.
Step 4: Record all ideas, e.g. on post-its, and stick them
on a flip chart visible to everyone.
Step 5: Continue with Step 3 and 4 until several minutes
silence produces no more.
56. 56 4/9/2016 - v6.0
Tool Box: Affinity Diagram
An Affinity Diagram organizes large numbers of
ideas or findings into their natural relationship
and taps the team’s creativity and intuition.
Step 1: Record each idea/finding on a separate
Post-It note and stick it to on a flip chart.
Step 2: Look for ideas/findings that seem to be
related and place then side by side, until all
ideas/findings are grouped. Very important is that
no one talk during this exercise.
Step 3: Select a heading for each group and
write it on a separate Post-It note. You can talk
during this step.
Step 4: Ensure that every idea/finding in a group
aligns with the heading. Make final adjustment if
necessary.
Quality is
becoming
globalized
Non-user
friendly
products are
unacceptable
Need for
providing
complete
service
Unreliability in
products is not
tolerated
TQM-aware
customers are
becoming
common
Demand for
high- quality,
low- cost goods
increasing
Technology is
no longer
“awe-inspiring”
Brand-
awareness does
not guarantee
customer loyalty
Market
different-
tiation is
becoming less
of an issue
Individual custom-
ization is
becoming
more of an issue
Need for
meeting all
requirements is
severe
Happy to pass
on good
product/ service
stories
Instant, intuitive
usability
becoming
requirement
Local service
must be available
immediately
Replacement
parts/ product
expected within
24 hours
Easily
contacted by
telephone or
fax
Extended
warranty
expected
Questions
answered
quickly and
correctly
Complete
customer
education/in for-
mation provided
Happier to pass
on poor
product/ service
stories
Low-tolerance
for inadequate
service; likely to
return prod
Potential Strategic Initiatives
57. 57 4/9/2016 - v6.0
Tool Box: Tree Diagram
The Tree Diagram identifies initiatives and actions to solve a problem or implement a
solution. Developing the Tree Diagram moves and organization’s thinking logically
from broad objectives and goals to specific initiatives, projects and actions.
Strategic Objective
…
Potential Strategic Initiatives
…
…
…
…
…
…
IIIII
II
IIIIII
I
IIII
Multi-Voting
58. 58 4/9/2016 - v6.0
Tool Box: Multi-Voting
Multi-Voting narrows a large list of potential strategic initiatives to a smaller list of top
priorities or to a final selection. Multi-Voting is preferred over straight voting because it
allows an item that is favored by all, but not the top choice of any, to rise to the top.
Step 1: Identify a list of items through Brainstorming and organize the items into
groups or categories using an Affinity Diagram. Number all groups or categories.
Step 2: Decide how many choices each team member will vote for. That number
should be at least one-third the total number of items on the list.
Step 3: Each member writes down the number of his or her choices.
Step 4: Collect the papers and tally the votes.
Step 5: Reduce the list by eliminating the groups or categories
with the fewest votes. In most cases there is an obvious
difference between the “popular” few and the “unpopular” many.
Step 6: Repeat Step 2 to 5 with the reduced list. Continue until
clear favorites emerge that can be resources and managed.
Usually 2-4 initiatives for each strategic objective will be sufficient.
59. 59 4/9/2016 - v6.0
First-Level Strategic Initiatives
Strategic Goal
Become the Price Leader
Strategic Objective
Improve Operational
Efficiency
Metrics
Total Costs per Unit
Goal
< $15
Metrics
Productivity
Goal
> 15 Units per DL Manhour
Strategic Initiatives
Implement Cost Reduction Programs
Establish Lean Six Sigma Training Program
Develop & Implement company-wide
Database on Operational Performance
Make – Buy Analysis for Forward Logistics,
Reverse Logistics and Customer Service
Reduce Bill of Material Costs
Create Cost Management Competence
Development Plan for all Management Teams
Often, there will be dependencies among the different strategic
initiatives, means, some might need to be completed before others
can be initiated. It is useful to lay out these dependencies on a
timeline.
IIIII III
IIIII I
III
IIIII III
IIIII
II
60. 60 4/9/2016 - v6.0
Strategic Objective Strategic Initiatives Owners Measures Goals
Measure #1: …
Goal: …
Measure #2: …
Goal: …
Measure #3: …
Goal: …
Deployment of First-Level Strategic Initiatives
First-Level
Strategic Initiatives
In many organizations the executive or management team would “hand-off” the
first-level plan at this point of time and expect the organization(s) to somehow
execute the strategic intent of the planning team.
61. 61 4/9/2016 - v6.0
Deployment of First-Level Strategic Initiatives
In many organizations the executive or management team would “hand-off” the
first-level plan at this point of time and expect the organization(s) to somehow
execute the strategic intent of the planning team.
It is a known empiric fact that strategic plans without tactical detail don’t usually
get implemented very well, sometimes not at all.
To deploy the first-level strategic initiatives successfully, supporting initiatives
and finally actionable tactics need to be identified and defined.
To ensure proper alignment of an organization’s strategic objectives, strategic
initiatives, key performance indicators, key action items and human resources,
the “Catchball” Process and the “Hoshin X-Matrix” will be introduced over the
following slides.
63. 63 4/9/2016 - v6.0
Deployment of First-Level Strategic Initiatives (Catchball)
The “Catchball” Process
Tactics can be accomplished through a series of meetings at successively lower levels of the
organization.
A very effective way to create the tactical detail is to use the brainstorming method with Post-its that we
used during prior process steps. The strategy owner and the implementation team should do the
brainstorming together.
After the brainstorming, the team arranges the Post-its on a timeline corresponding to the expected
completion time-frame, in their logical order of completion.
Once tactics have been defined, the plan needs to be reviewed starting at the bottom of the
organization, working up until the entire plan has been reviewed and is judged to be visible and self-
consistent. Interdependencies, means that the completion of one task is required before another task
can be started, need to be identified and visualized.
Results of the “Catchball” Process can be documented using the “Annual Plan Template”
The “Catchball” Process is the biggest difference between Hoshin Planning and Management-by-
Objectives (MBO).
The Strategic Planning Process using Hoshin Planning isn’t complete until the strategic objectives and
all initiatives and tactics are agreed to and thought to be visible and self-consistent by the entire
organization.
64. 64 4/9/2016 - v6.0
Risk Assessment & Contingency Planning
The development of a “Process Decision Program” can help to identify execution risks
and improves the likelihood that the implementation plan will succeed.
What can go wrong with "Implementation of a Lean Six Sigma Program in Manufacturing".
Probability Severity P x S
1. Selecting the wrong candidates for training 7 7 49
2. Selecting the wrong projects 4 4 16
3. No or limited champion support 5 7 35
4. Takes too long to see results 6 10 60
5. Not enough time to do proper training 8 5 40
Brainstorm on Post-its
What can we do about "Selecting the wrong candidates for the training"?
Brainstormed Answers:
Develop candidate
selection criteria
Formalize candidate
interviewing process
Identify pre-requisites and
develop a test as part of
the selection process
…
Make sure that the identified risk mitigation activities are include into the overall
implementation plan for the strategic initiative.
67. 67 4/9/2016 - v6.0
Group Work: Strategic Initiatives & Tactics
The Task:
Formulate an appropriate question to brainstorm
what needs to be done to achieve an identified
strategic breakthrough objective.
Brainstorm answers to this question. Organize,
group and title answers utilizing the Affinity
Diagram tool.
Arrange the potential initiatives (usually the
groups identified in the Affinity Diagram) using a
Tree Diagram.
Narrow down the number of initiatives to the vital
few using data if possible and multi-voting
techniques.
Develop second- and third-level strategic
initiatives and tactics.
68. 68 4/9/2016 - v6.0
Strategic Initiatives & Tactics – Summary
Inputs:
• SWOT Analysis
• TOP 10-12 Critical Issues &
Challenges
• Vision Elements
• Vision Statement
• Strategic Breakthrough
Objectives
• …
Activities:
• Brainstorm needs to achieve
an identified strategic
breakthrough objective
• Arrange the potential
initiatives using a Tree
Diagram
• Narrow down the number of
initiatives to the vital few
• Develop second- and third-
level strategic initiatives and
tactics
• …
Outputs:
• First-, second- and third-
level strategic initiatives
and tactics
• …
Strategic Planning –
Strategic Initiatives & Tactics
69. 69 4/9/2016 - v6.0
Strategic Planning & Deployment – Table of Content
Strategic Planning & Deployment Process
Organizing the Process
Current State Analysis (CSA)
Strategic Vision Elements
Strategic Breakthrough Objectives
Strategic Initiatives & Tactics
Strategy Deployment Matrix
Strategy Implementation & Review
70. 70
Balanced Scorecard – Key Performance Indicators
Strategic Focus Area: Increase Shareholder Value
Financials Revenue Growth of 20% by 2014
Customers
Acquire More Customers
Become the Price Leader
“Internal”
Processes
Improve Operational Efficiency
Cost Reduction
Program
Knowledge Based
System
Reduce
Non-Core Activities
Learning &
Growth
Training – Lean
Six Sigma
Program
Database Network
on Operational
Performance
Re-Align
Organization with
Core Competencies
For each objective on your strategic grids, you need at least one performance indicator.
Can you have an objective without a performance indicator? Yes, it is possible, but not
having a measurement makes it difficult to manage the objective. It’s best to revisit this
objective and ask the question: Why is this an objective?
DimensionsorPerspectives
71. 71
How do we measure Performance?
Try to balance your Performance Indicators:
Do it fast.
Do it right.
Do it on time.
Keep doing it.
72. 72
Balanced Scorecard – Leading & Lagging Indicators
The other side of measurement is looking back, historical type measurements
that show a final outcome or result. These measurements are referred to as
lagging indicators and they dominate most performance measurement
systems.
Examples include most financial type measurements (return on equity, sales
growth, etc.) and many non-financial type measurements (production
breakeven, customer retention, employee productivity index, etc.).
Lagging type measurements are common within the “Customers” and
“Financials” dimensions since these are outcome related.
73. 73
Balanced Scorecard – Leading & Lagging Indicators
Some measurements will lead to change in your organization. These types of
measurements are called leading indicators since they drive final outcomes
within the organization.
Examples include customer contracts executed, service response time, and
time spent with customers.
A common place to use leading measurements is within the “Internal
Processes” and “Learning & Growth” dimensions.
74. 74
Balanced Scorecard – A Template
From: January 2010
ORGANIZATION: TBD Until: December 2010
Current Month: TBD 2010
KPI
KPI Name
(Unit)
KPI First Name
Champion Last Name
10 STRETCH
9
8
7 GOAL
6
5
4
3 BASE
2
1
0 ZERO
WEIGHT 0
2010 TOTAL SCORE
JANUARY
FEBRUARY
MARCH
APRIL
MAY
JUNE
JULY
AUGUST
SEPTEMBER
OCTOBER
NOVEMBER
DECEMBER
CURRENT SCORE 3 4 7 2 3 5 6 9
Stretch 2010 1000
Goal 2010 700
Base 2009 300
Actual 0
ORGANIZATION
OPERATIONAL EXCELLENCE BALANCED SCORECARD
FINANCIALS CUSTOMERS PROCESSES
RESULTS
1 2
5 7
4
12
11
8
9
3
6
10
75. 75 4/9/2016 - v6.0
The Strategy Deployment Hoshin X-Matrix
The Hoshin X-Matrix is a tool that visualizes an organization’s
strategic objectives,
strategic initiatives,
key performance indicators,
key projects & action items, and
human resources requirements
in one simple matrix.
The Hoshin X-Matrix enables an organization to easily review the alignment of
its strategic objectives, strategic initiatives, key performance indicators, key
action items and human resources.
The Hoshin X-Matrix, if used properly, improves the likelihood of a successful
execution of the strategic plan.
7. …
x 6. Initiate RFQ Process for Cusromer Service x x
x x 5. Implement reliability program for new products x x x x
x x 4. Establish LSS Balck Belt project for return drivers x x x x
x 3. Establish & train order-to-cash process team x
x 2. Identify Lean Six Sigma consulting company x x
x 1. Define Lean Six Sigma Program x x x
QualityManager
SystemTestManager
SystemsEngineeringManager
CustomerSupportManager
…
x $15M in annualized cost savings in 2012 x x x x x
x Order-to-Cash cycle time reduction of 25% x x
x DSO reduction from 90 days to 45 days x x
x x Return Rate reduction from 15% to less than 8% x x x
…
Resource Planning
Operational Excellence Consulting Strategy Deployment Matrix 2012
3.ResolveTOP3productreturndrivers
4.Improveproductverificationandvalidation
5.OutsourceCustomerServicefunction
6.…
2.ReduceDSOfrom90daystolessthan45
days
1.ReduceOperatingCostsby15%
1.ImplementaLeanSixSigmaProgram
2.Map&streamlineorder-to-cashprocess
Rev: <Rev#> Revised: <Date> Author: <Name> Status: Draft - Not Released
4.…
3.ImproveNetPromotorScoreto+50%
Measures & Targets
Action Items
StrategicInitiatives
StrategicObjectives
Measures & Targets
Action Items
StrategicInitiatives
StrategicObjectives
76. 76 4/9/2016 - v6.0
7. …
x 6. Initiate RFQ Process for Customer Service x x
x x 5. Implement reliability program for new products x x x x
x x 4. Establish LSS Black Belt project for return drivers x x x x
x 3. Establish & train order-to-cash process team x
x 2. Identify Lean Six Sigma consulting company x x
x 1. Define Lean Six Sigma Program x x x
QualityManager
SystemTestManager
SystemsEngineeringManager
CustomerSupportManager
…
x $15M in annualized cost savings in 2012 x x x x x
x Order-to-Cash cycle time reduction of 25% x x
x DSO reduction from 90 days to 45 days x x
x x Return Rate reduction from 15% to less than 8% x x x
…
Rev: <Rev#> Revised: <Date> Author: <Name> Status: Draft - Not Released
4.…
3.ImproveNetPromoterScoreto+50%
2.ReduceDSOfrom90daystolessthan45
days
1.ReduceOperatingCostsby15%
1.ImplementaLeanSixSigmaProgram
2.Map&streamlineorder-to-cashprocess
Resource Planning
Operational Excellence Consulting Strategy Deployment Matrix 2012
3.ResolveTOP3productreturndrivers
4.Improveproductverificationandvalidation
5.OutsourceCustomerServicefunction
6.…
Measures & Targets
Action Items
StrategicInitiatives
StrategicObjectives
Measures & Targets
Action Items
StrategicInitiatives
StrategicObjectives
The Strategy Deployment Hoshin X-Matrix
Organization’s
Strategic
Objectives &
Goals
Organization’s Key
Performance Indicator
(Balanced Scorecard)
Organization’s
Strategic Initiatives &
Tactics
Organization’s Tactical
Projects & Action
Items
Organization’s Human
Resource Allocation
77. 77 4/9/2016 - v6.0
7. …
x 6. Initiate RFQ Process for Customer Service x x
x x 5. Implement reliability program for new products x x x x
x x 4. Establish LSS Black Belt project for return drivers x x x x
x 3. Establish & train order-to-cash process team x
x 2. Identify Lean Six Sigma consulting company x x
x 1. Define Lean Six Sigma Program x x x
QualityManager
SystemTestManager
SystemsEngineeringManager
CustomerSupportManager
…
x $15M in annualized cost savings in 2012 x x x x x
x Order-to-Cash cycle time reduction of 25% x x
x DSO reduction from 90 days to 45 days x x
x x Return Rate reduction from 15% to less than 8% x x x
…
Rev: <Rev#> Revised: <Date> Author: <Name> Status: Draft - Not Released
4.…
3.ImproveNetPromoterScoreto+50%
2.ReduceDSOfrom90daystolessthan45
days
1.ReduceOperatingCostsby15%
1.ImplementaLeanSixSigmaProgram
2.Map&streamlineorder-to-cashprocess
Resource Planning
Operational Excellence Consulting Strategy Deployment Matrix 2012
3.ResolveTOP3productreturndrivers
4.Improveproductverificationandvalidation
5.OutsourceCustomerServicefunction
6.…
Measures & Targets
Action Items
StrategicInitiatives
StrategicObjectives
Measures & Targets
Action Items
StrategicInitiatives
StrategicObjectives
The Strategy Deployment Hoshin X-Matrix
Are all Strategic Objectives
measured by Key
Performance Indicators?
Are all Key
Performance
Indicators driven by
Strategic Initiatives?
Are the Action Items
aligned with the
Strategic Objectives?
Are the Action Items
aligned with the
Strategic Initiatives?
Can all Action Items
be resourced with
existing Human
Resources?
78. 78 4/9/2016 - v6.0
Final Strategy Implementation Plan Review
After completion of the Hoshin X-Matrix and the approval of the final
implementation plan by the Strategy Planning Team, the plan should be
published and communicated to the organization, and the plan can be
implemented according to the timing described in the individual
implementation plans.
“I sure wish I’d done a better job of
communicating with GM people. I’d do that
differently a second time around and make
sure they understand and shared my vision for
the company. Then they would know why I was
tearing the place up, taking out whole divisions, changing our whole
production structure . . . I never got this across.”
Roger Smith, CEO of General Motors (1981 - 1990)
79. 79 4/9/2016 - v6.0
Group Work: Strategy Deployment Matrix
The Task:
Review and finalize strategic breakthrough
objectives and goals
Review and finalize strategic initiatives and tactics
Identify key performance indicators (KPIs) as they
relate to the identified strategic initiatives and
Tactics
Develop the organization’s Balanced Scorecard(s)
for critical KPIs with baseline, targets and stretch
goals
Identify key projects and activities
Define project leaders and resource requirements
(human and financial resources)
Develop and communicate Hoshin Kanri X-Matrix
Strategic Deployment Matrix
81. 81 4/9/2016 - v6.0
Strategic Planning & Deployment – Table of Content
Strategic Planning & Deployment Process
Organizing the Process
Current State Analysis (CSA)
Strategic Vision Elements
Strategic Breakthrough Objectives
Strategic Initiatives & Tactics
Strategy Deployment Matrix
Strategy Implementation & Review
82. 82 4/9/2016 - v6.0
The Strategy Deployment Review Process
Review Process Overview
Reviews need to be frequent to keep the implementation process “on track”
Reviews are the “Check” of the Plan-Do-Act-Check (PDCA) cycle
They evaluate the effectiveness of the action
What did you intent to accomplish (PLAN)
What did you actually accomplish? (DO)
How did the actual accomplishment compare with what you intended? (CHECK)
The Review Process is a self-evaluation process, where the strategy owners come to
the meeting to present the results of their self-evaluation of results for each strategic
initiative or tactic
Attendees are usually strategy or tactics owners and their immediate
teams
The agenda generally allows for a 10 to 15 minutes update on a
specific strategy or tactic followed by a 5 to 10 minutes discussion
83. 83
Date: ___/___/___ Owner: _________________ Year: _________
= Made
= Missed Reason for Deviation Reason for Deviation
Actual
Performance
GoalStrategic Initaitive or Tactic
4/9/2016 - v6.0
The Review Table
PLAN DO ACTCHECK
Preparing the Review Table is the responsibility of the strategy or tactic owner. He or she is
also responsible for preparing the analysis of the outcomes, on backup sheets.
84. 84
Date: ___/___/___ Owner: _________________ Year: _________
= Made
= Missed Reason for Deviation Corrective Measures and Implications
Actual
Performance
GoalStrategic Initaitive or Tactic
4/9/2016 - v6.0
The Review Table
Statement of the
Strategic Initiative
or Tactic
Numeric Goal for the
Strategic Initiative or
Tactic
Numeric Goal for the
Strategic Initiative or
Tactic
“Flag” if the Goal of the
Strategic Initiative or Tactic
was “Made” or “Missed”
Summary of the
reasons for a deviation
Summary of the intended
corrective actions to “get
back on track”
85. 85 4/9/2016 - v6.0
A few more things about the Review Table
Keep in mind that it is just as interesting to hear about successes as it is about
“misses”, and just as valuable to the organization
The “Reason for Deviation” column contains only a summary of the analysis. The
detailed analysis needs to be provided by the initiative owner as a separate document
Areas of analysis should include:
Tasks scheduled but not done
Tasks completed, but wrong or unexpected results
Motivation waning, e.g. wrong objectives, not worthy of effort and resources.
Flaw in selection process.
Ensure that things gone right are highlighted and standardized, e.g. “Best
Practices”
For “Misses” identify immediate countermeasures, as well as corrective and
preventive actions based on proper root cause analysis
87. 87 4/9/2016 - v6.0
Strategic Planning & Deployment – Table of Content
Strategic Planning & Deployment Process
Organizing the Process
Current State Analysis (CSA)
Strategic Vision Elements
Strategic Breakthrough Objectives
Strategic Initiatives & Tactics
Strategy Deployment Matrix
Strategy Implementation & Review
Final Multiple Choice Questions (optional)
88. 88 4/9/2016 - v6.0
Strategy Deployment Process – Review Question #1
Strategic Planning is a process whereby management makes choices
about overall direction. One such choice within strategic planning is
establishing the:
a. Goals of the organization
b. Financing of capital assets
c. Distribution of stock dividends
d. Election of Officers
A
89. 89 4/9/2016 - v6.0
Strategy Deployment Process – Review Question #2
Strategic Planning should be used for each of the following except for:
a. Finding a vision for the organization
b. Determining future strategies or objectives
c. Getting the organization out of crisis
d. Managing the long-term future
C
90. 90 4/9/2016 - v6.0
Strategy Deployment Process – Review Question #3
Strategic Planning can result in change and people often resist change.
People's resistance to change can be reduced by:
a. Making the planning process extremely formal.
b. Categorizing the process as re-engineering.
c. Making the process very experimental.
d. Getting people involved within the process.
D
What else can be done ?
91. 91 4/9/2016 - v6.0
Strategy Deployment Process – Review Question #4
The first real phase of strategic planning is:
a. Issuing the Draft Plan
b. Organizing the Process
c. Approving the Plan
d. Developing the Operating Plan
B
92. 92 4/9/2016 - v6.0
Strategy Deployment Process – Review Question #5
In what phase of strategic planning does identification of strengths and
weaknesses take place?
a. Organizing
b. Approval of the Plan
c. Current State Analysis
d. Implementation
C
93. 93 4/9/2016 - v6.0
Strategy Deployment Process – Review Question #6
A good mission statement should:
a. Be extremely specific for measurement
b. Have references to management
c. Outline the tactics of the organization
d. Set direction for the organization
D
94. 94 4/9/2016 - v6.0
Strategy Deployment Process – Review Question #7
Each of the following is important for developing strategic breakthrough
objectives except:
a. Tradeoffs between upper and lower management
b. How the organization got started
c. Review of available resources
d. Strengths and weaknesses of the organization
A
95. 95 4/9/2016 - v6.0
Strategy Deployment Process – Review Question #8
Marco Corporation has included the following statement within its strategic
plan: By December 31st, the Production Department will re-align the
Eastern Distribution System to better serve markets in Canada. This
statement is an example of a:
a. Strategic Goal
b. Mission Statement
c. Organizational Weakness
d. Principle or Value
A
96. 96 4/9/2016 - v6.0
Strategy Deployment Process – Review Question #9
To help manage unplanned events or "what if" type events, Operating
Plans should include:
a. Approvals by Shareholders
b. References to Old Plans
c. Contingency Plans
d. Profiles of the Organization
C
97. 97 4/9/2016 - v6.0
Strategic Planning & Deployment
The End …
“Perfection is not attainable, but if we chase perfection we can catch
excellence.” - Vince Lombardi
98. 98
Terms & Conditions
After you have downloaded the training material to your own
computer, you can change any part of the course material and
remove all logos and references to Operational Excellence
Consulting. You can share the material with your colleagues and
re-use it as you need. The main restriction is that you cannot
distribute, sell, rent or license the material as though it is your
own. These training course materials are for your — and
your organization's — usage only. Thank you.