Download as PDF, PPTX


![•
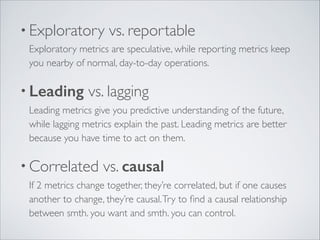
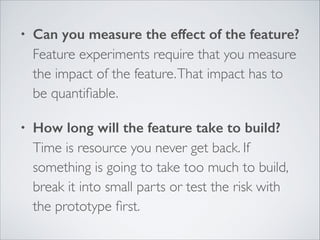
QRR(x) - the quarterly recurring revenue for
quarter x
•
QExpSM(x) - sales and marking expense for the
quarter x
•
Ratio of inputs to outputs (OMTM)
q = [QRR(x)-QRR(x-1)] / QExpSM(x-1)
You have problems if q < 0.75](https://image.slidesharecdn.com/leananalytics-131123183053-phpapp01/85/Lean-analytics-32-320.jpg)


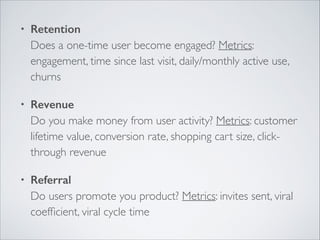
The document discusses lean analytics and lean principles for software development. It describes the main stages of product development - empathy, stickiness, virality, revenue, and scale. For each stage, it recommends key metrics to measure, such as daily/weekly active users for stickiness, viral coefficient for virality, and quarterly recurring revenue for revenue. It emphasizes focusing on one metric that matters the most for each stage, measuring assumptions in the right order, and using both qualitative and quantitative metrics for continuous learning and improvement.


![GUBI: Agile Analytics [pt-br]](https://cdn.slidesharecdn.com/ss_thumbnails/gubi-agileanalytics-160727182342-thumbnail.jpg?width=640&height=640&fit=bounds)