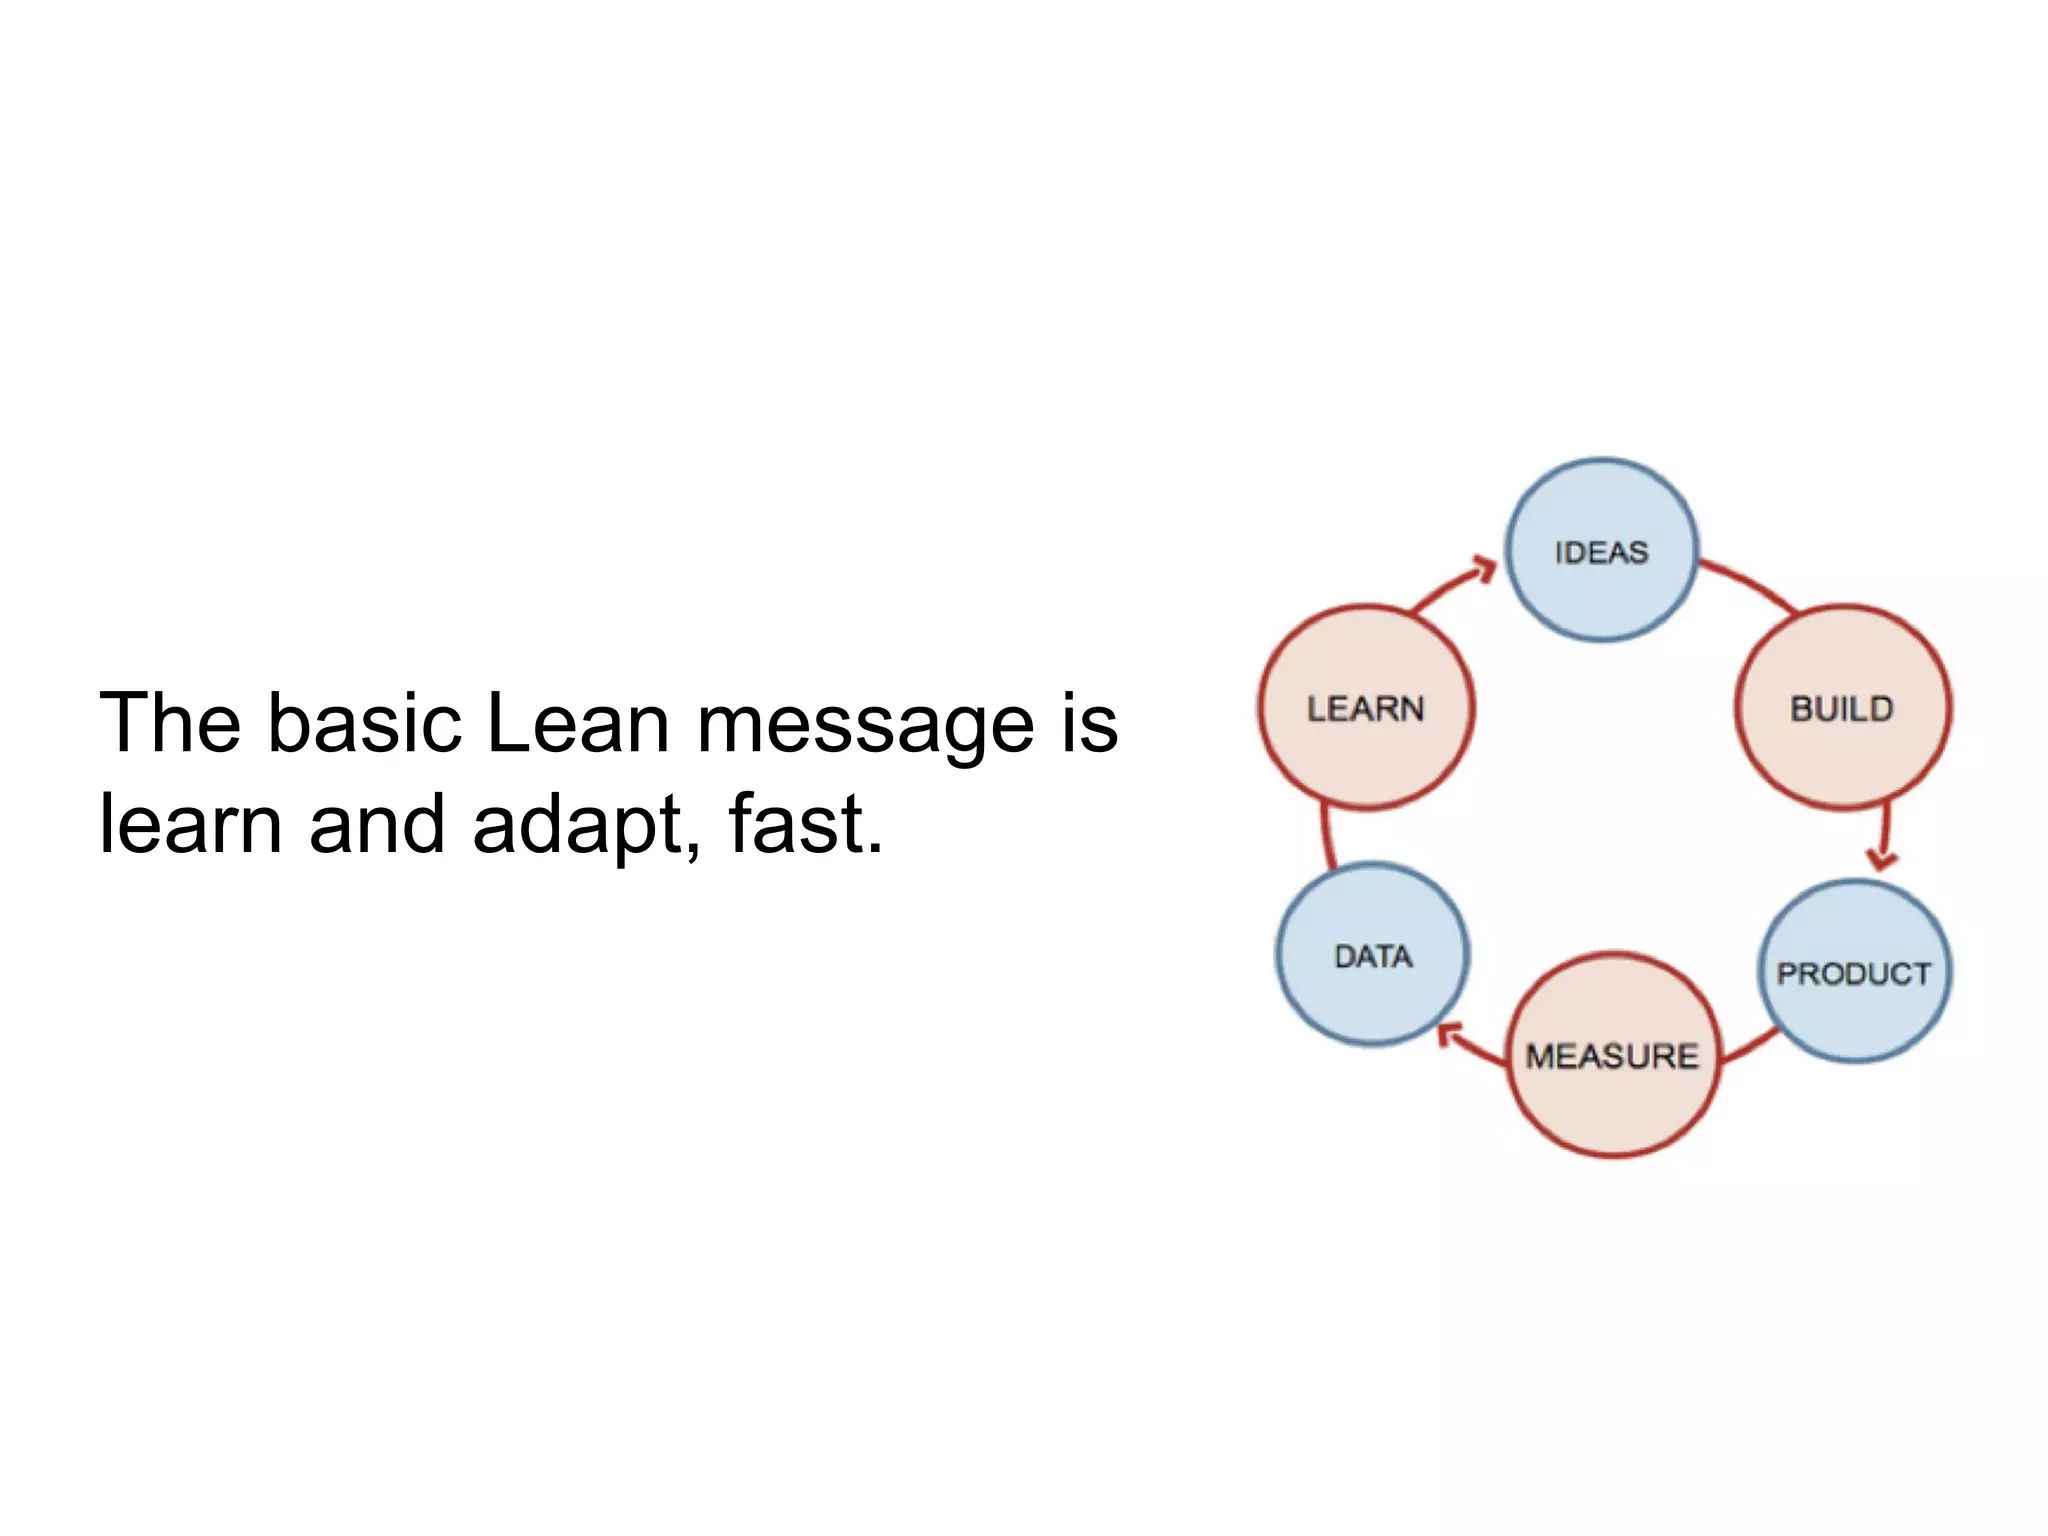
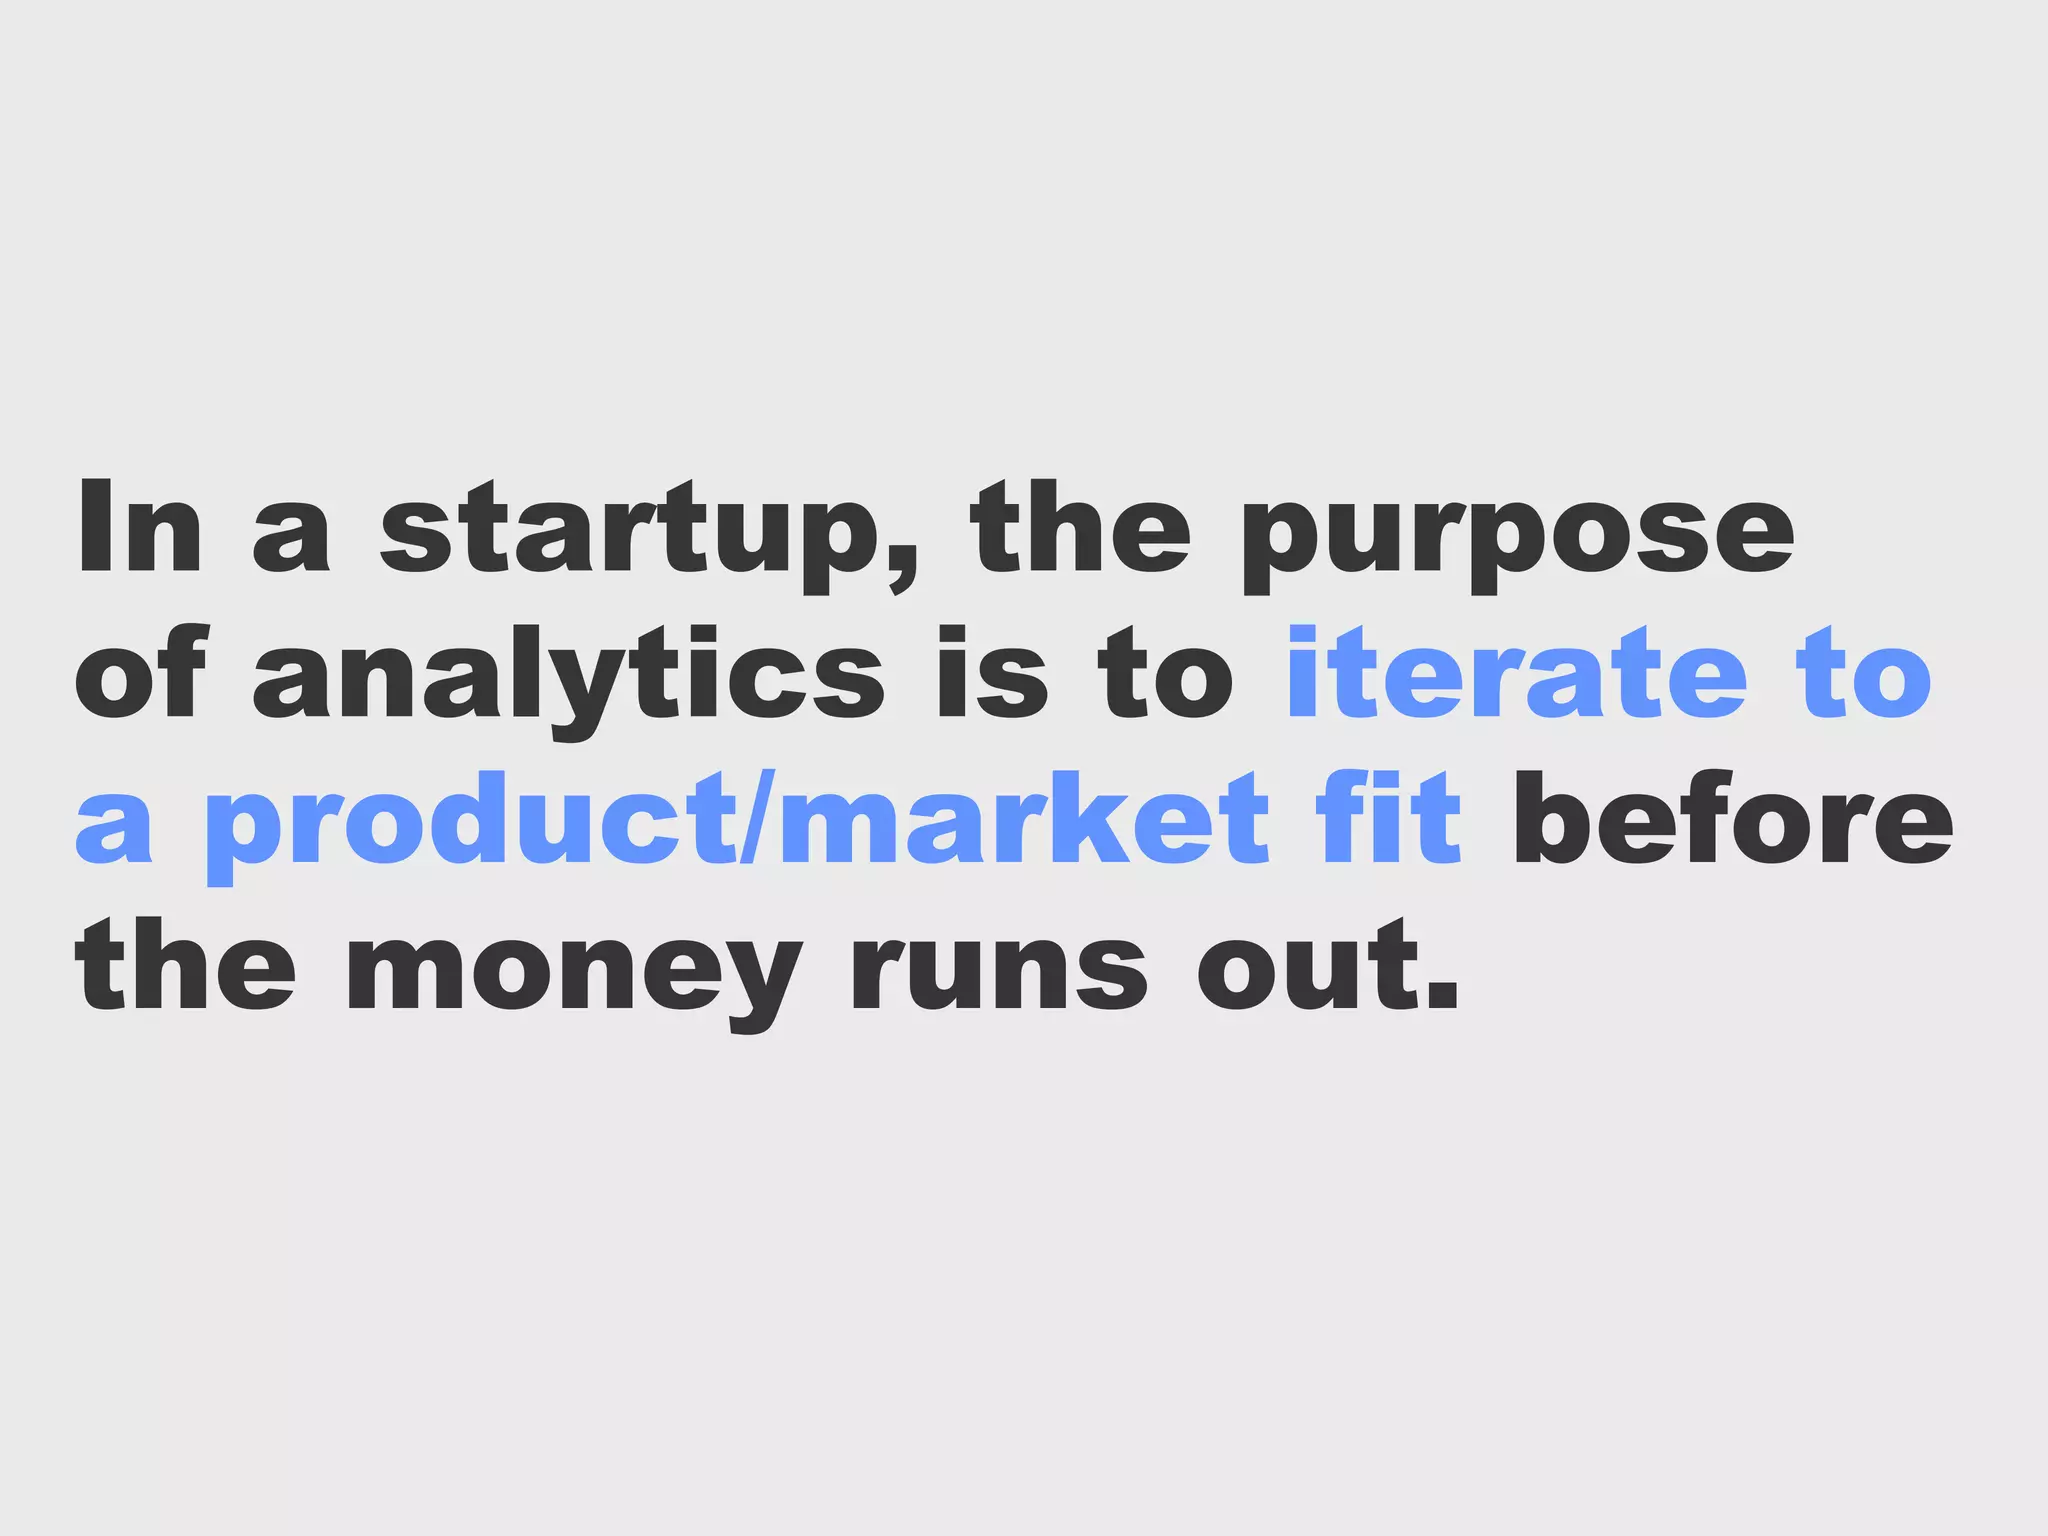
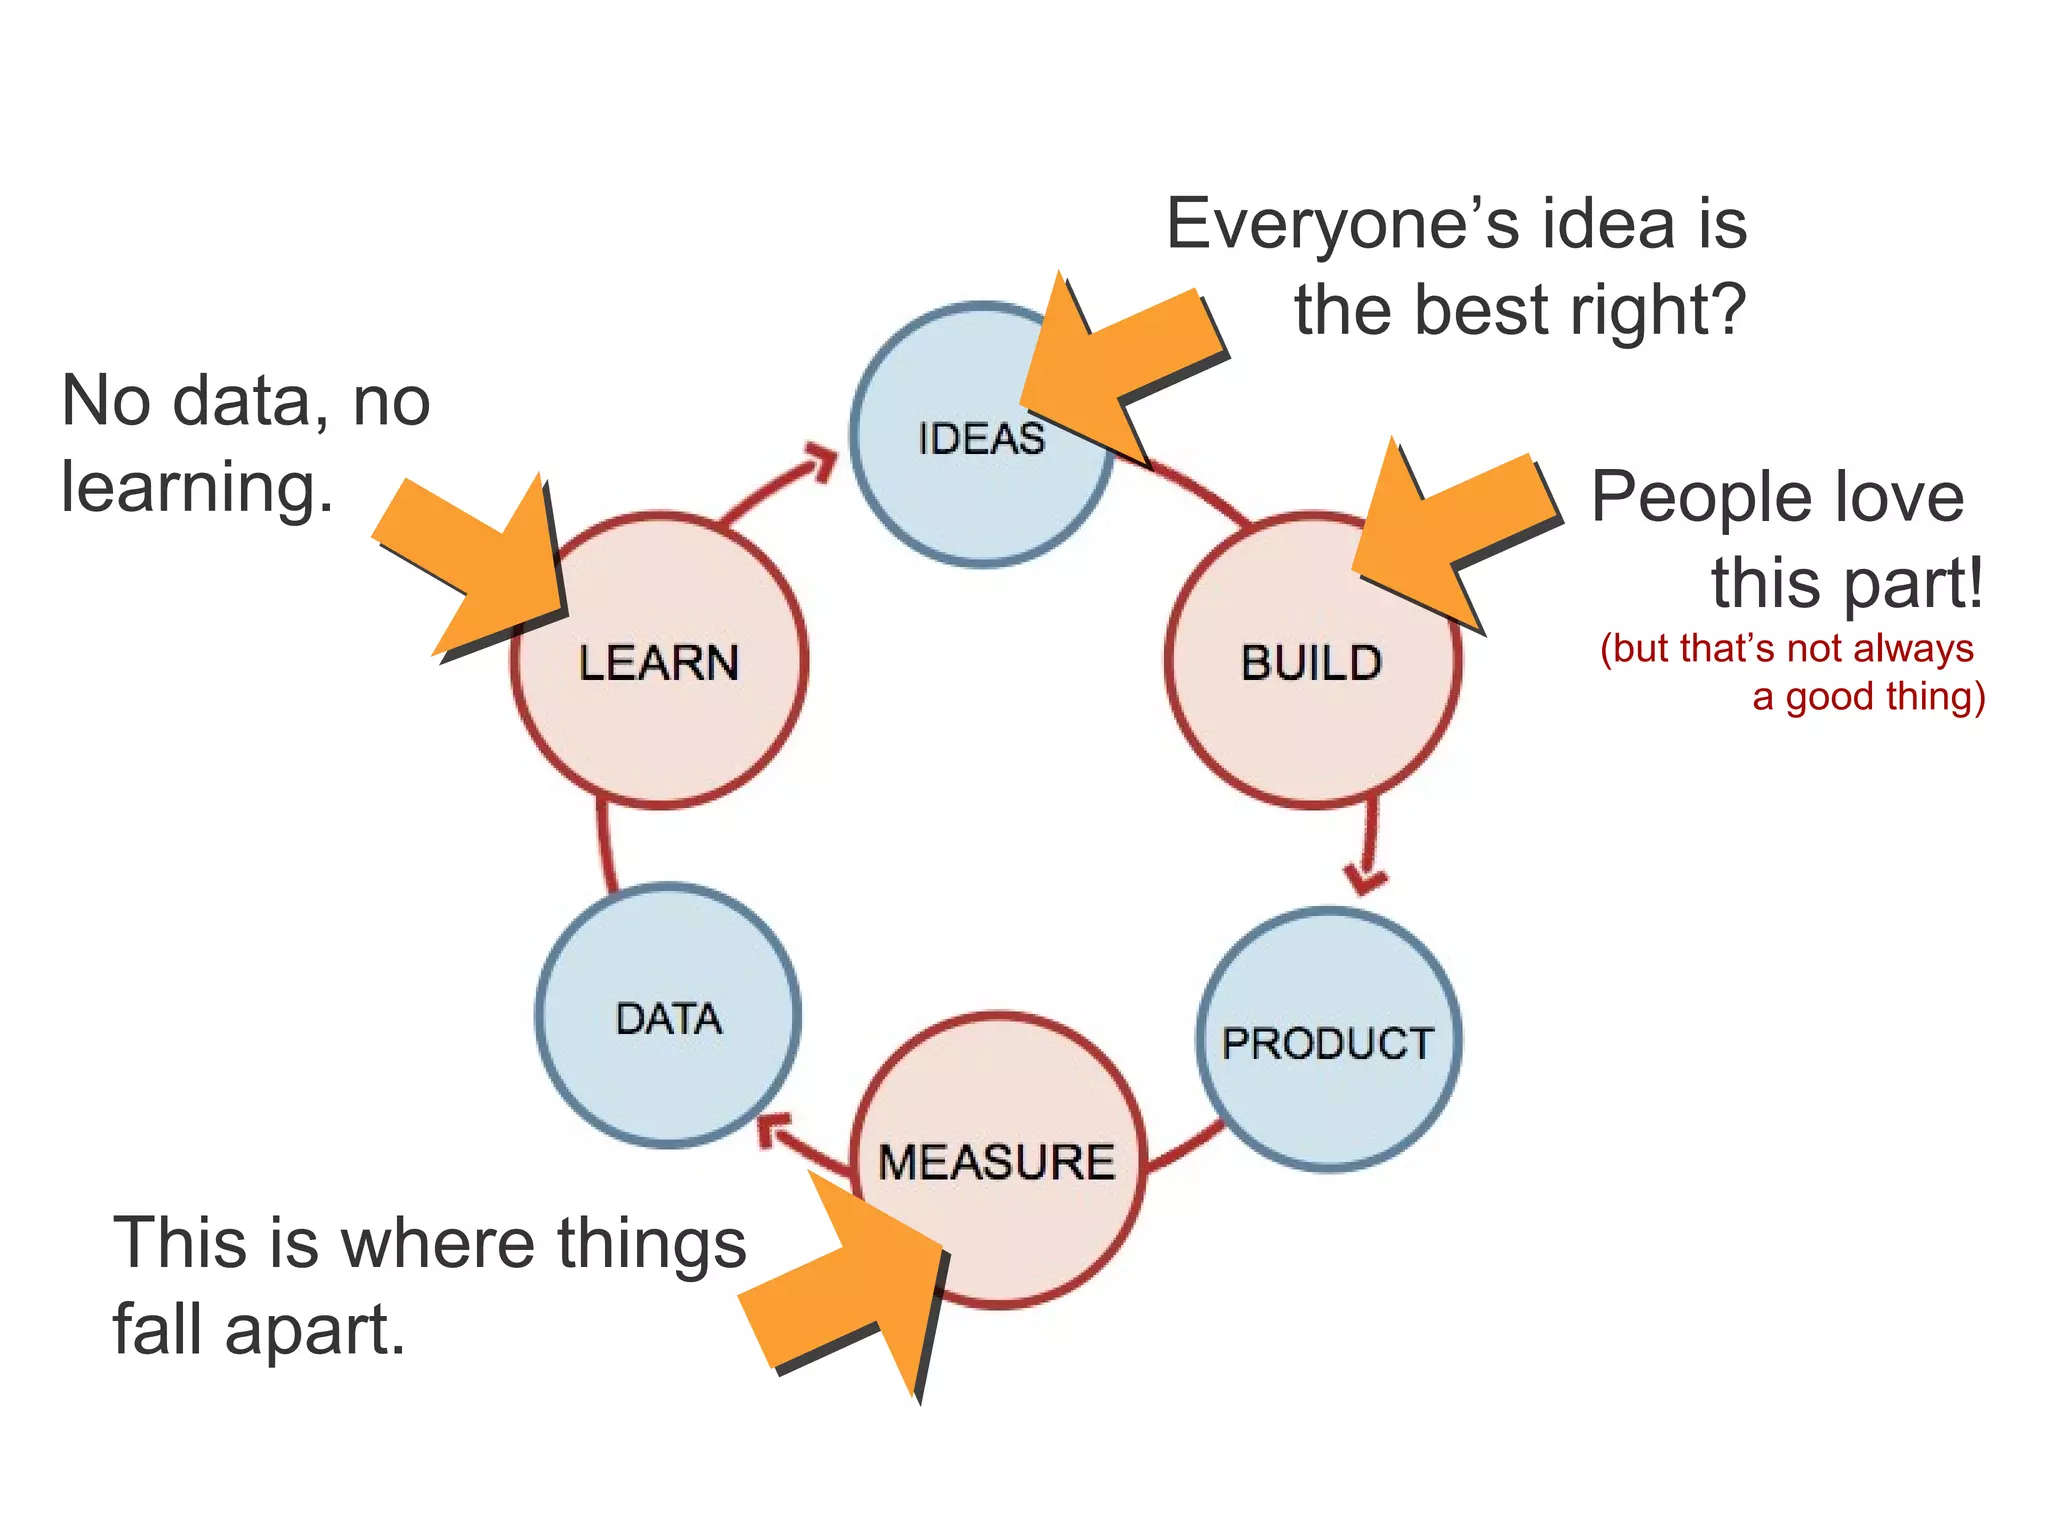
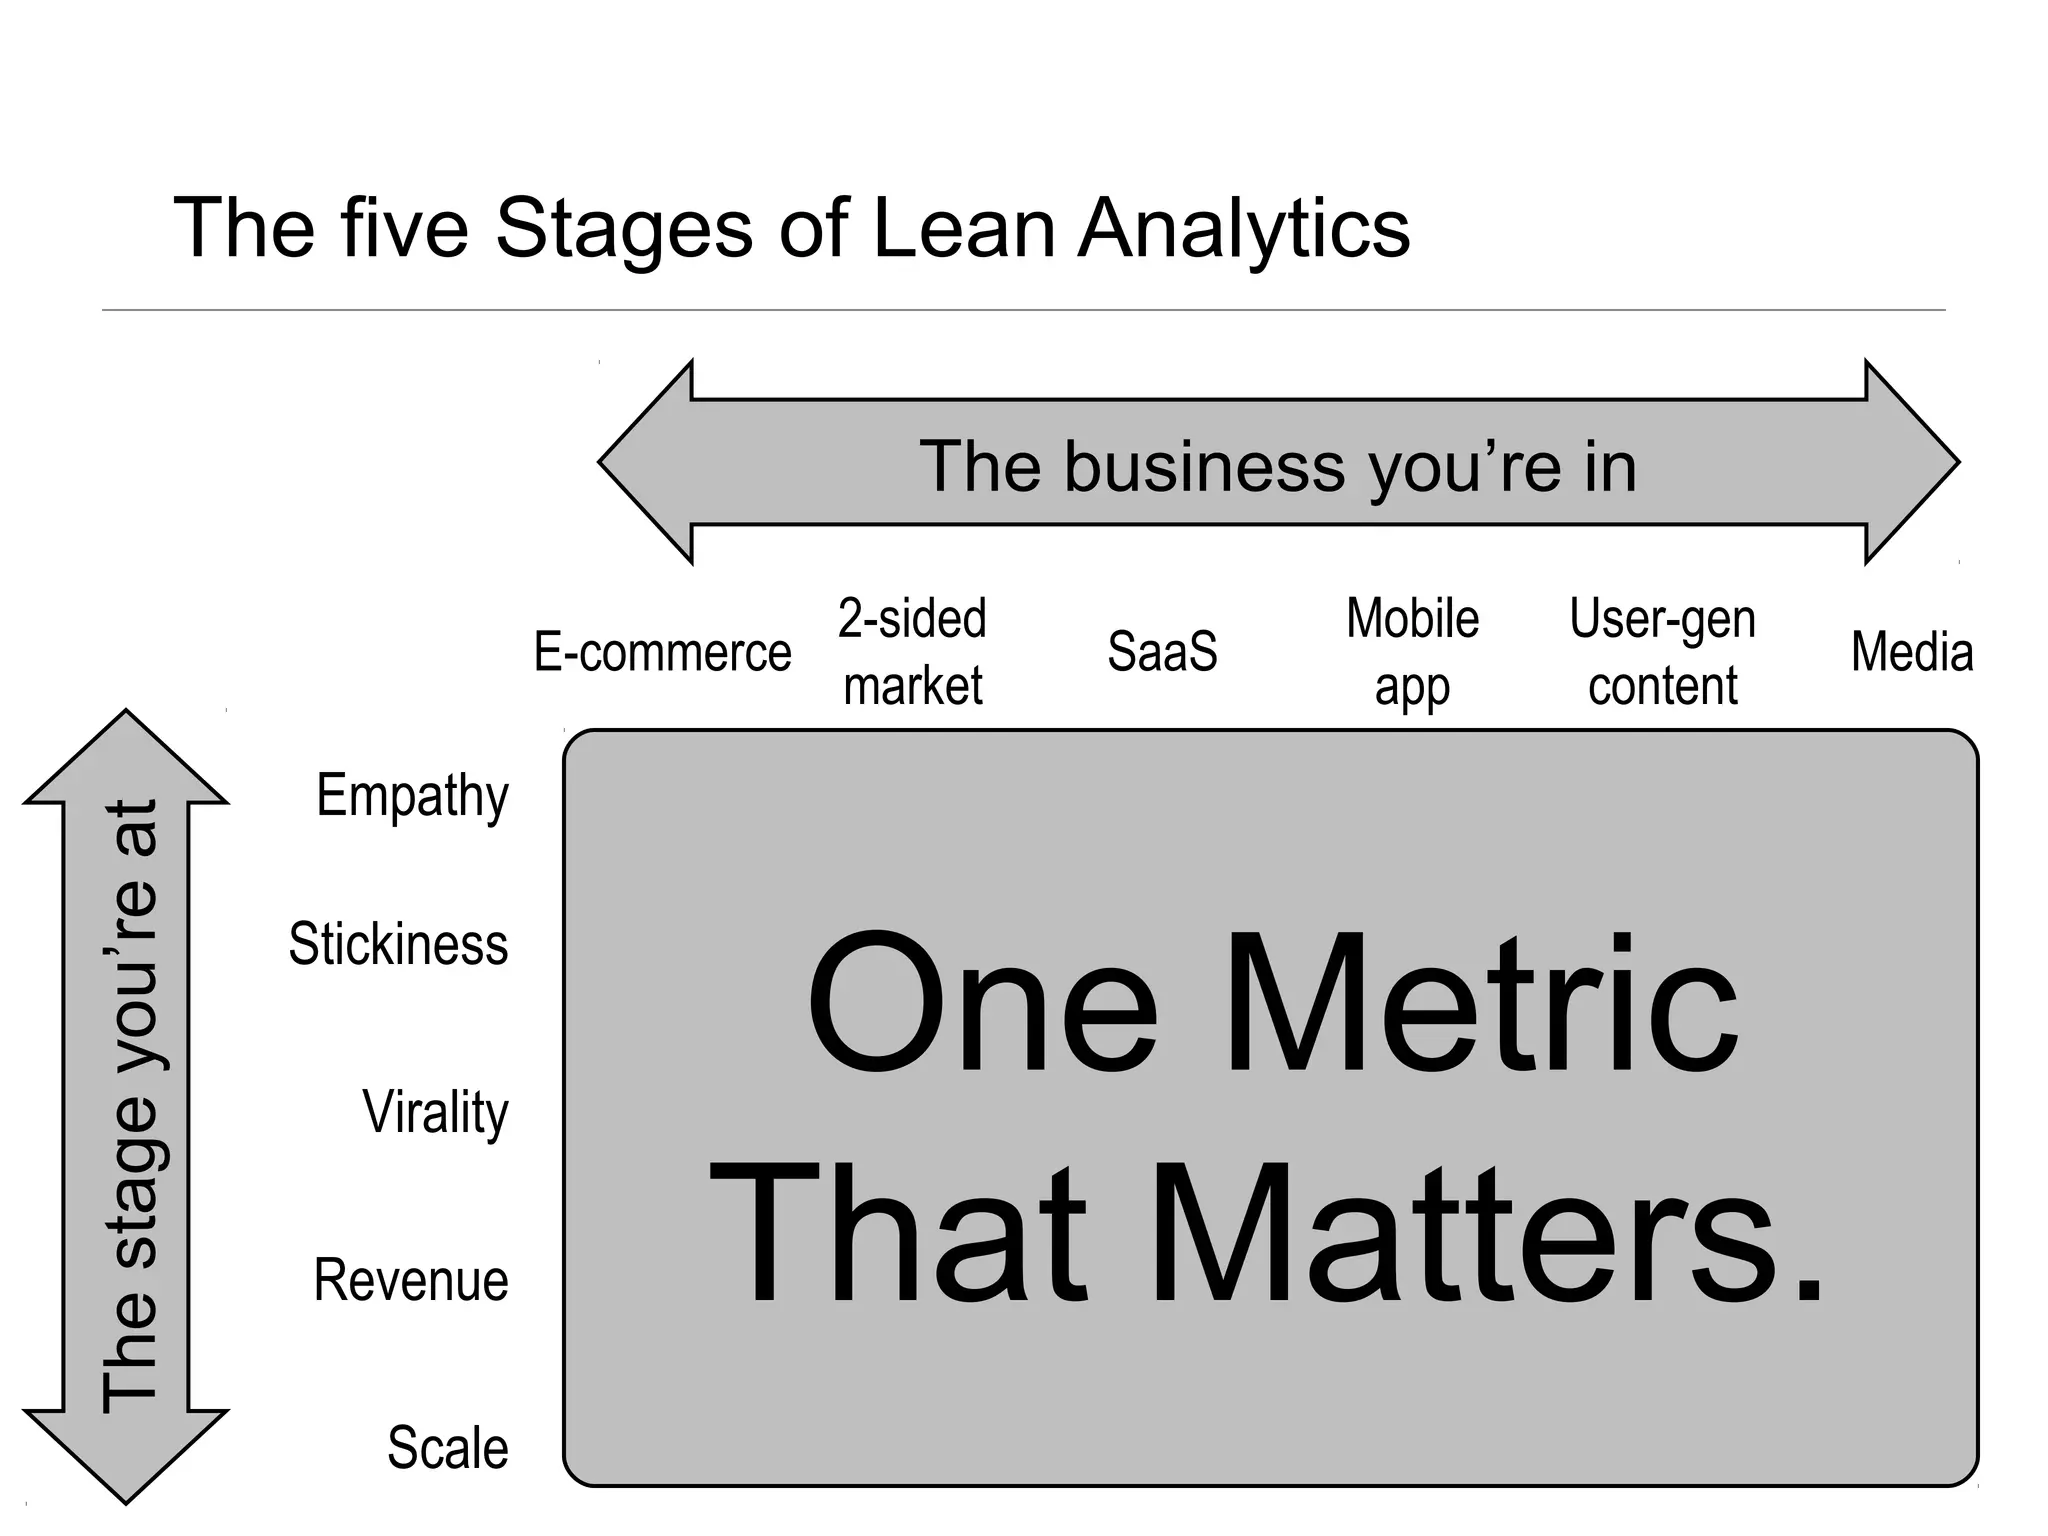
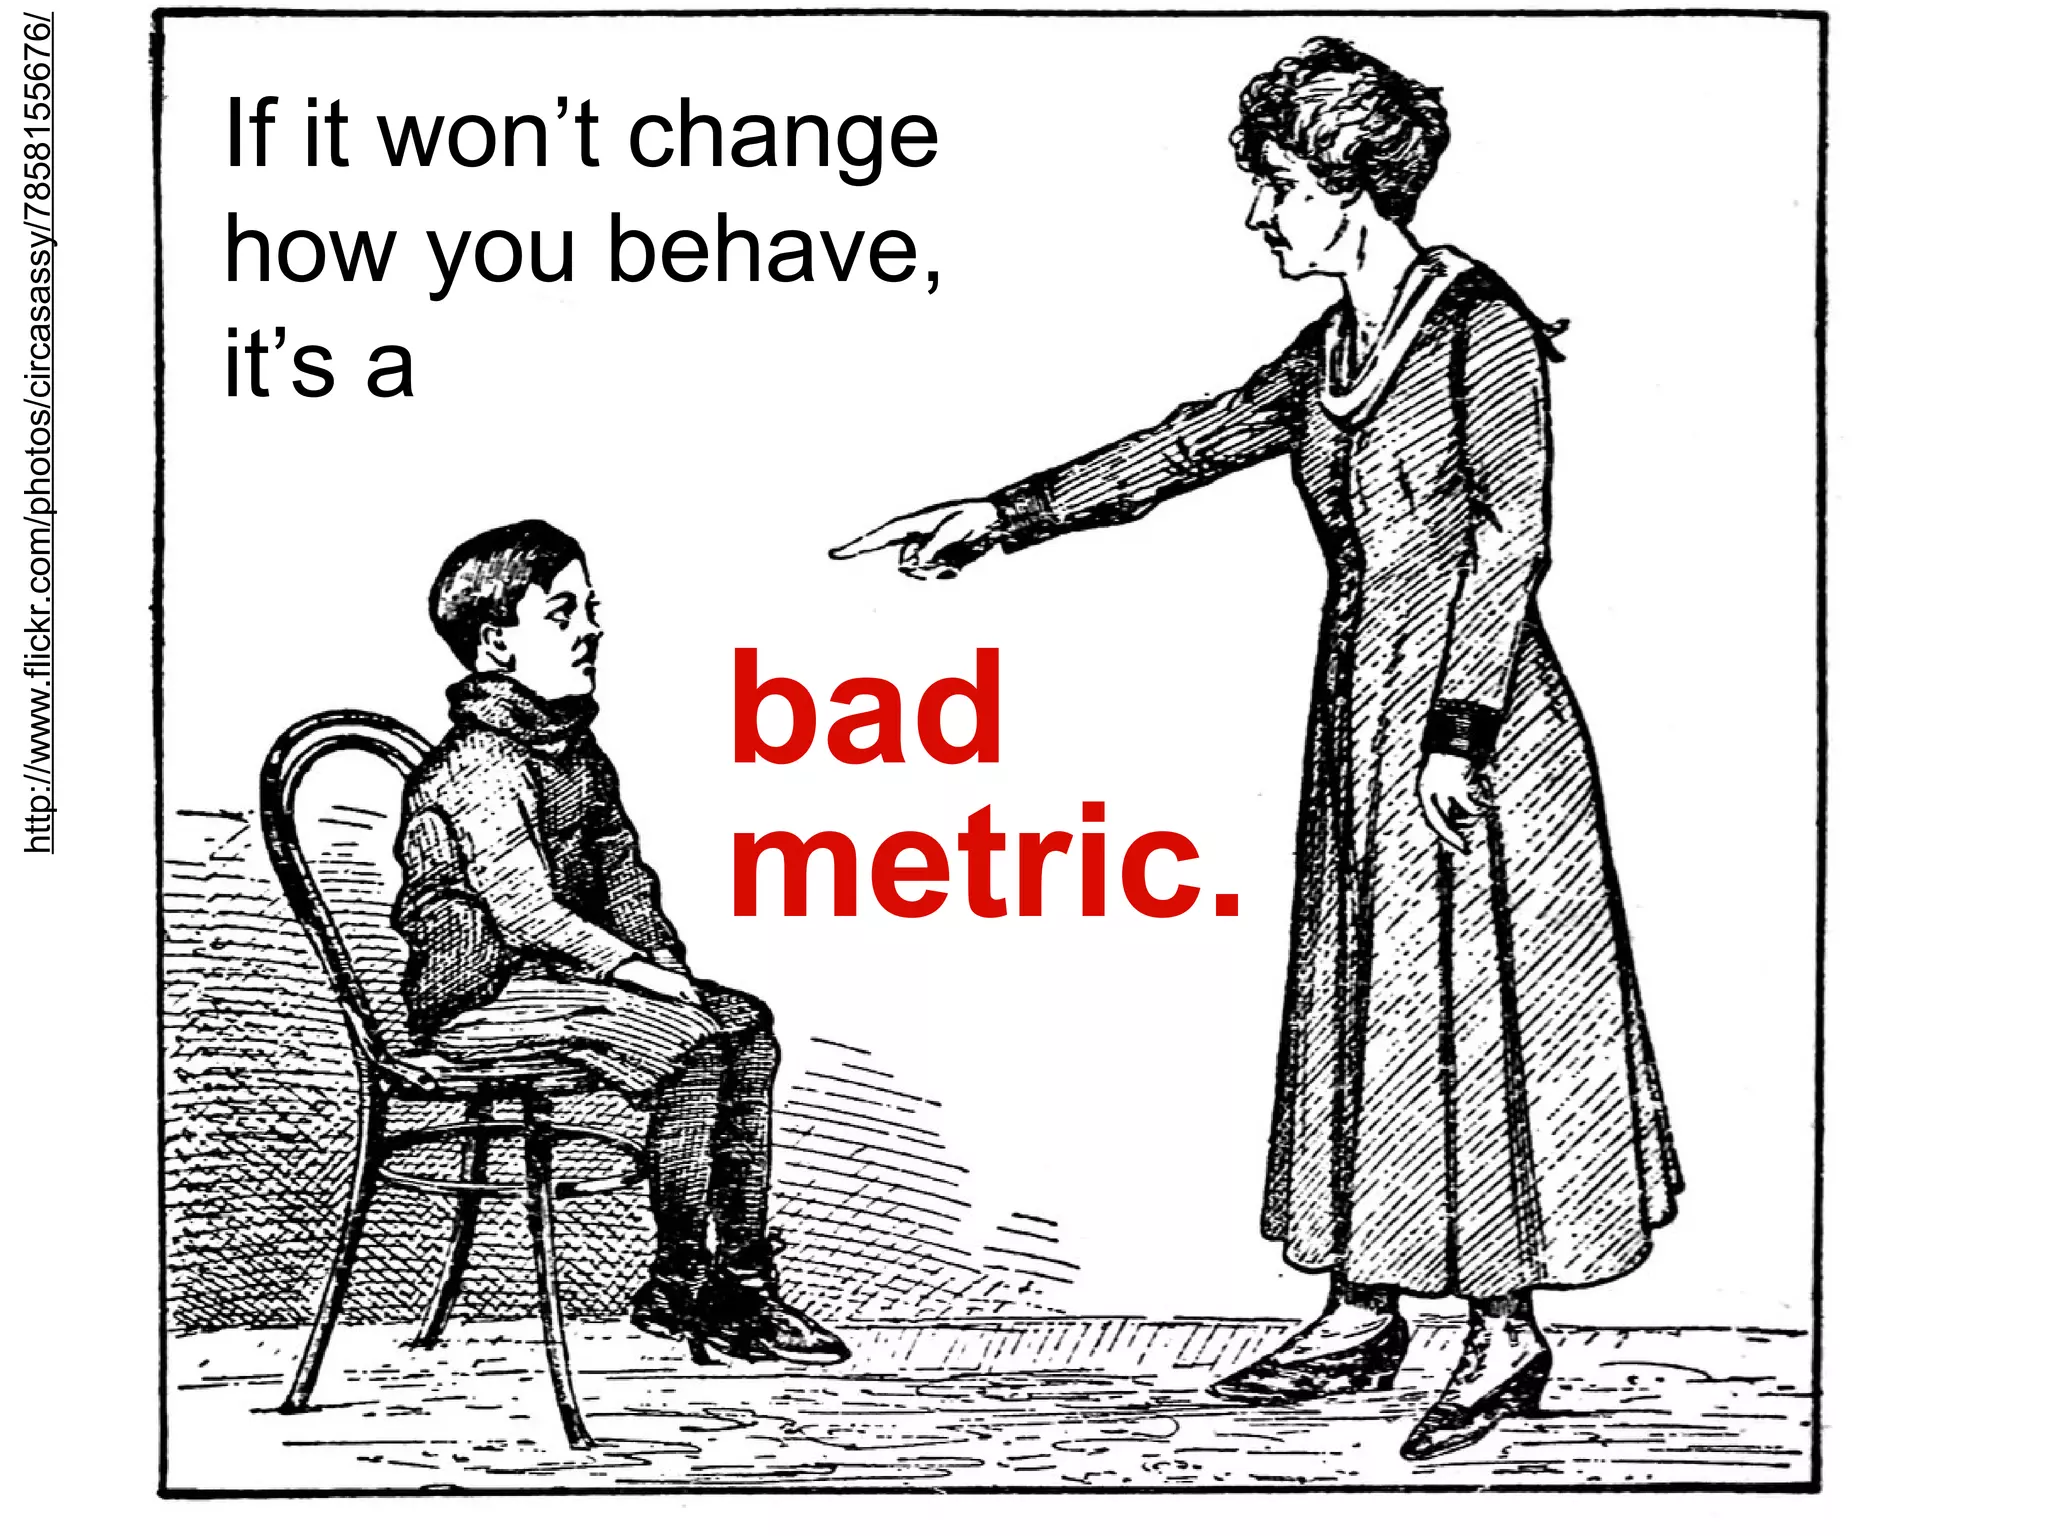
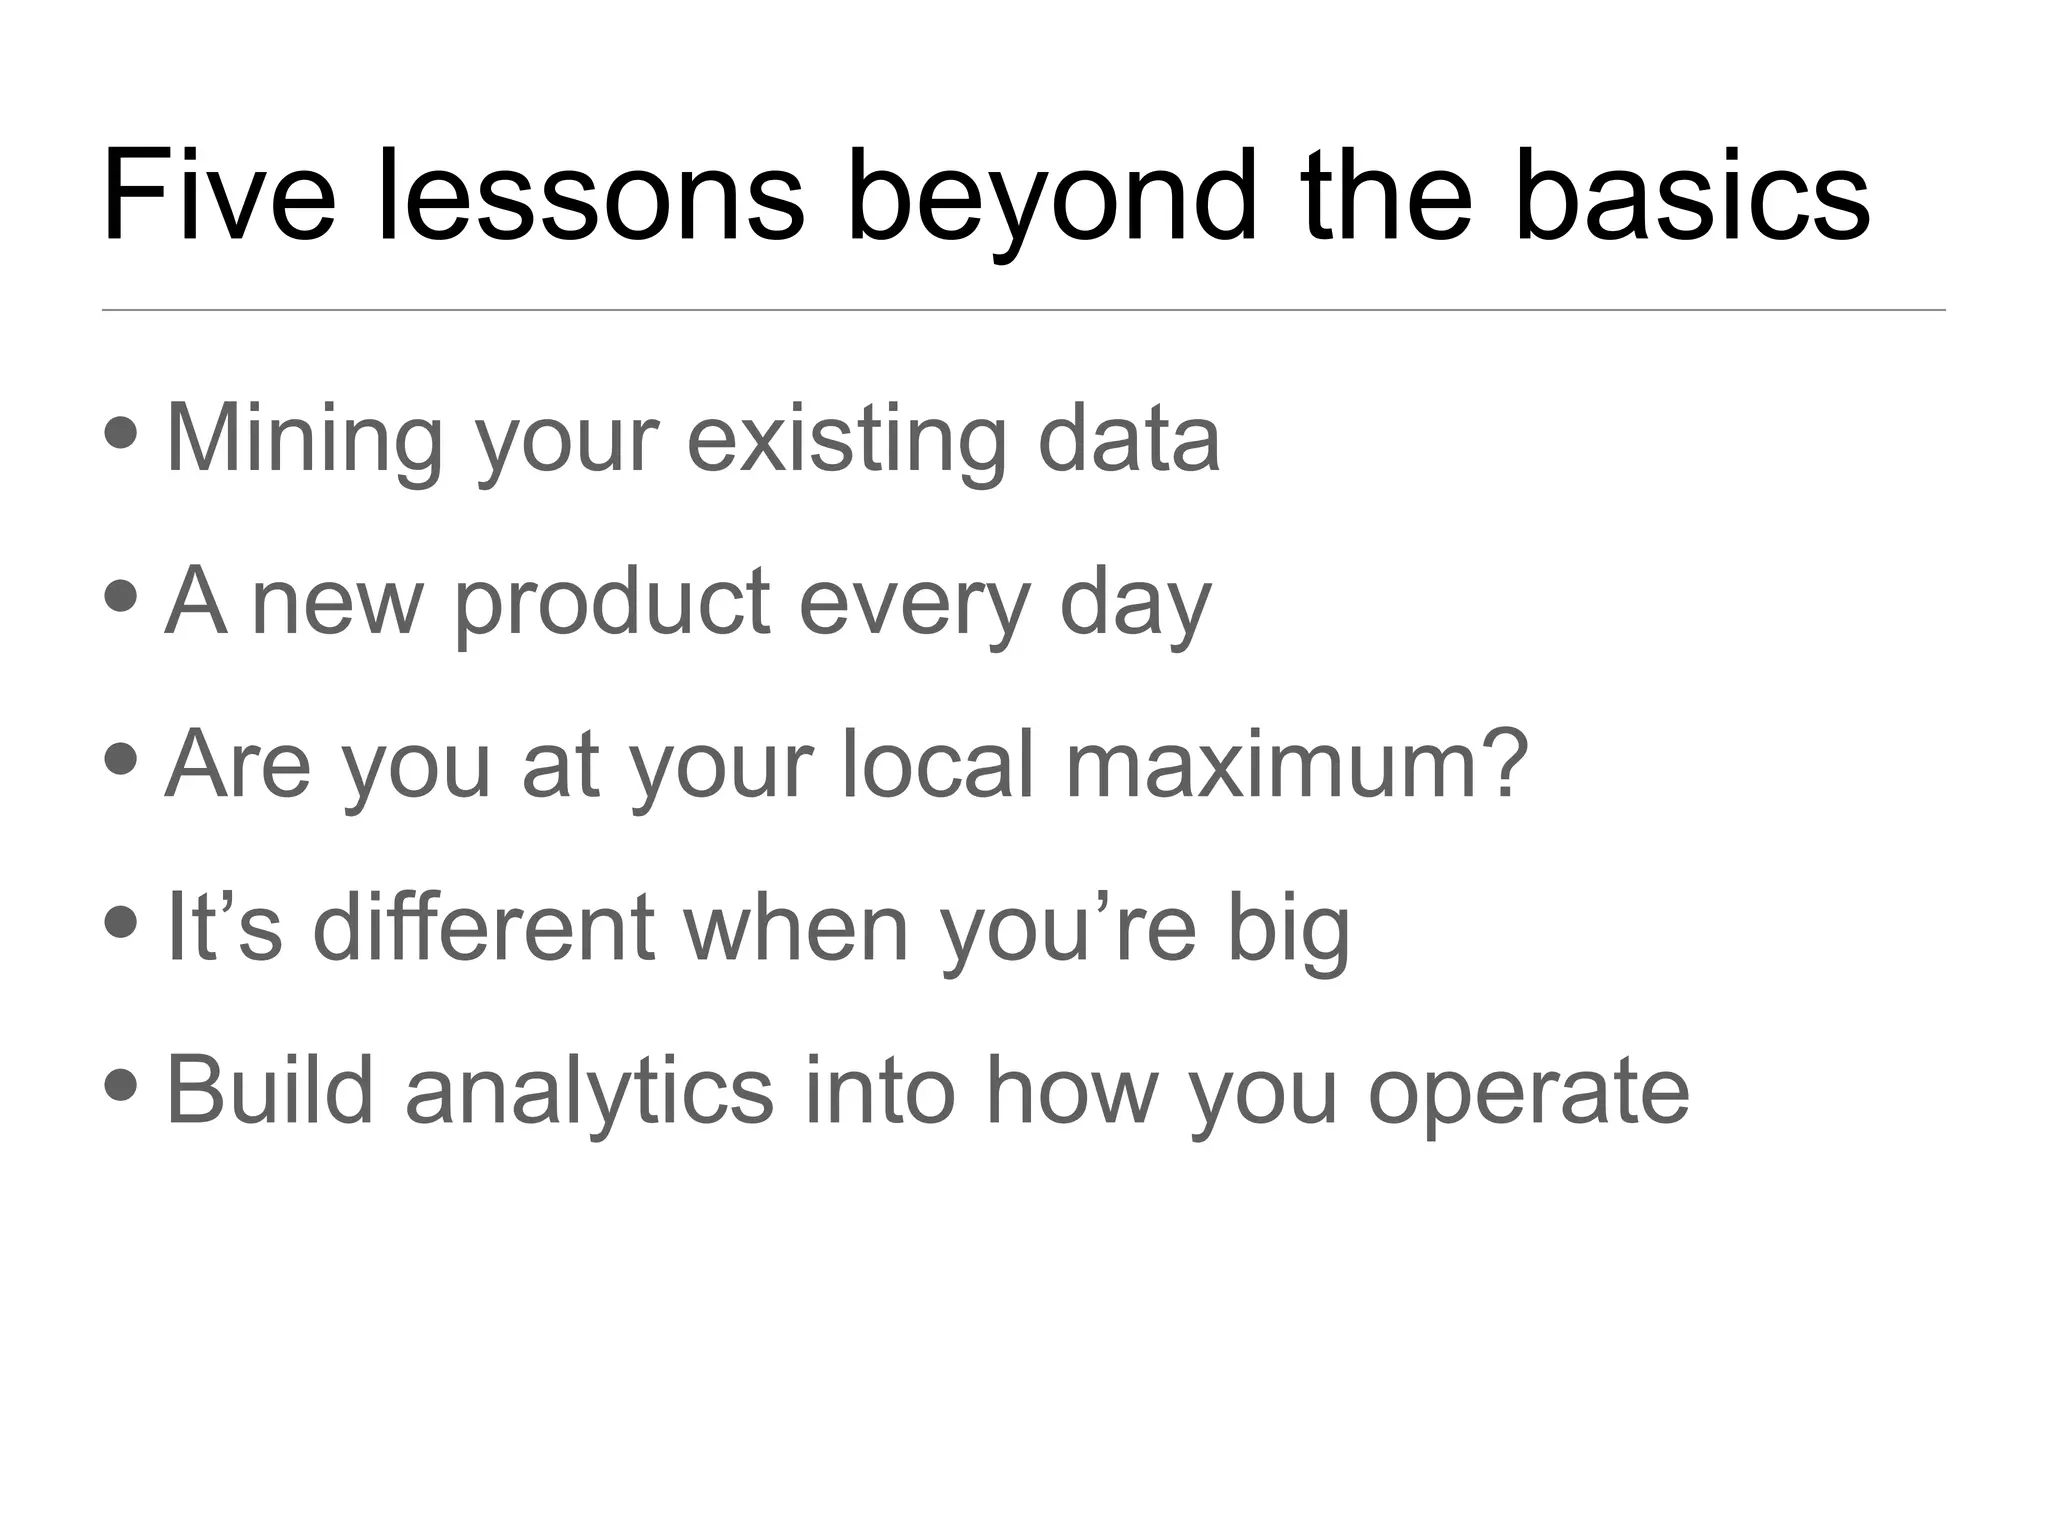
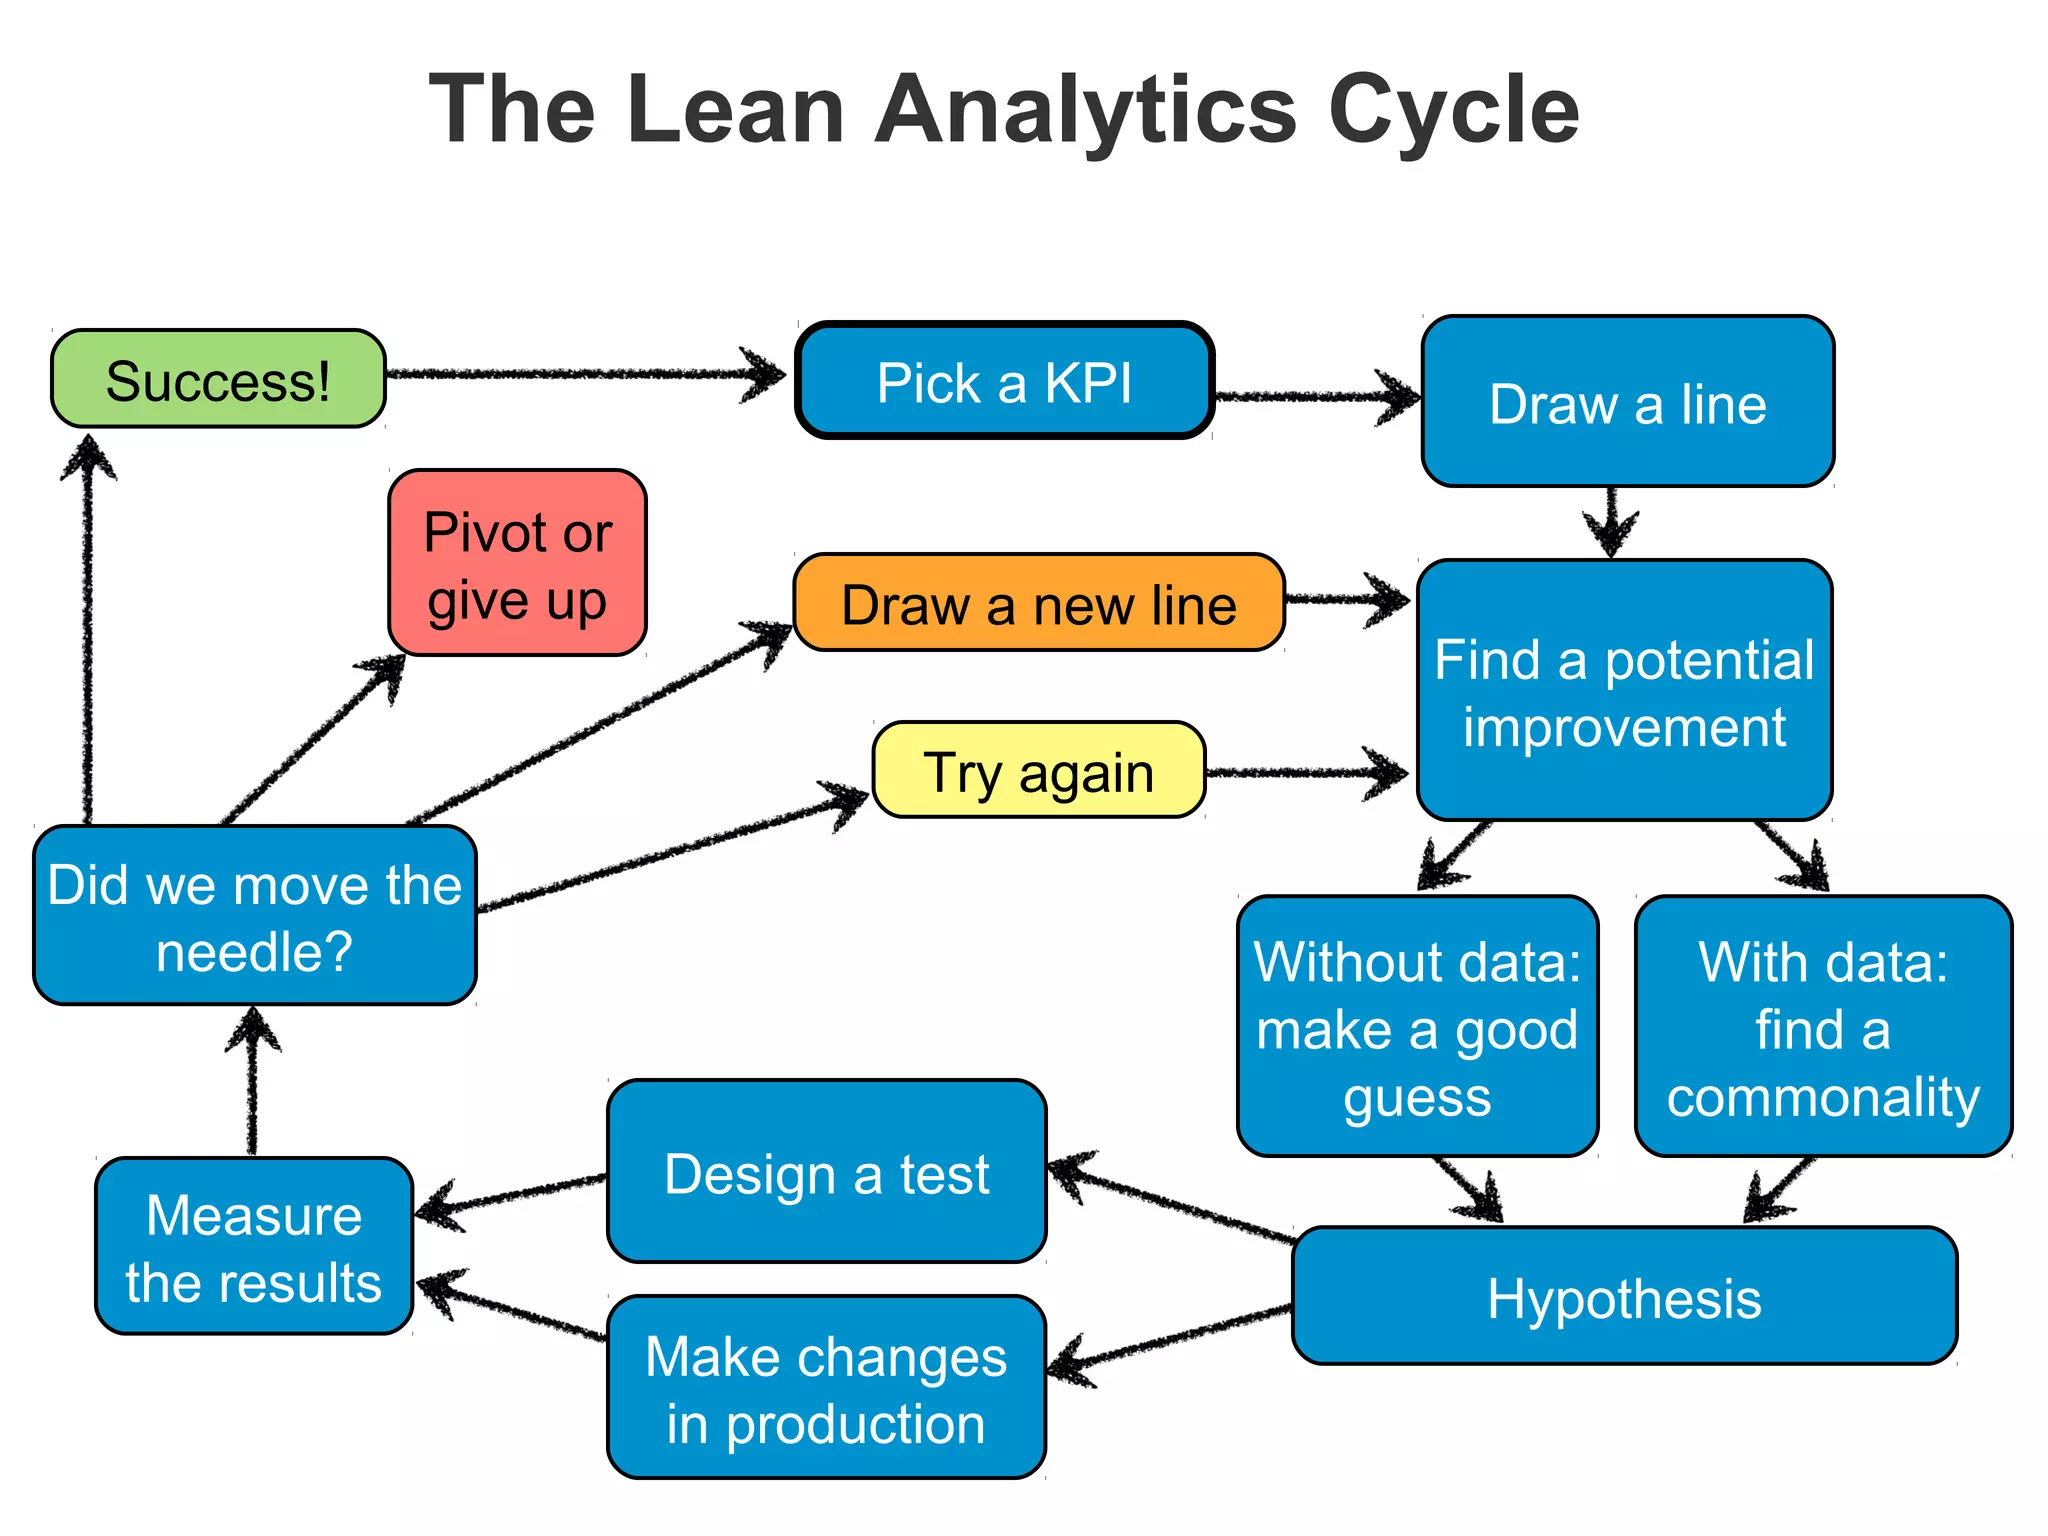
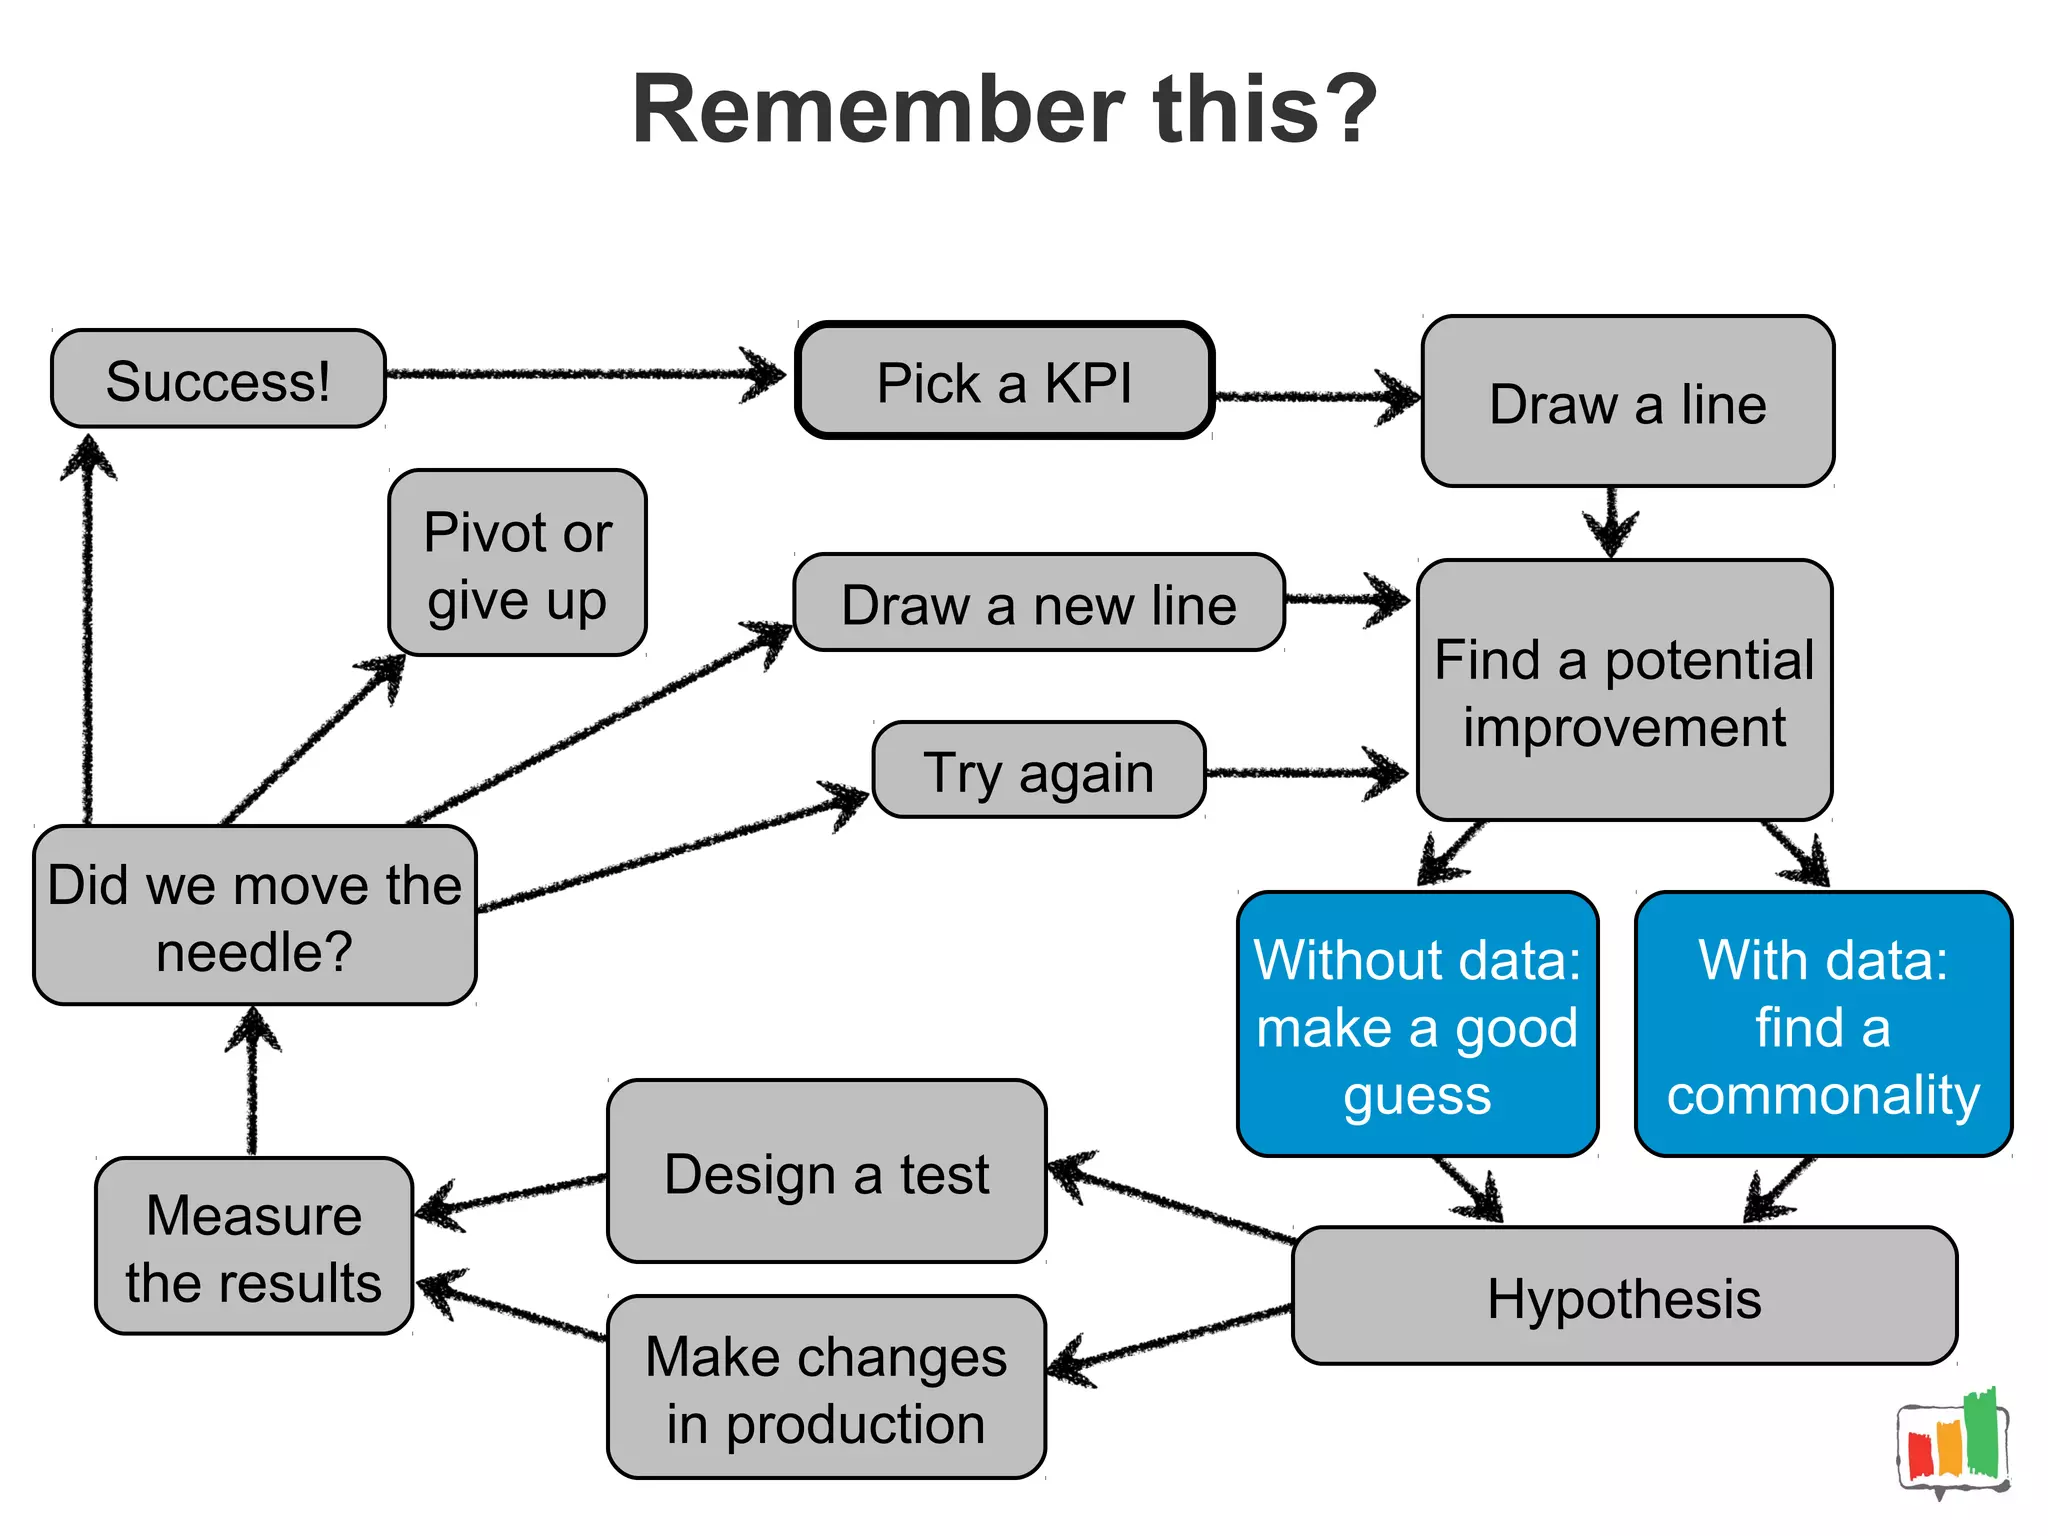
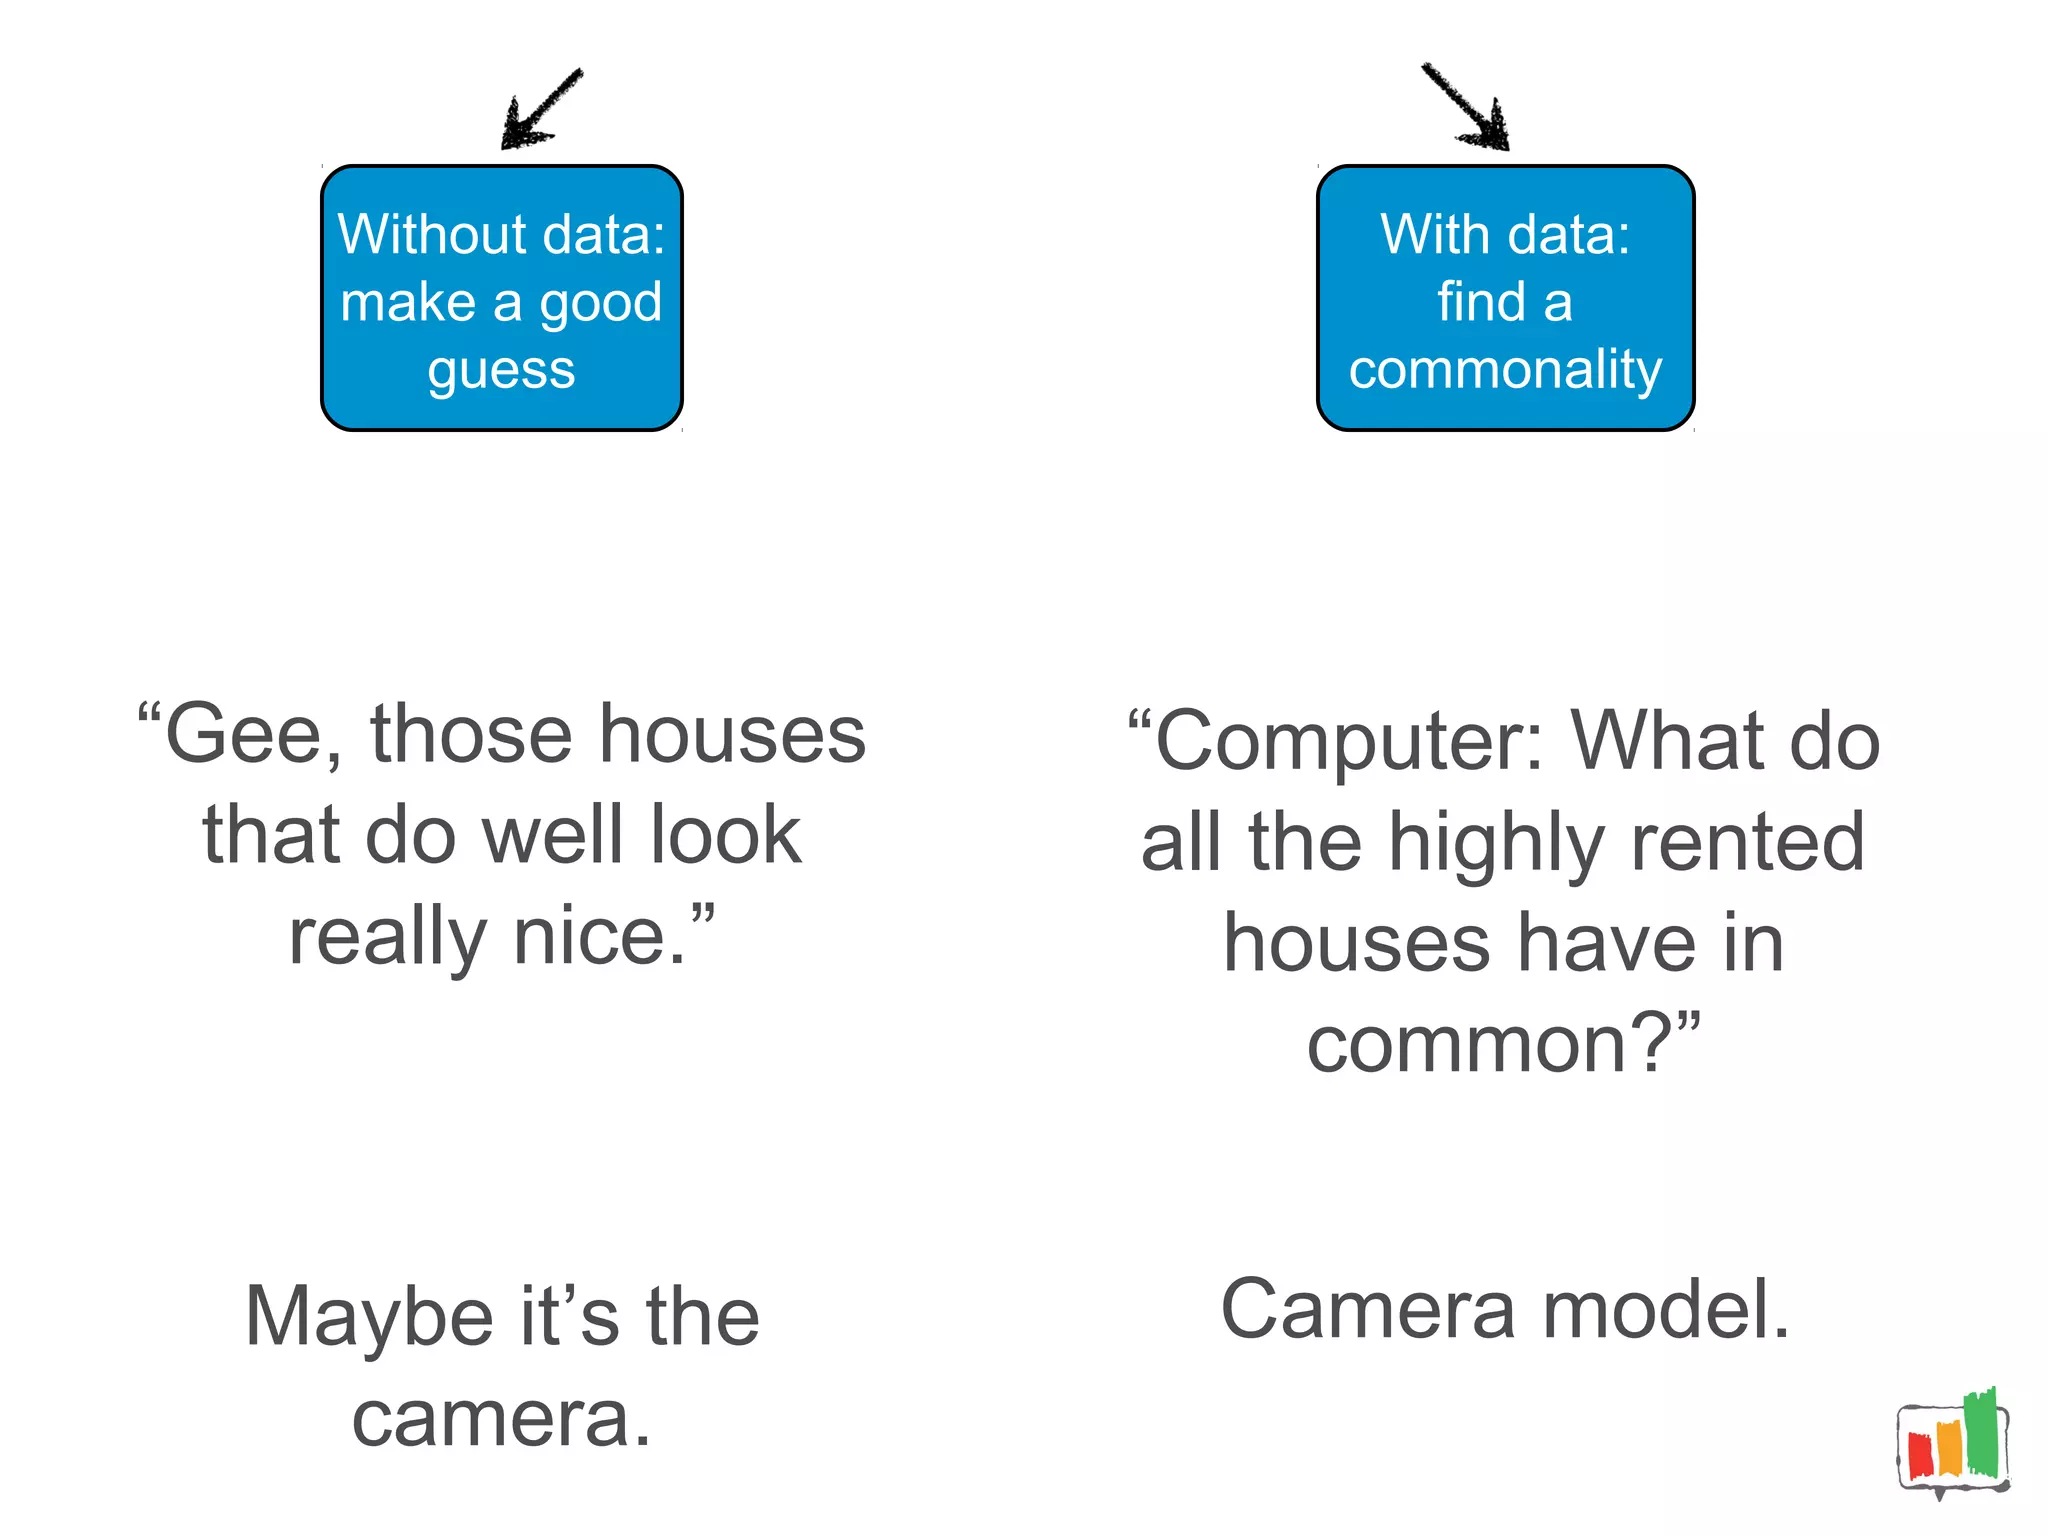
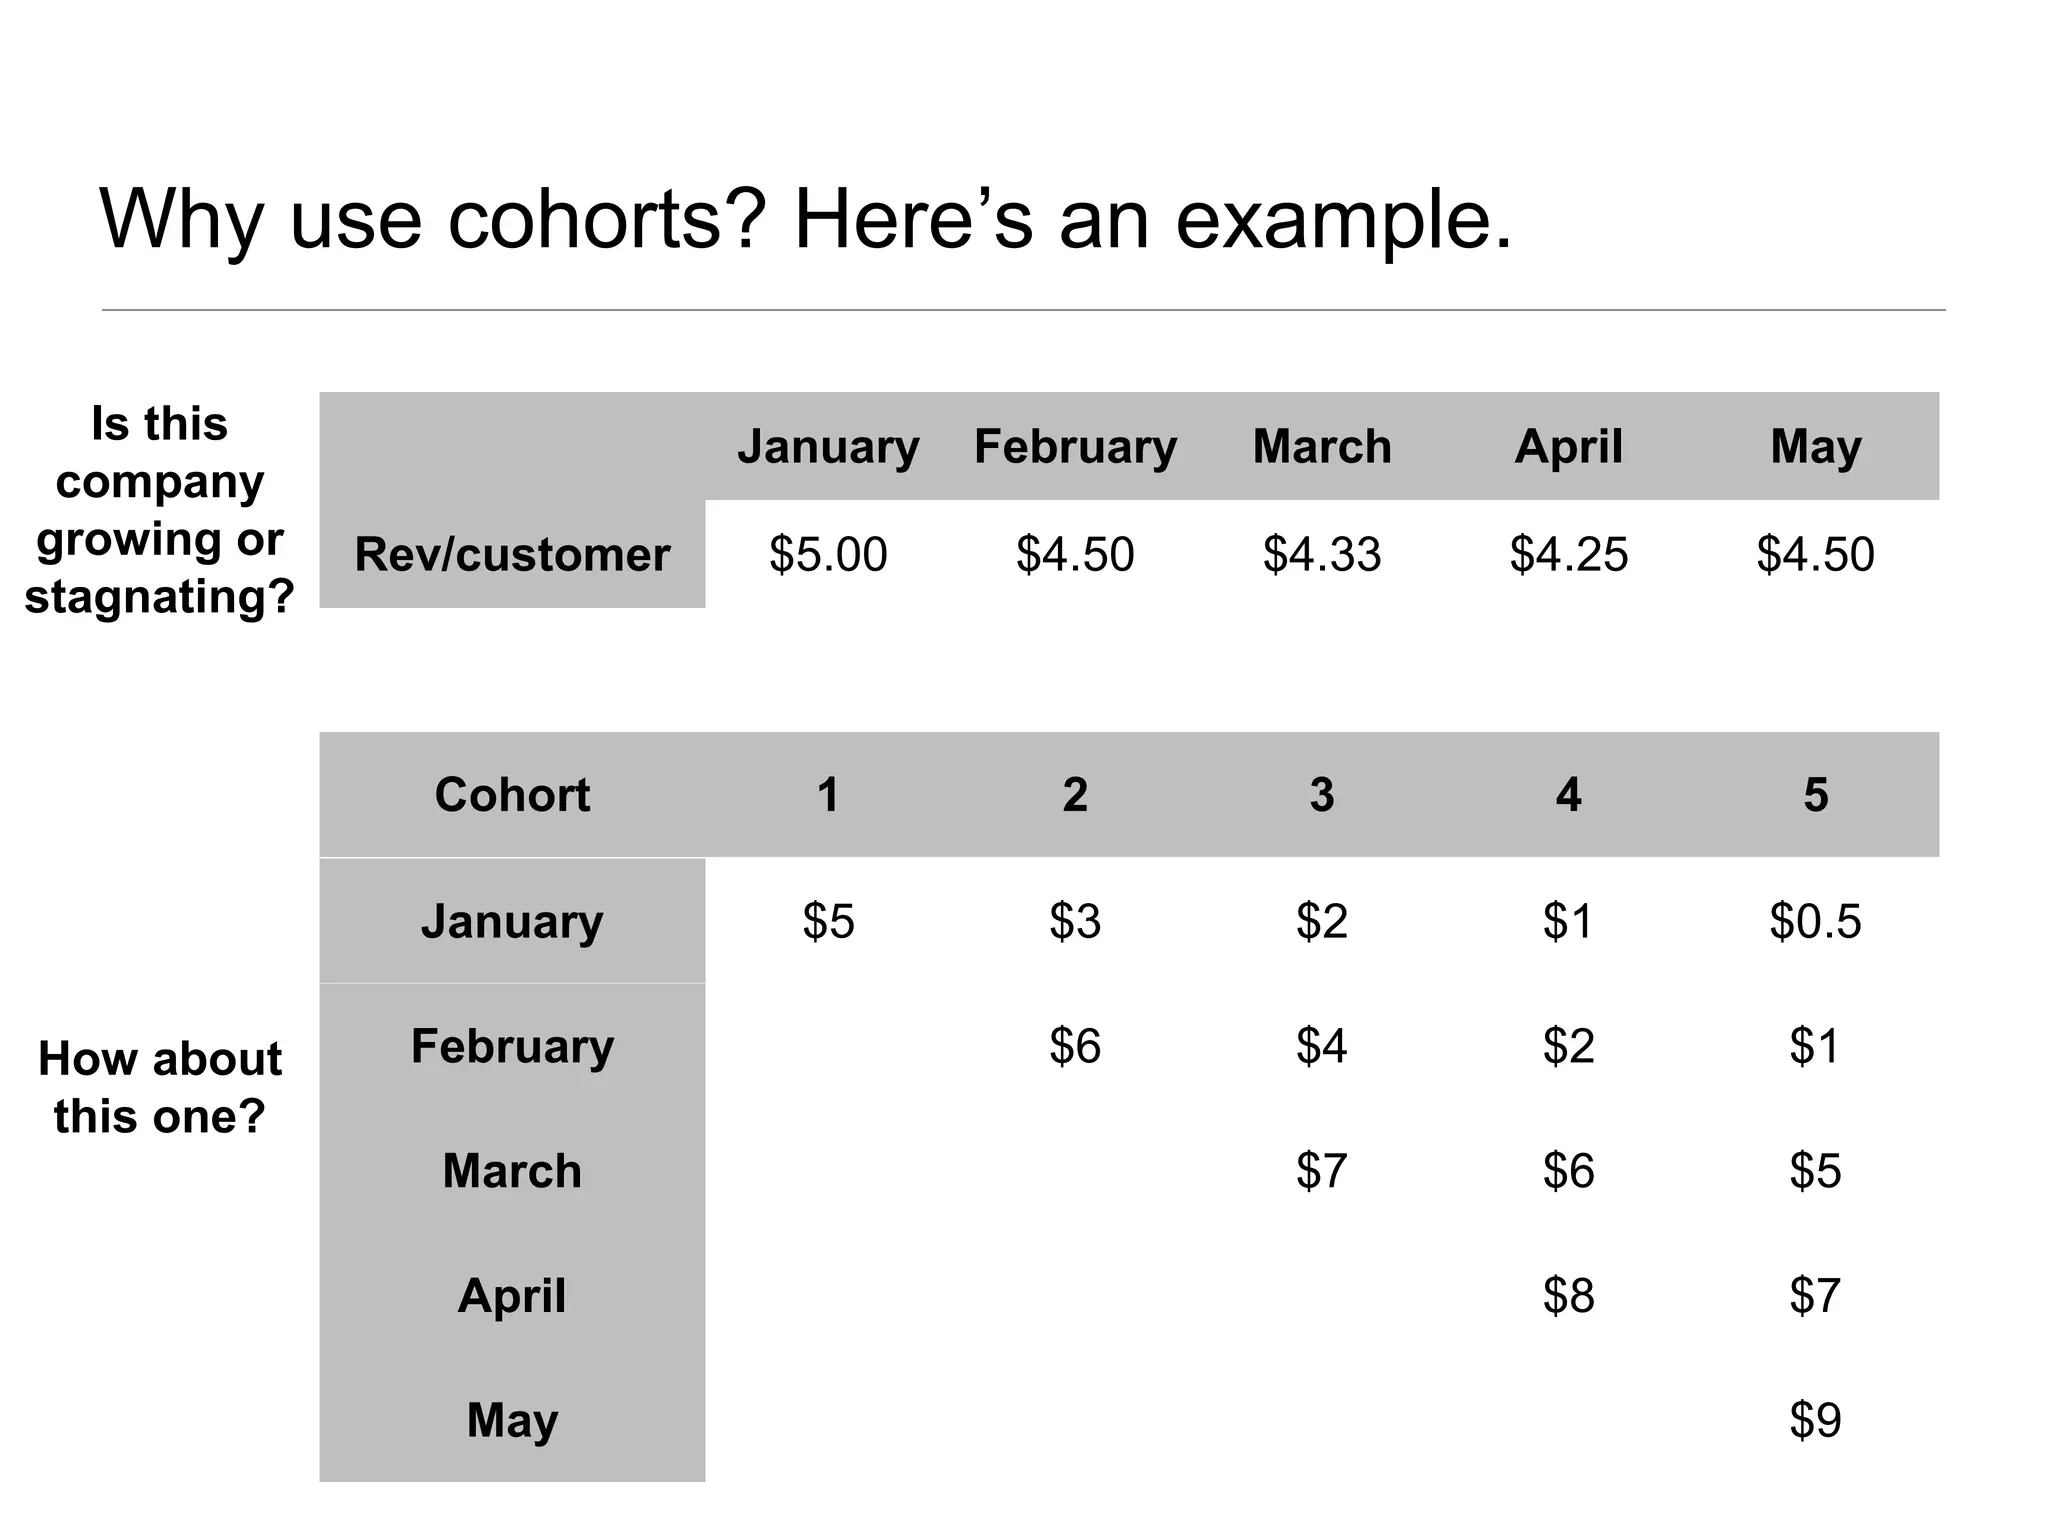
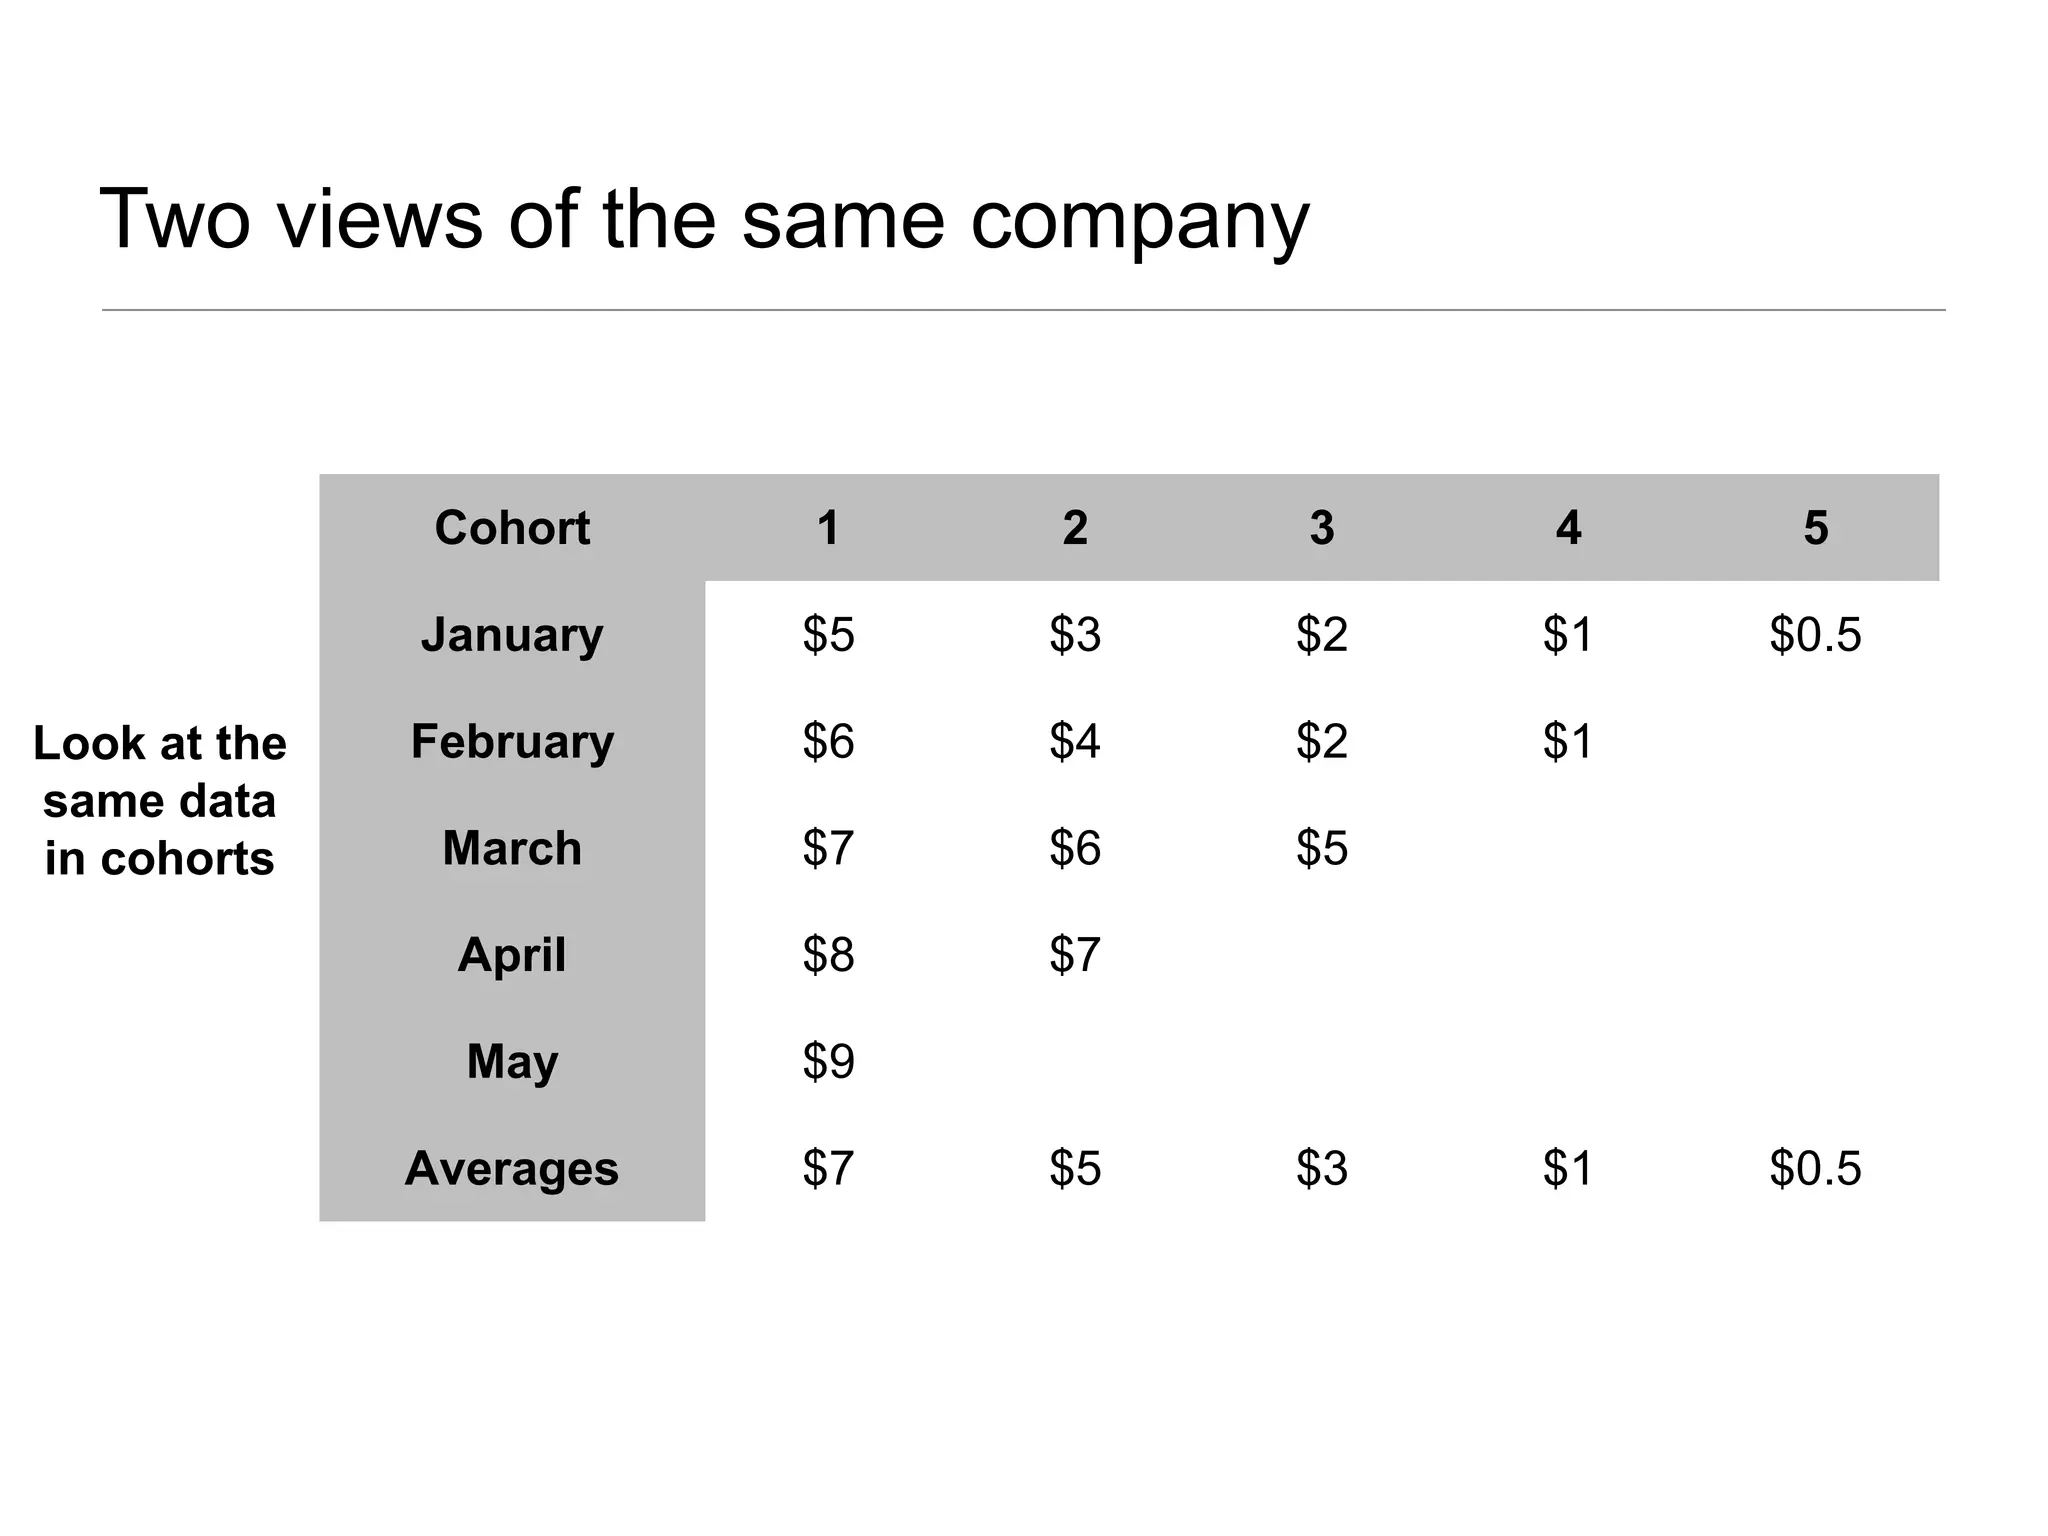
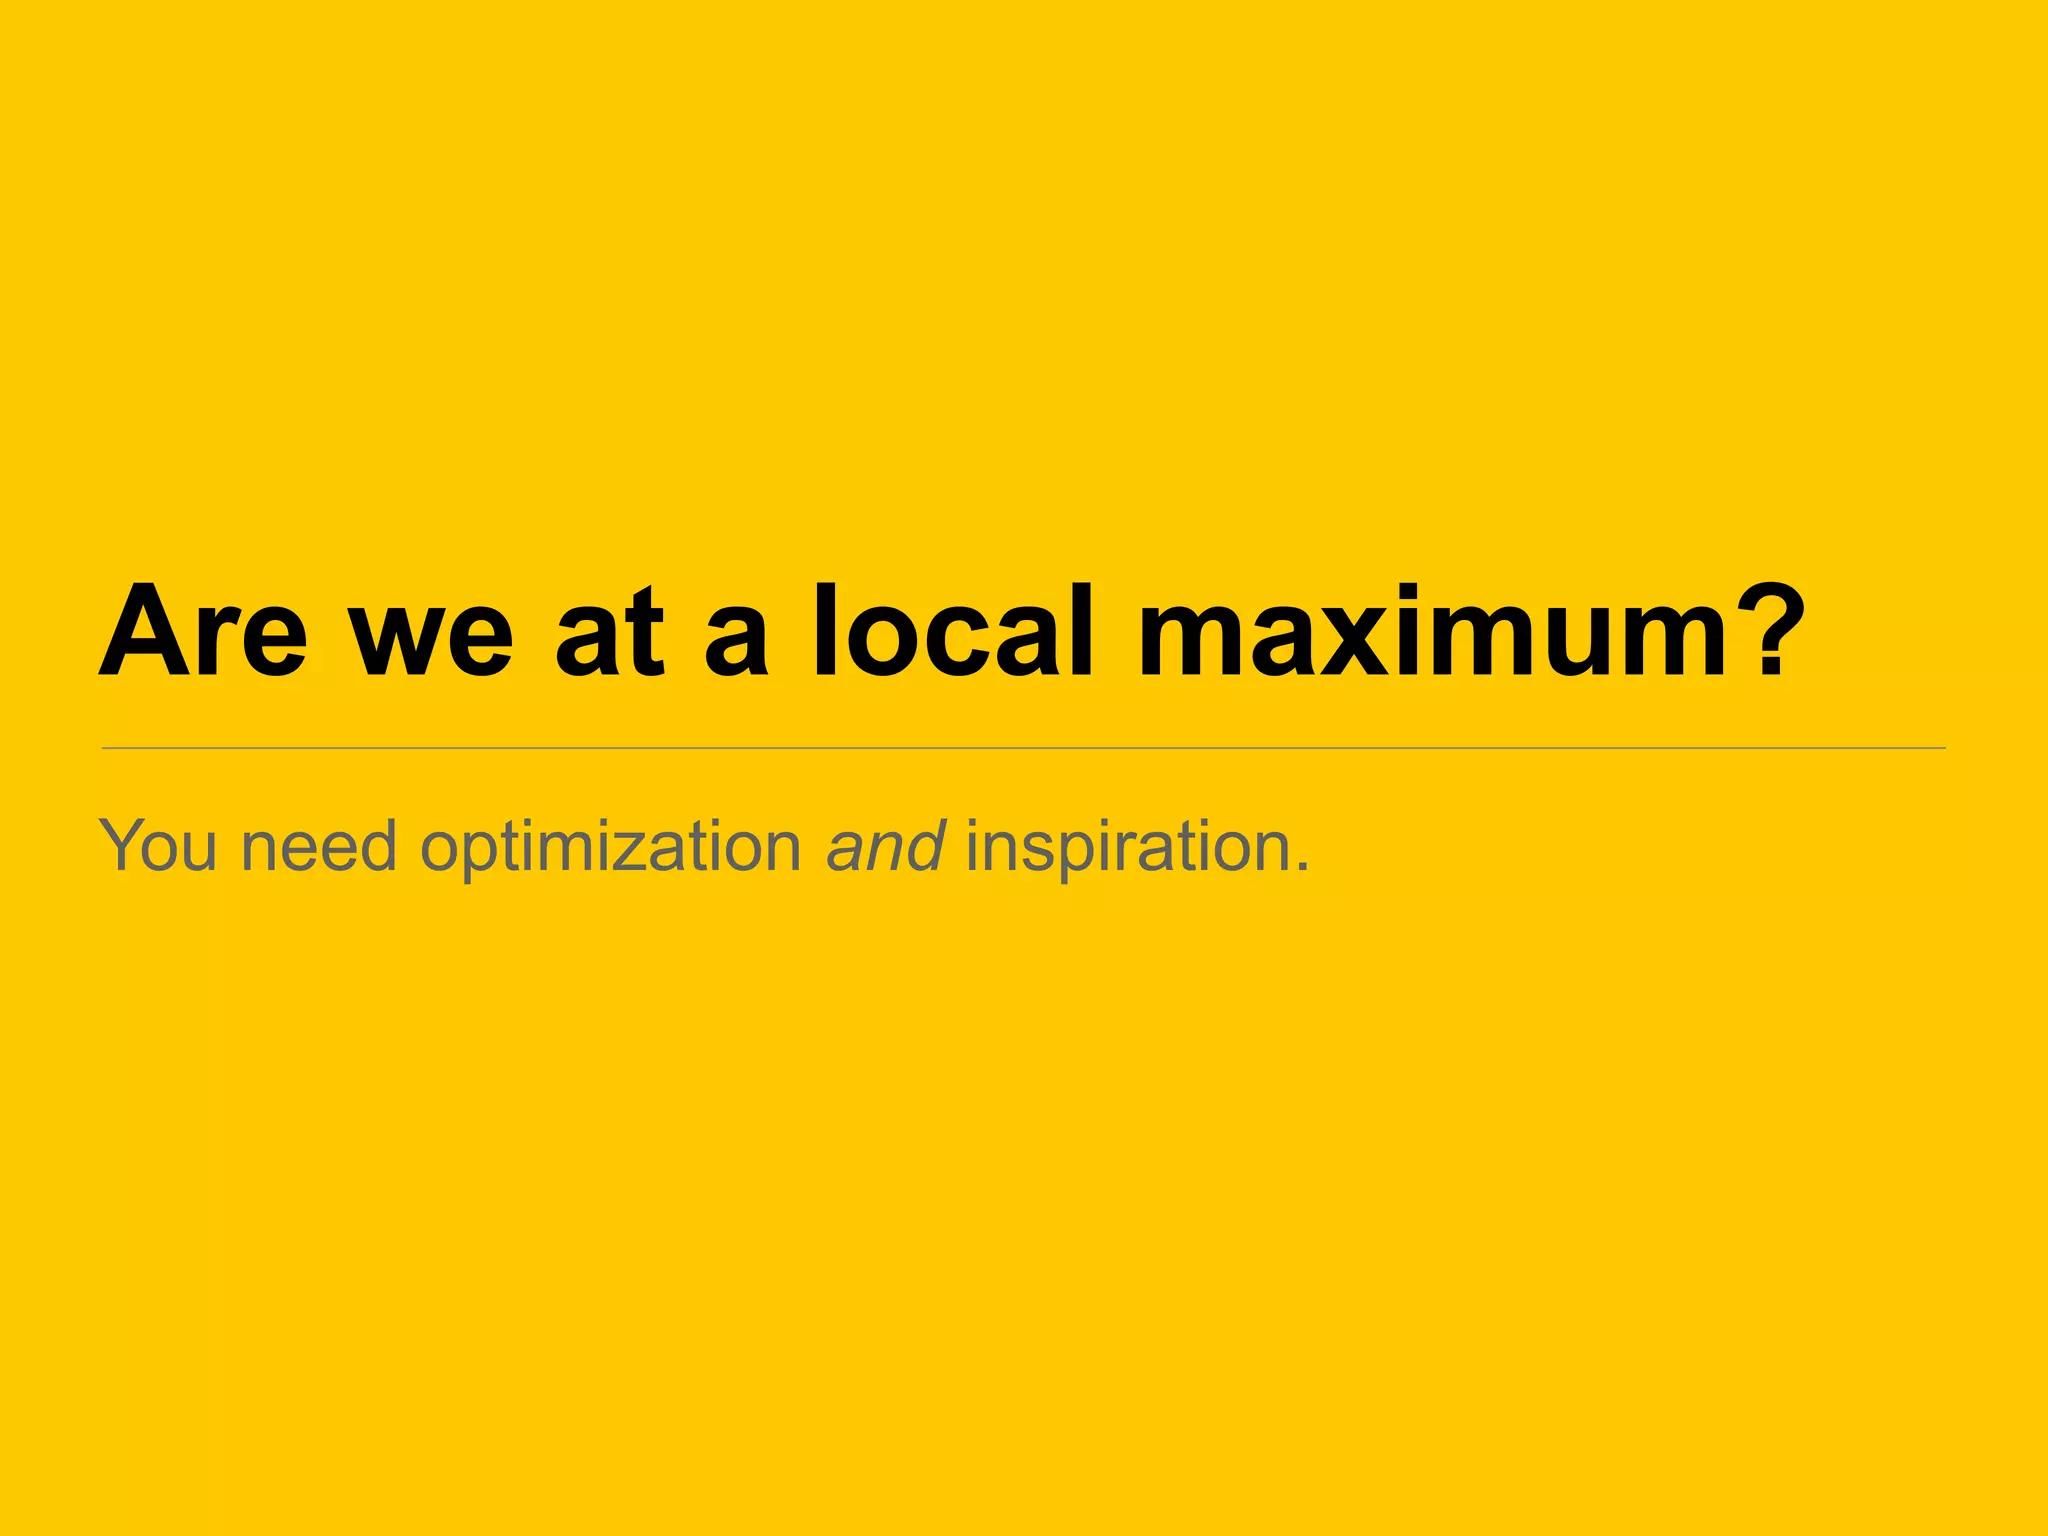
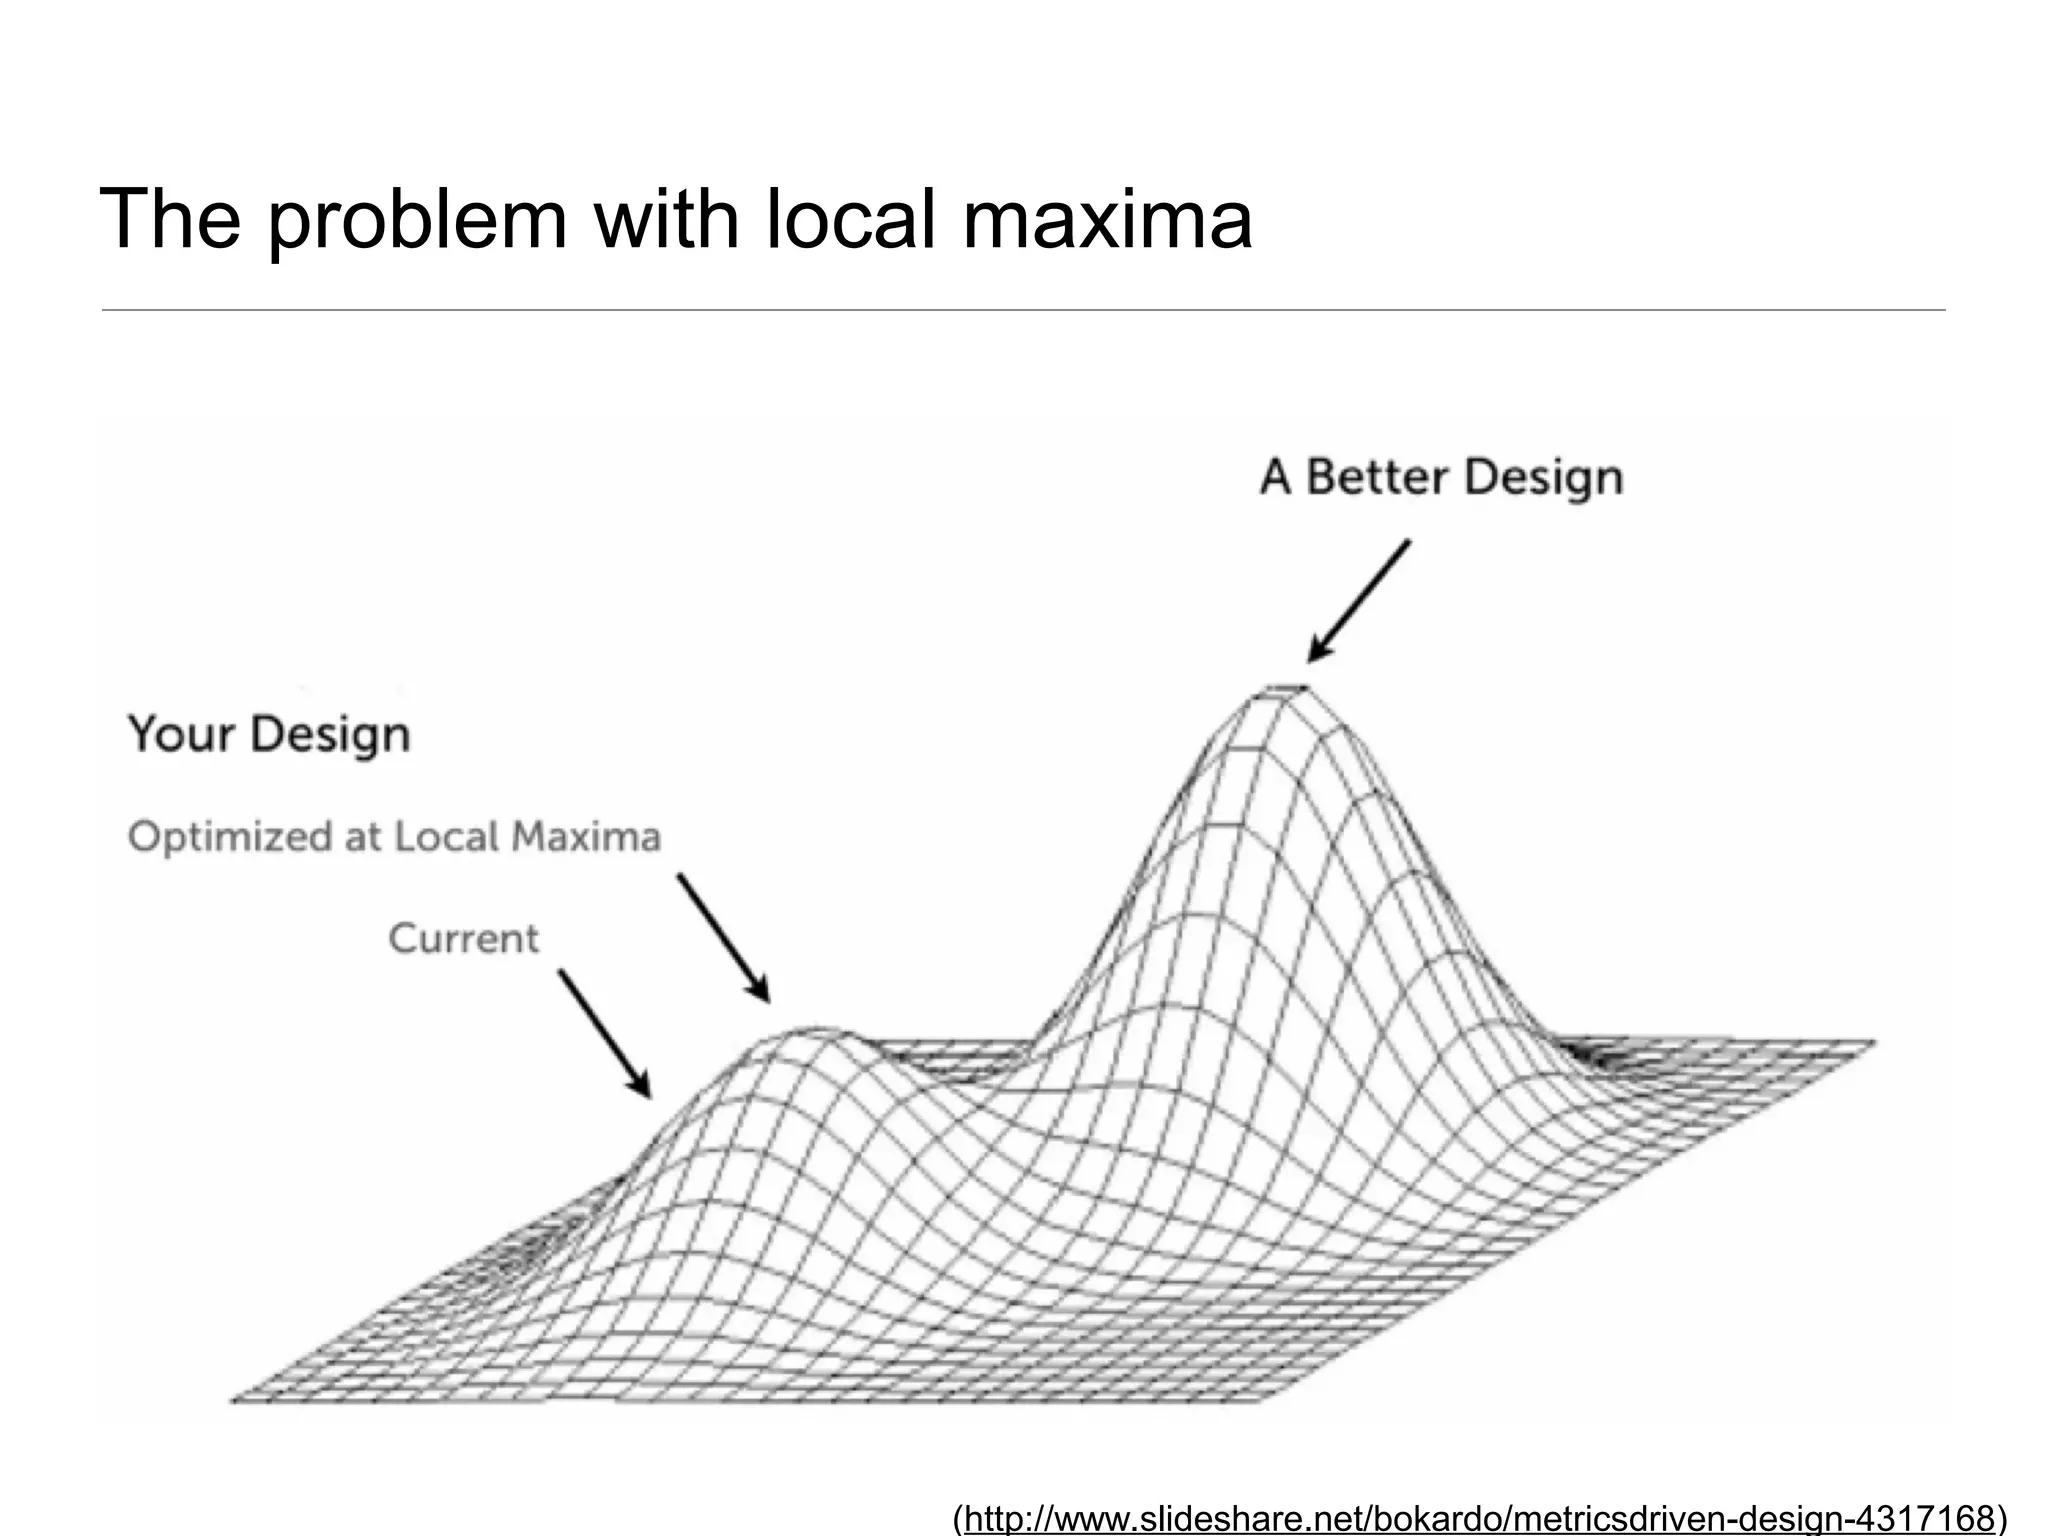
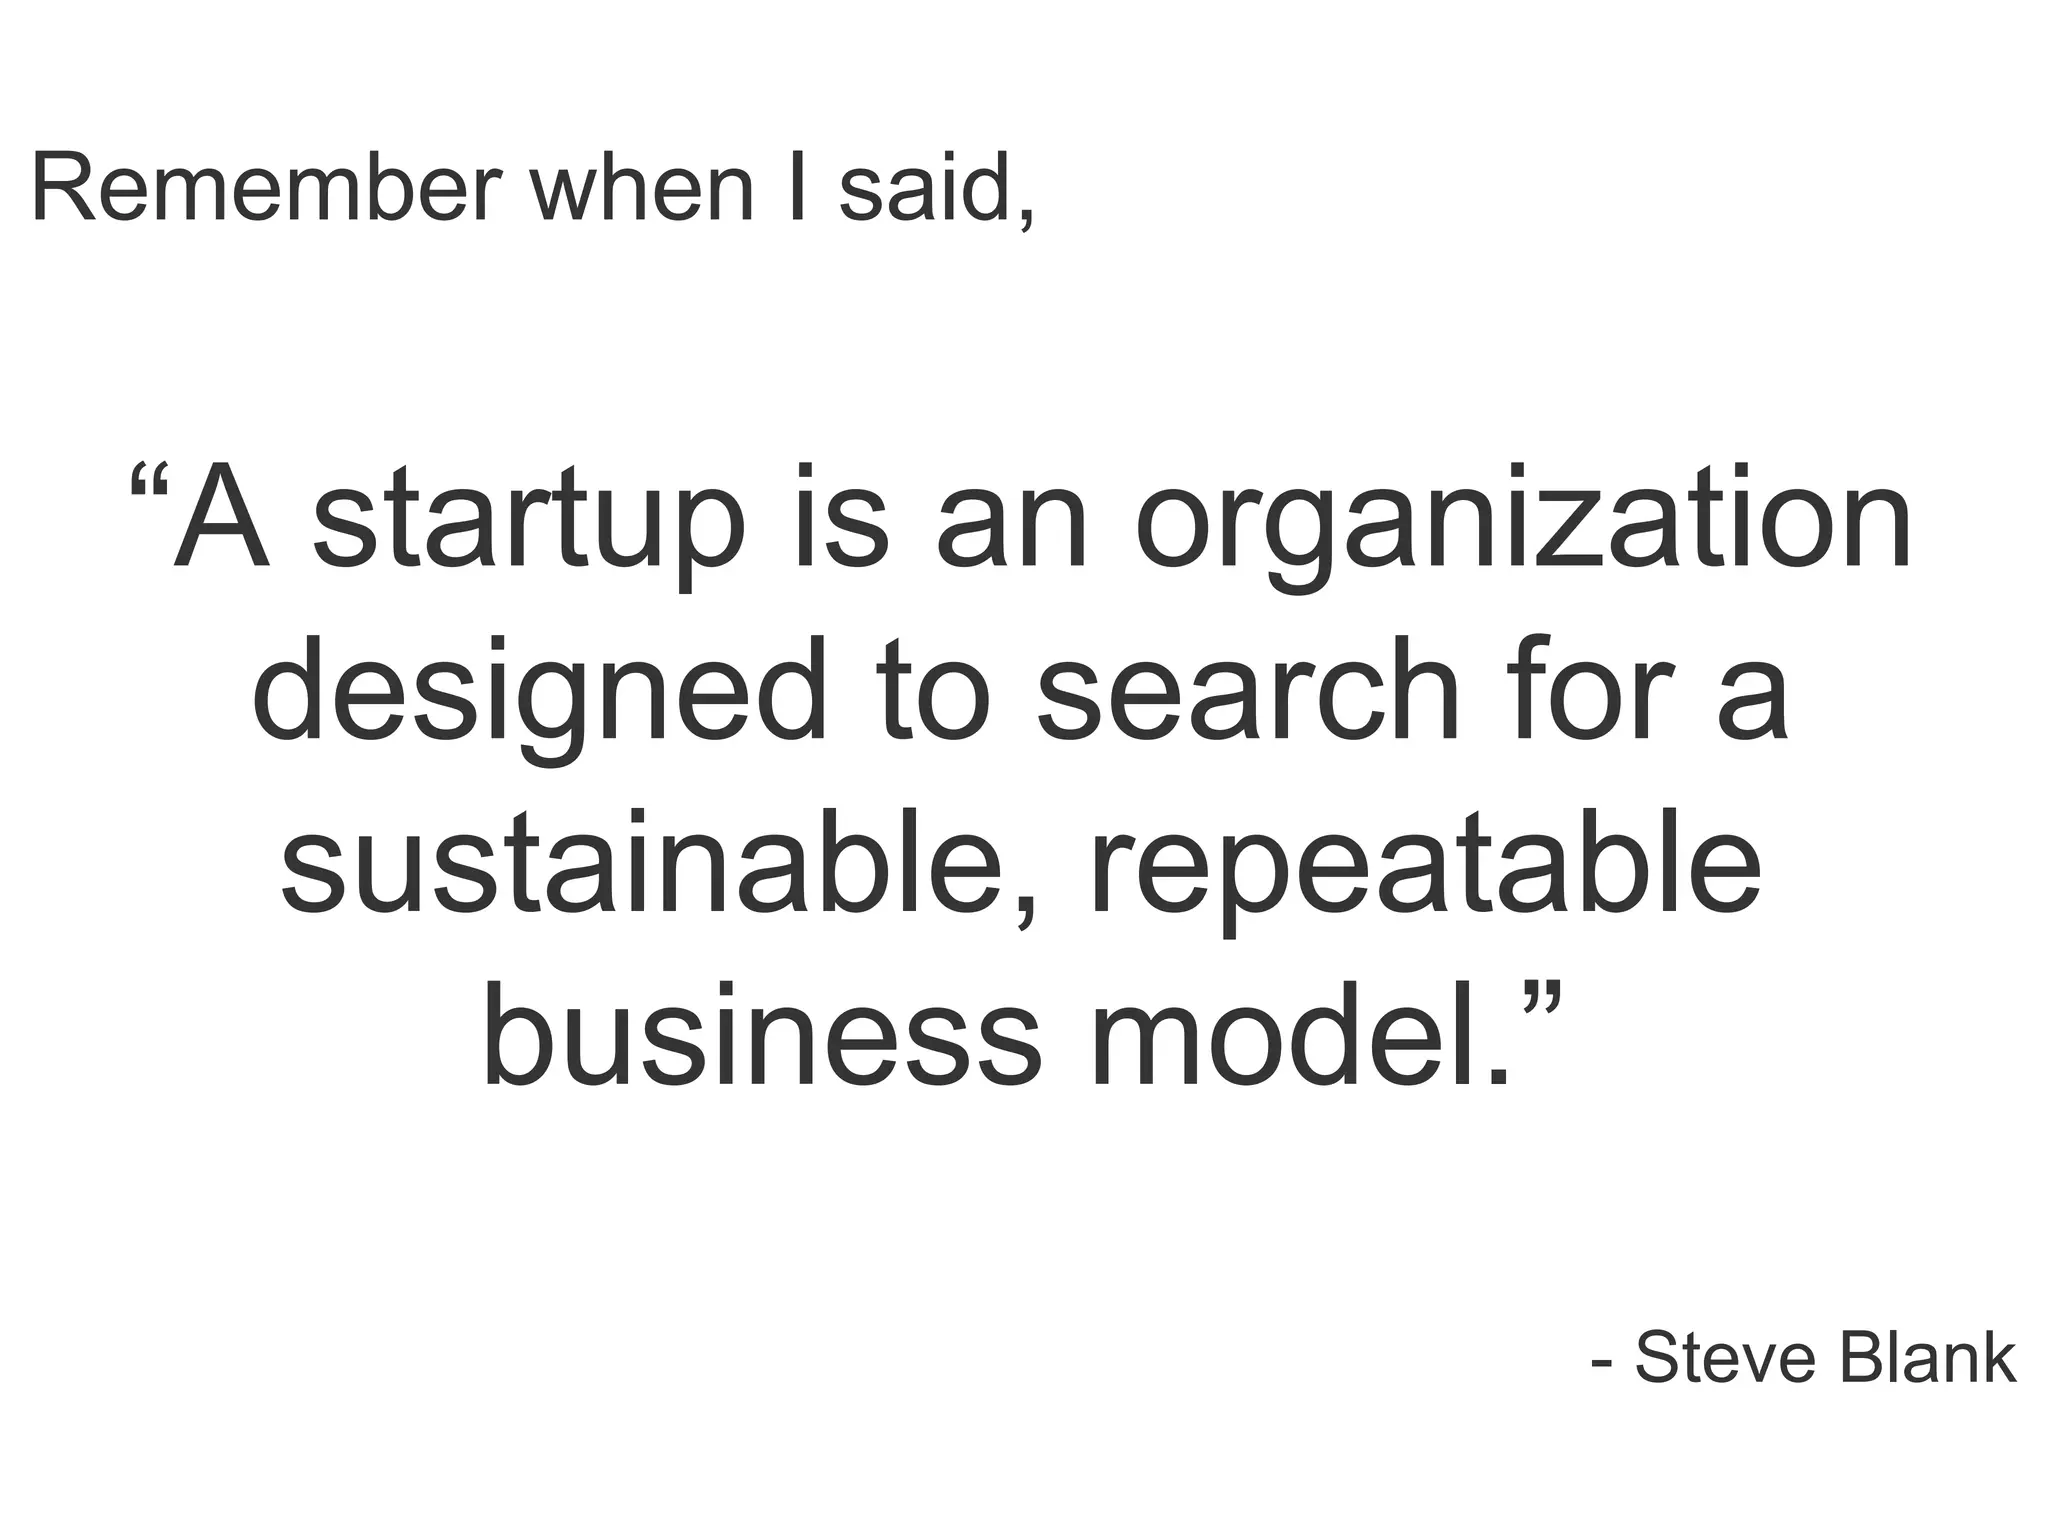
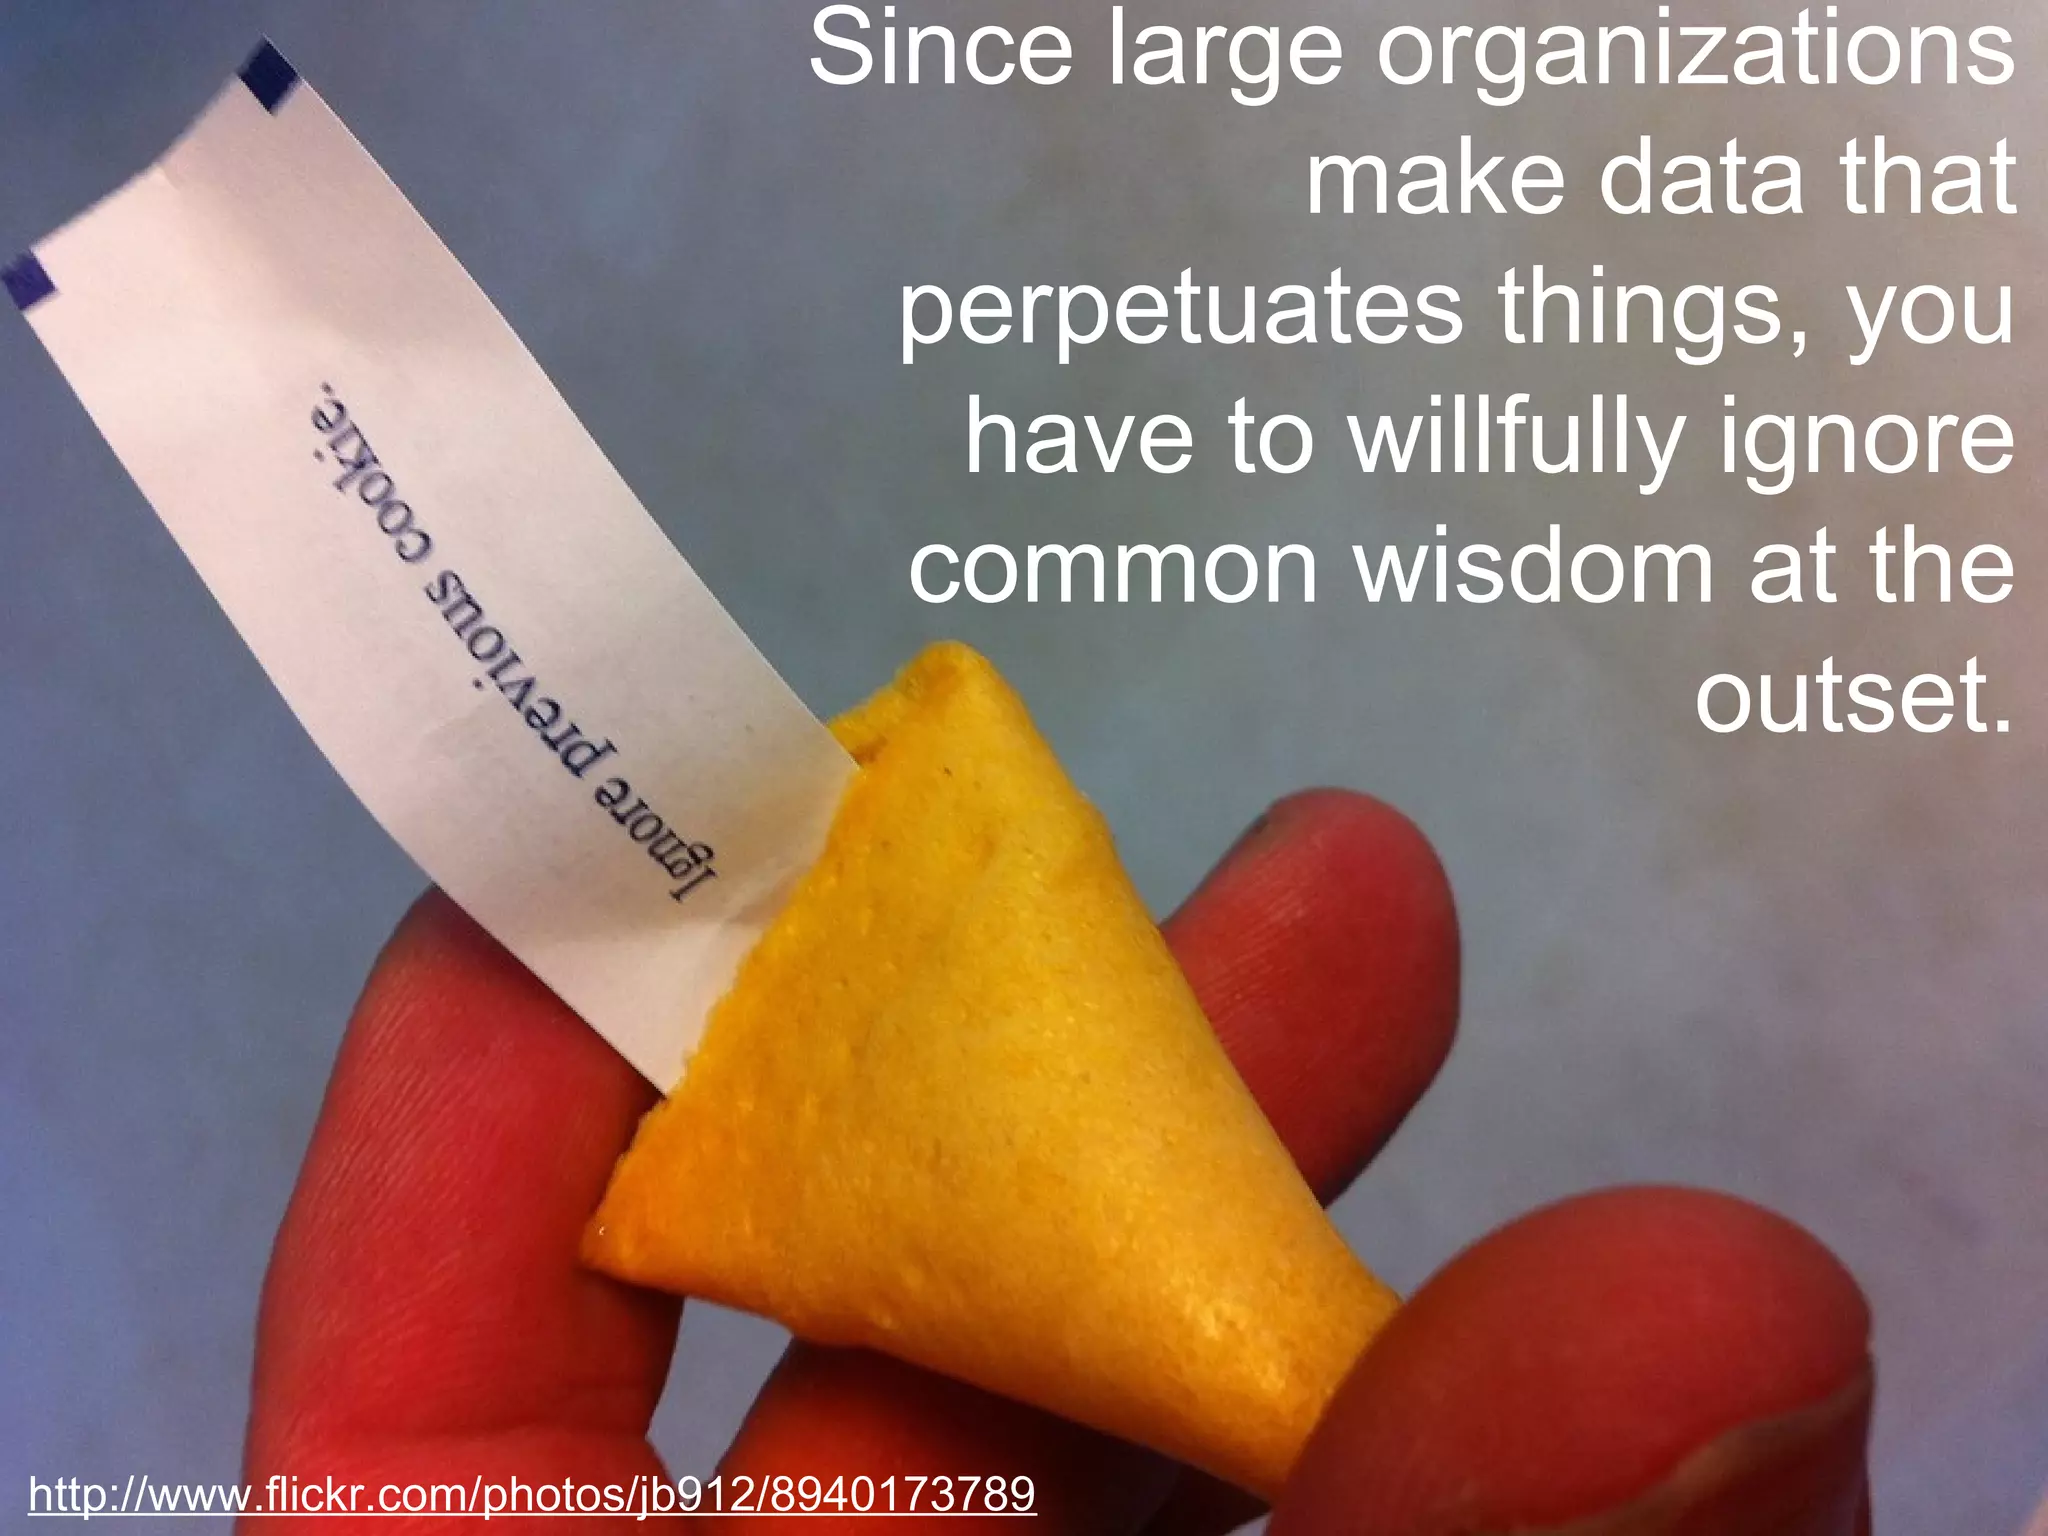
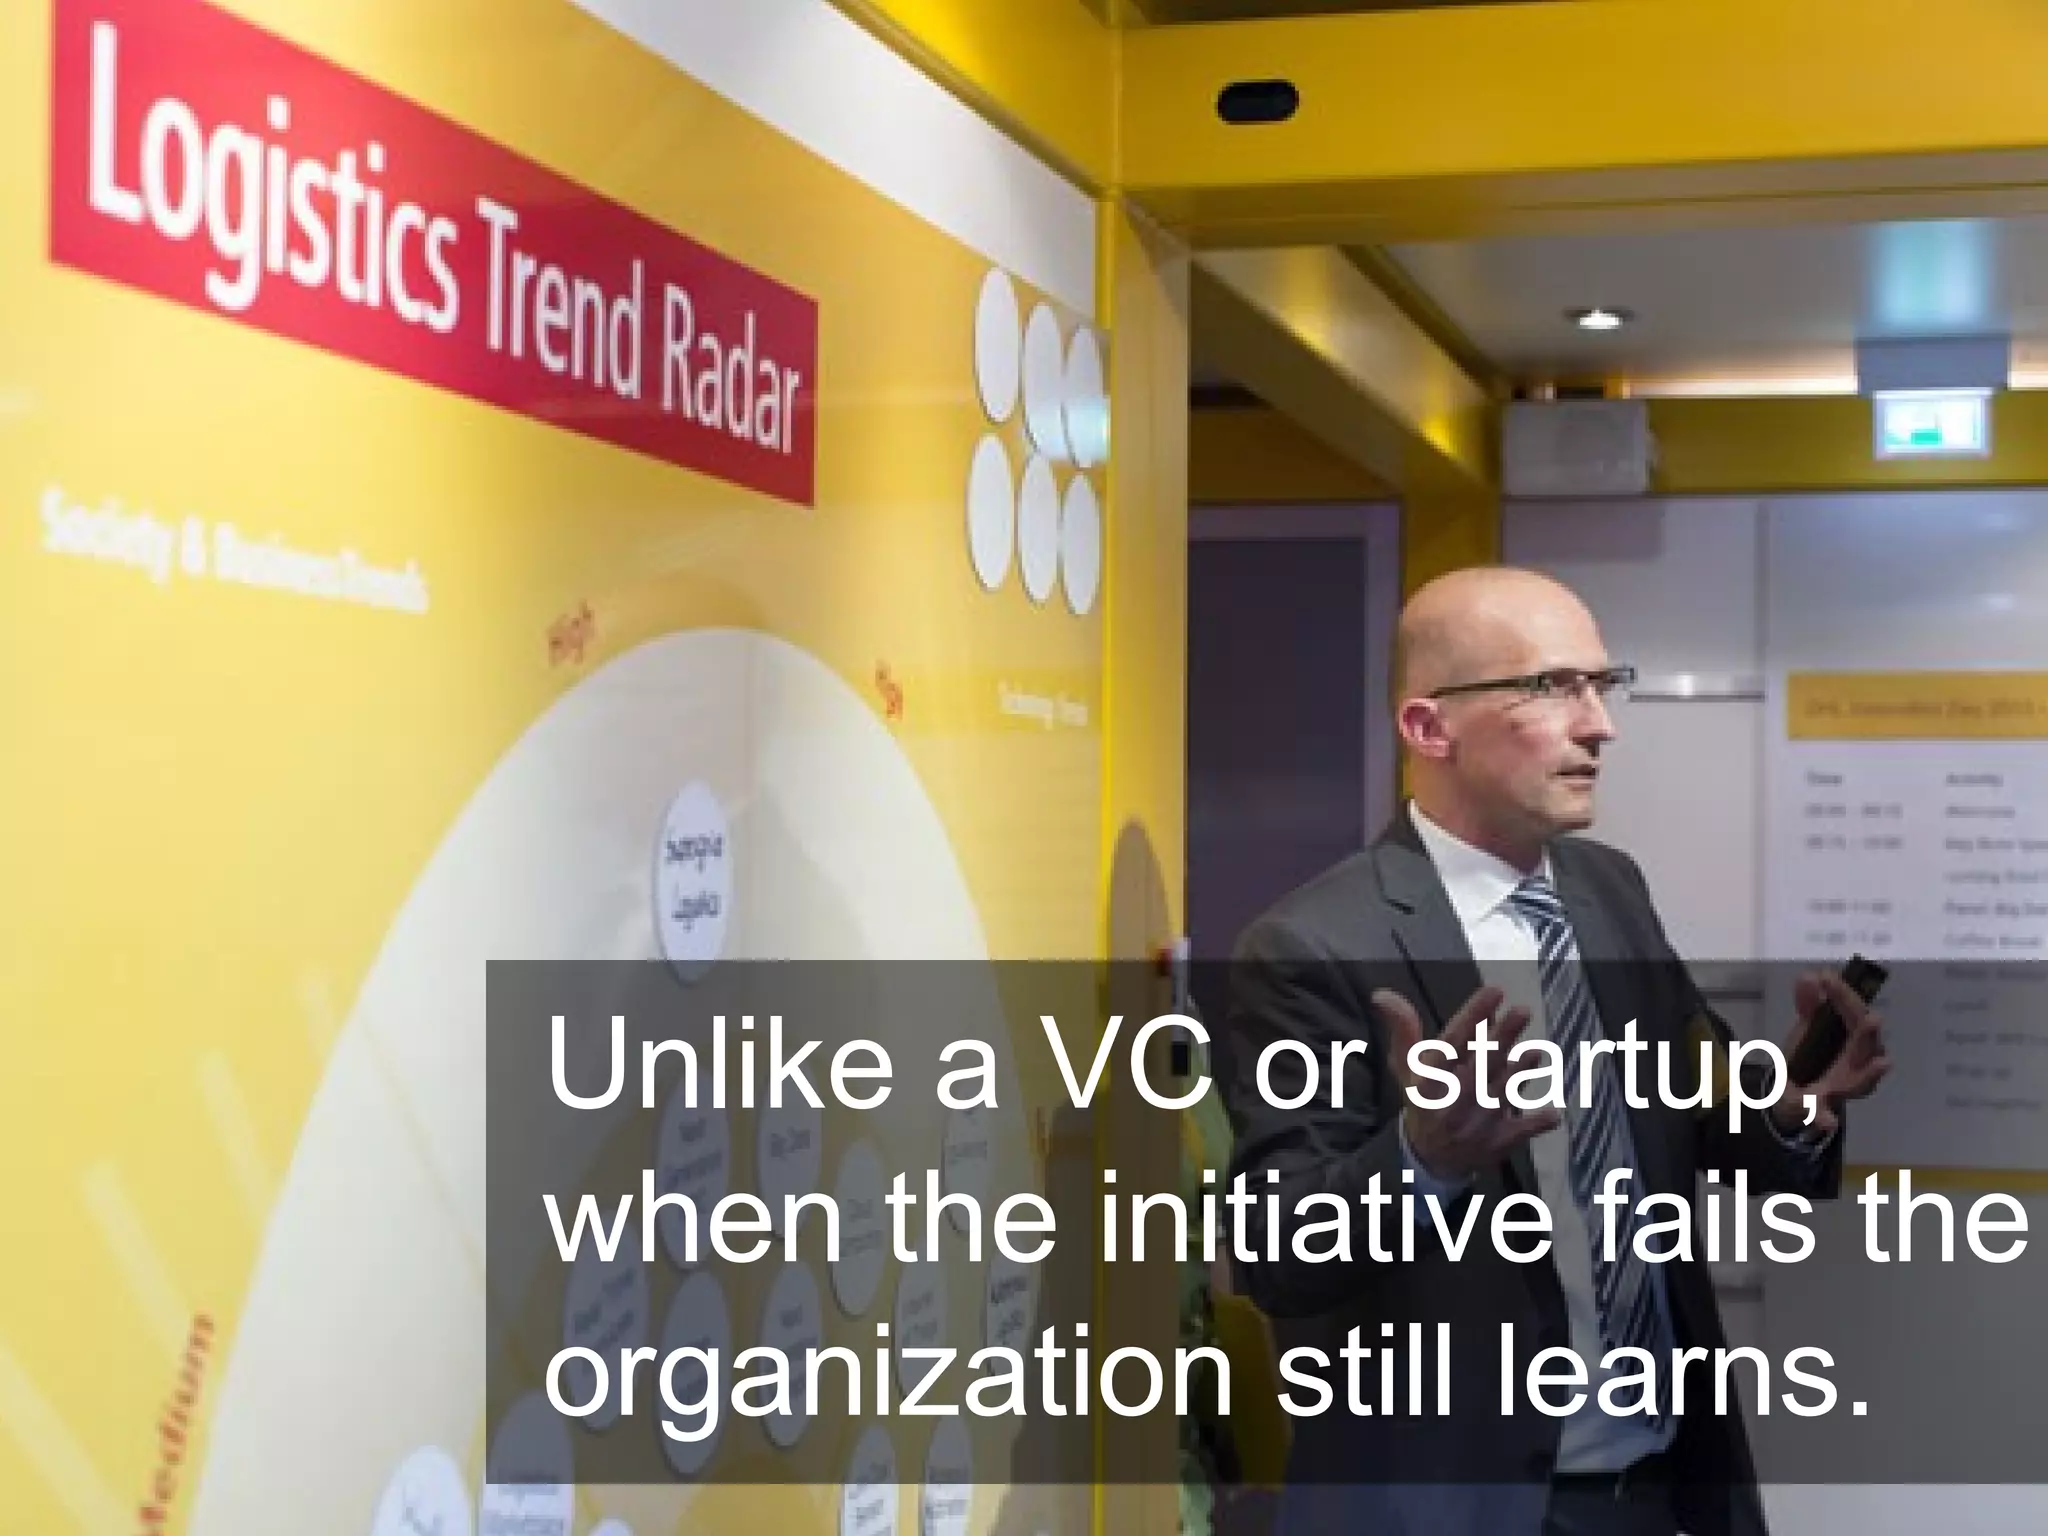
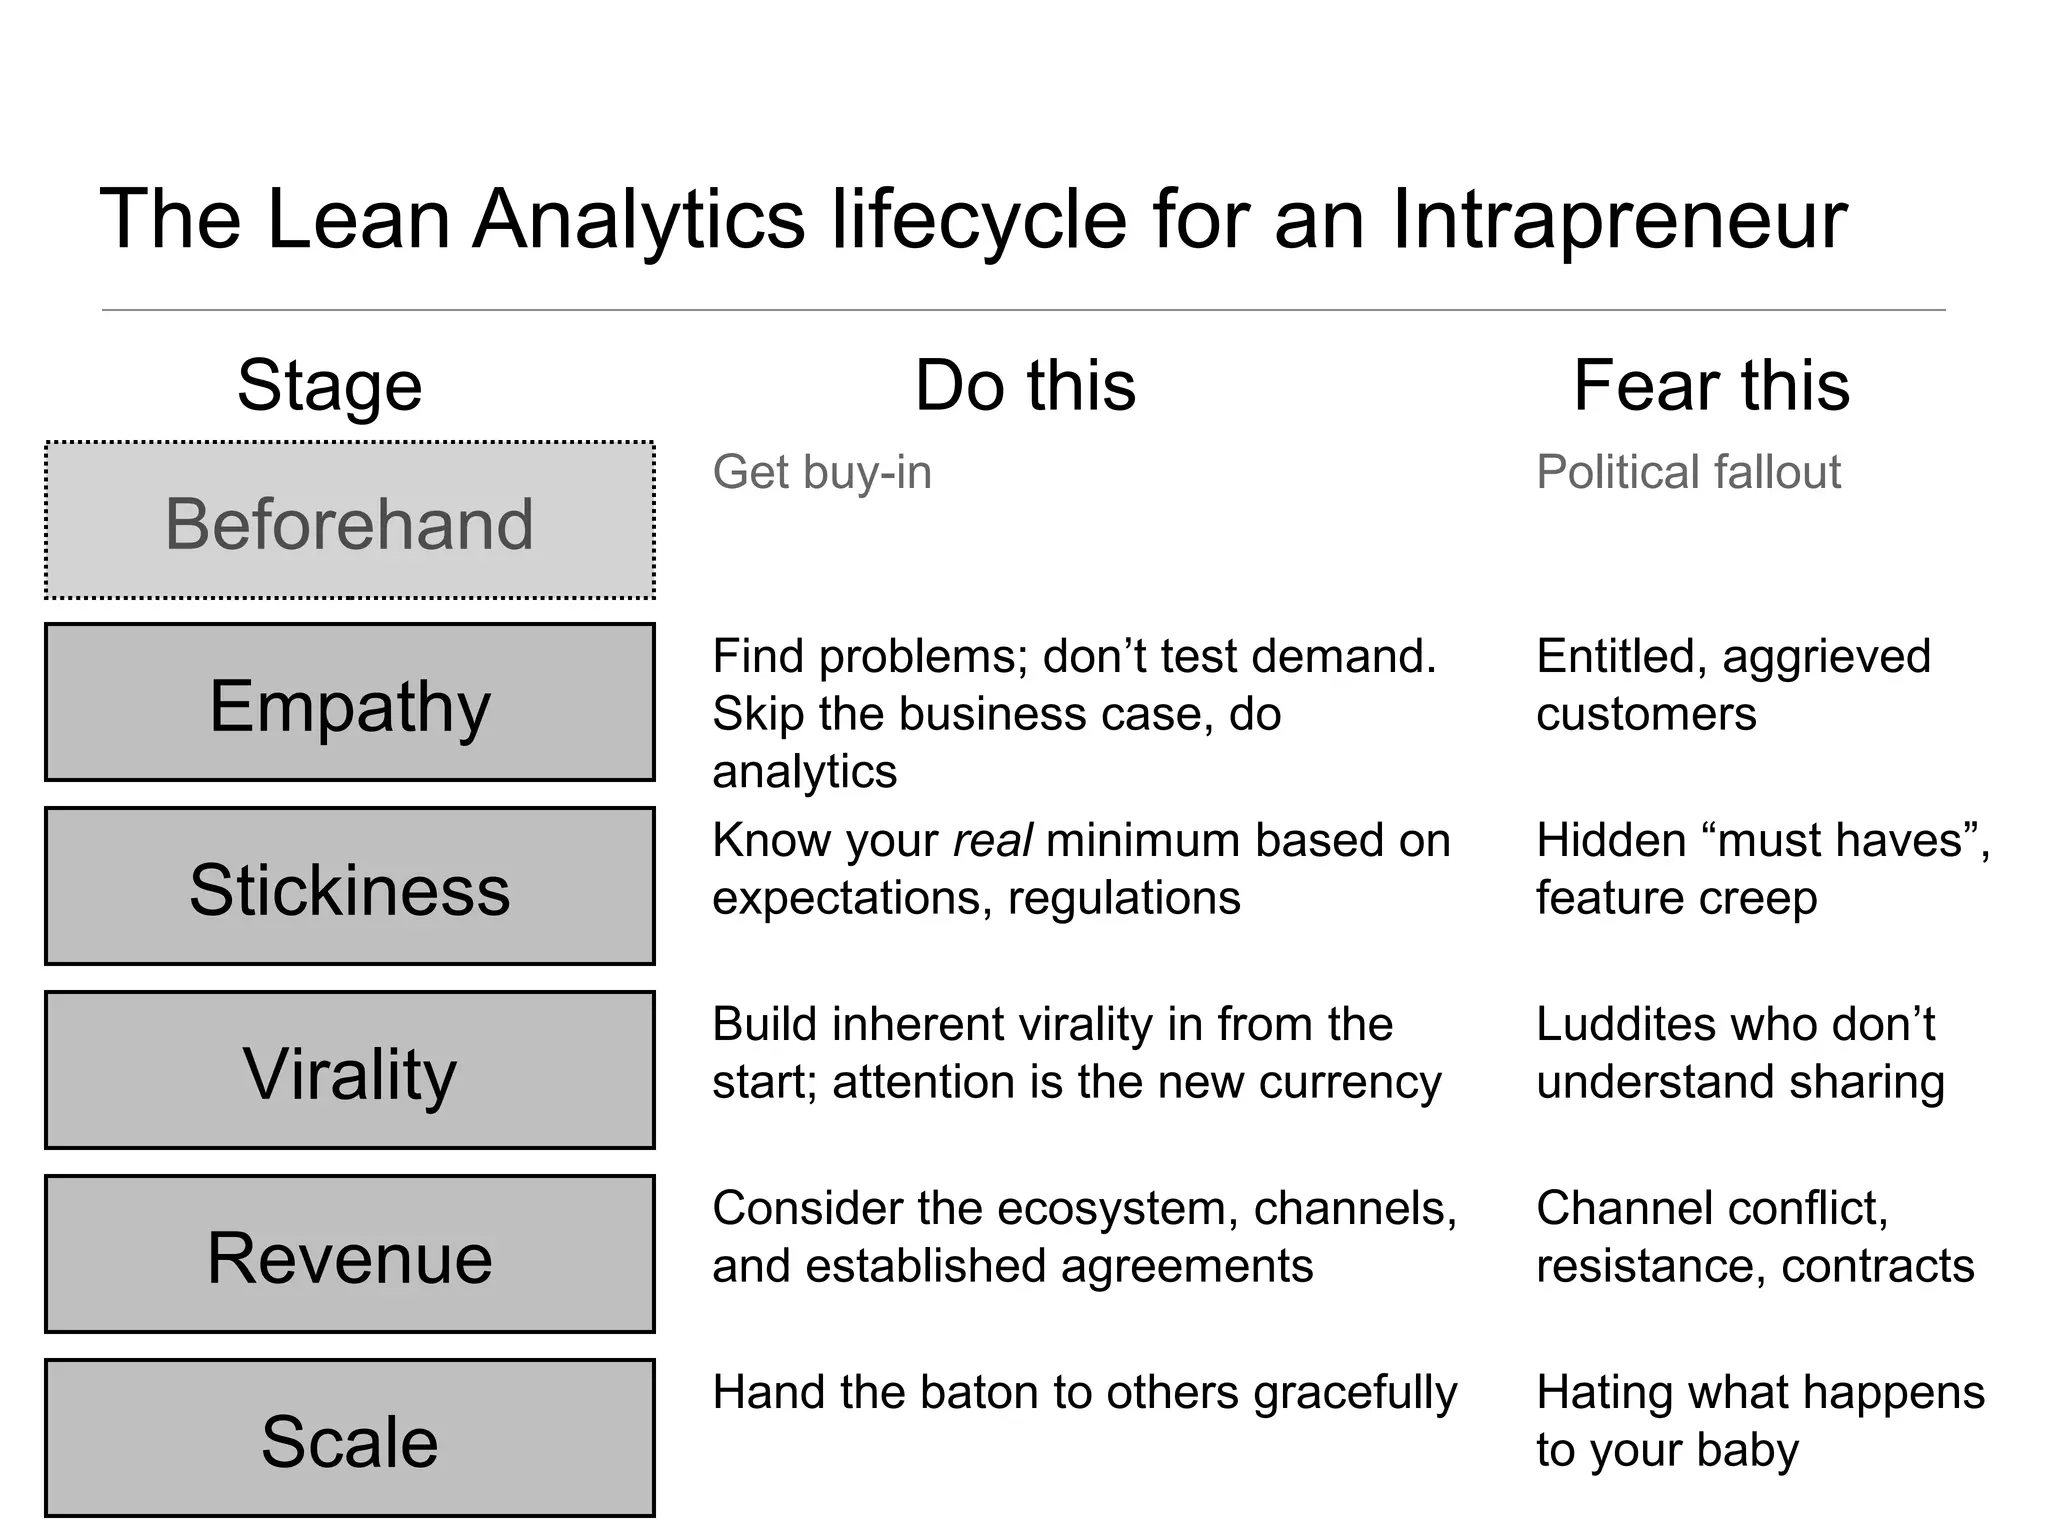
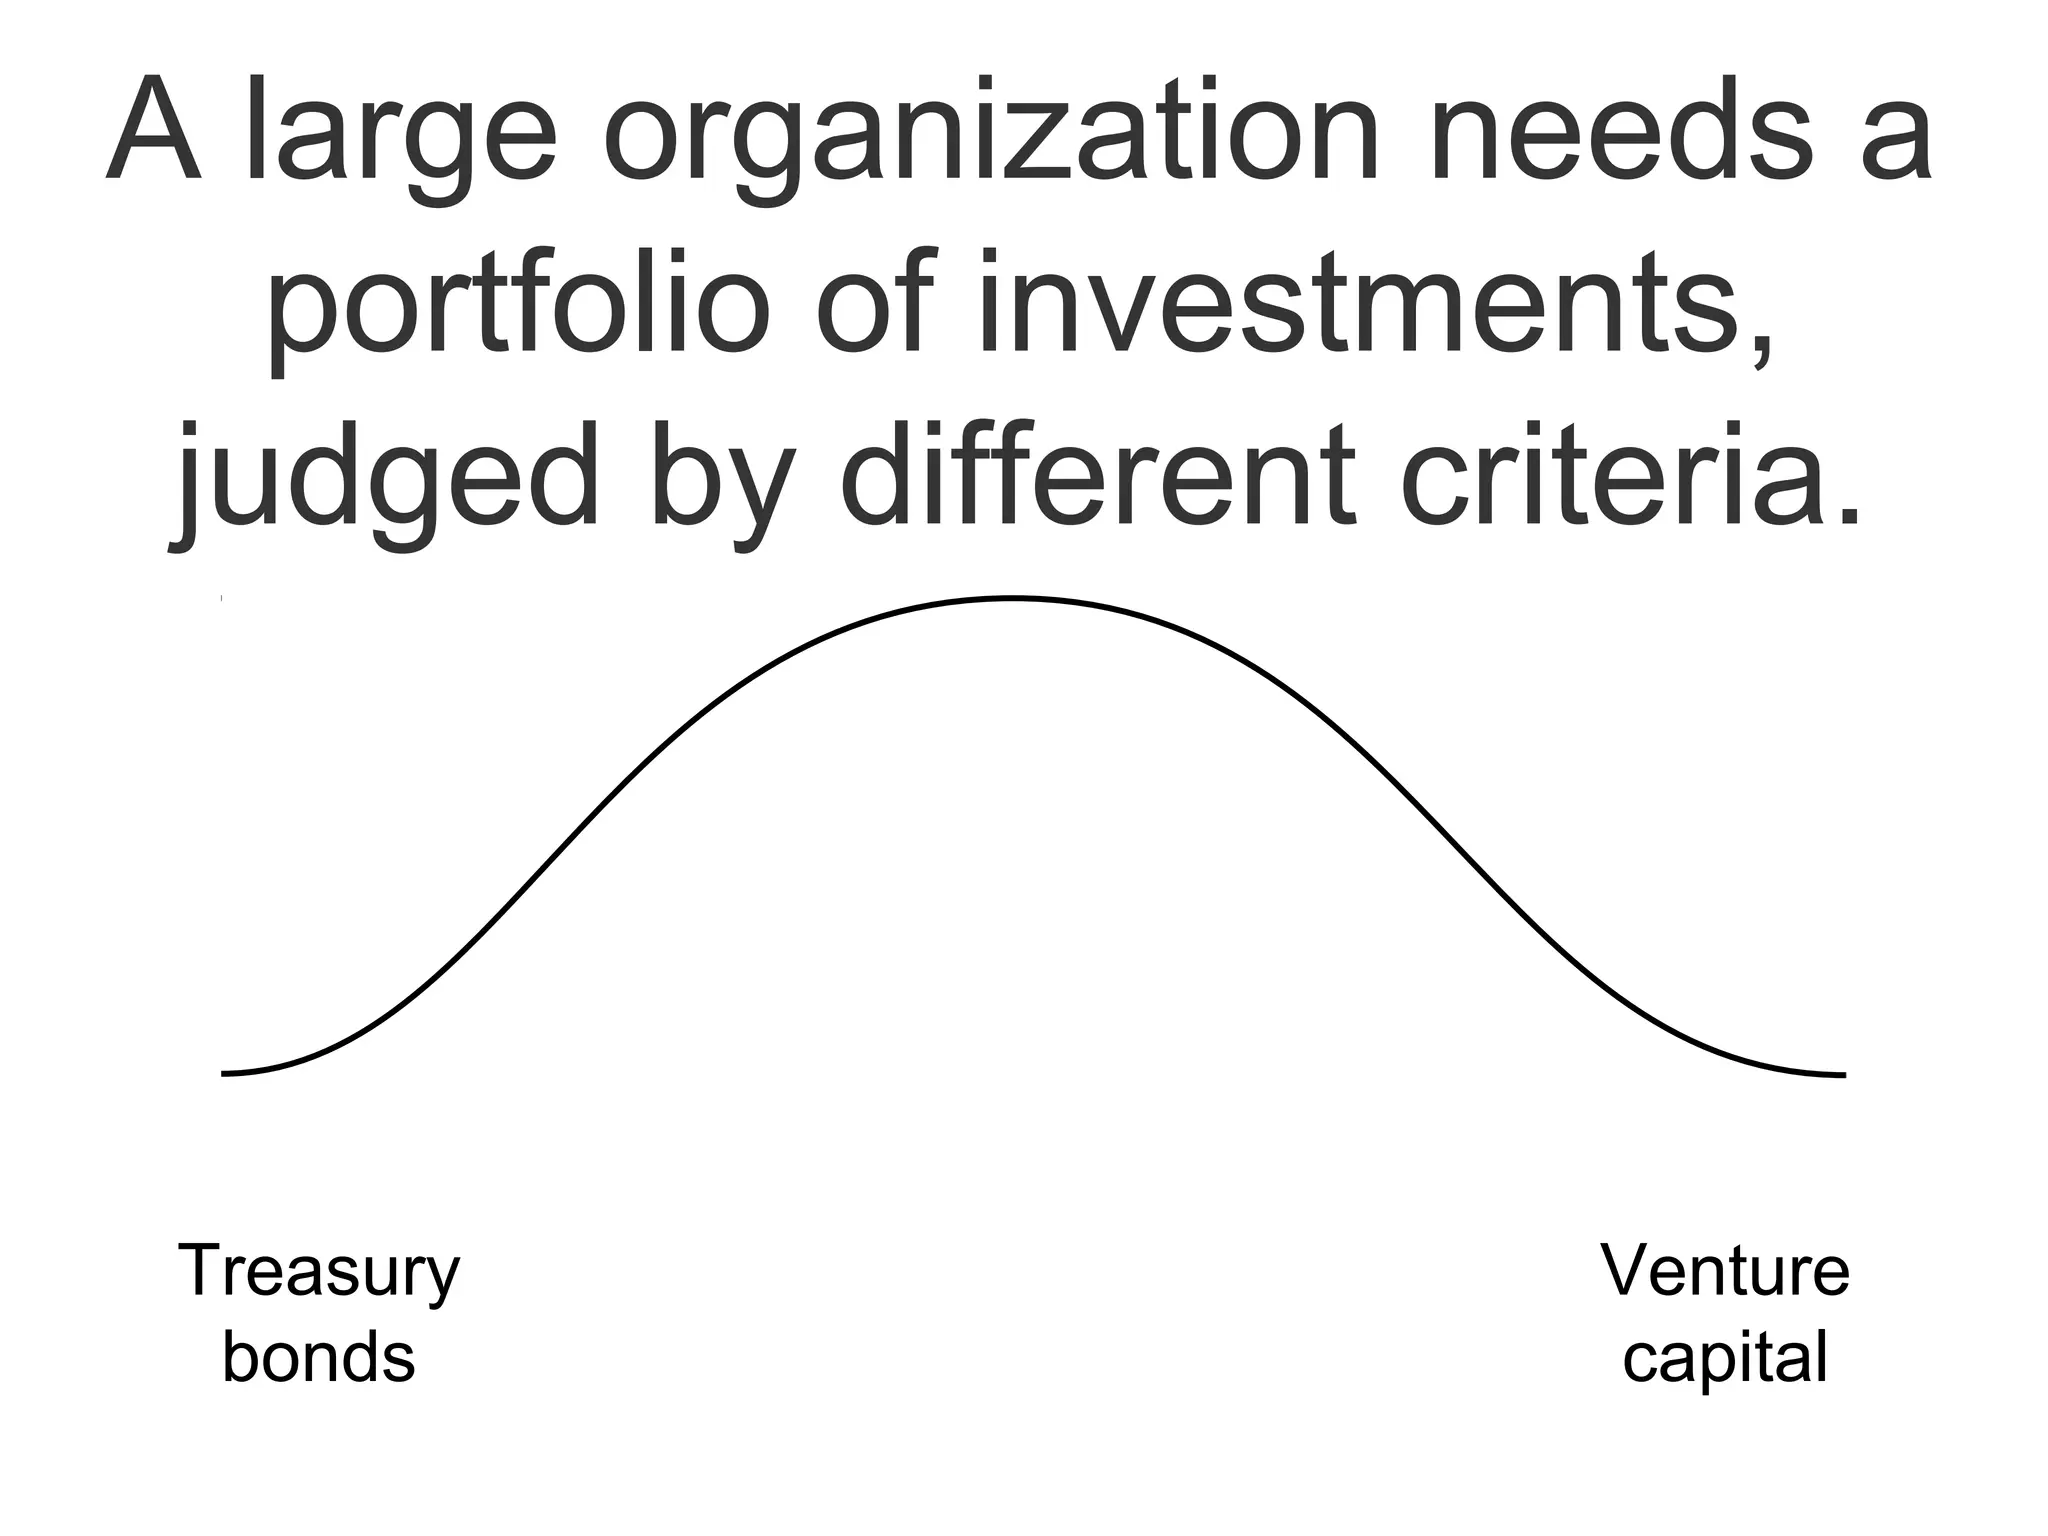
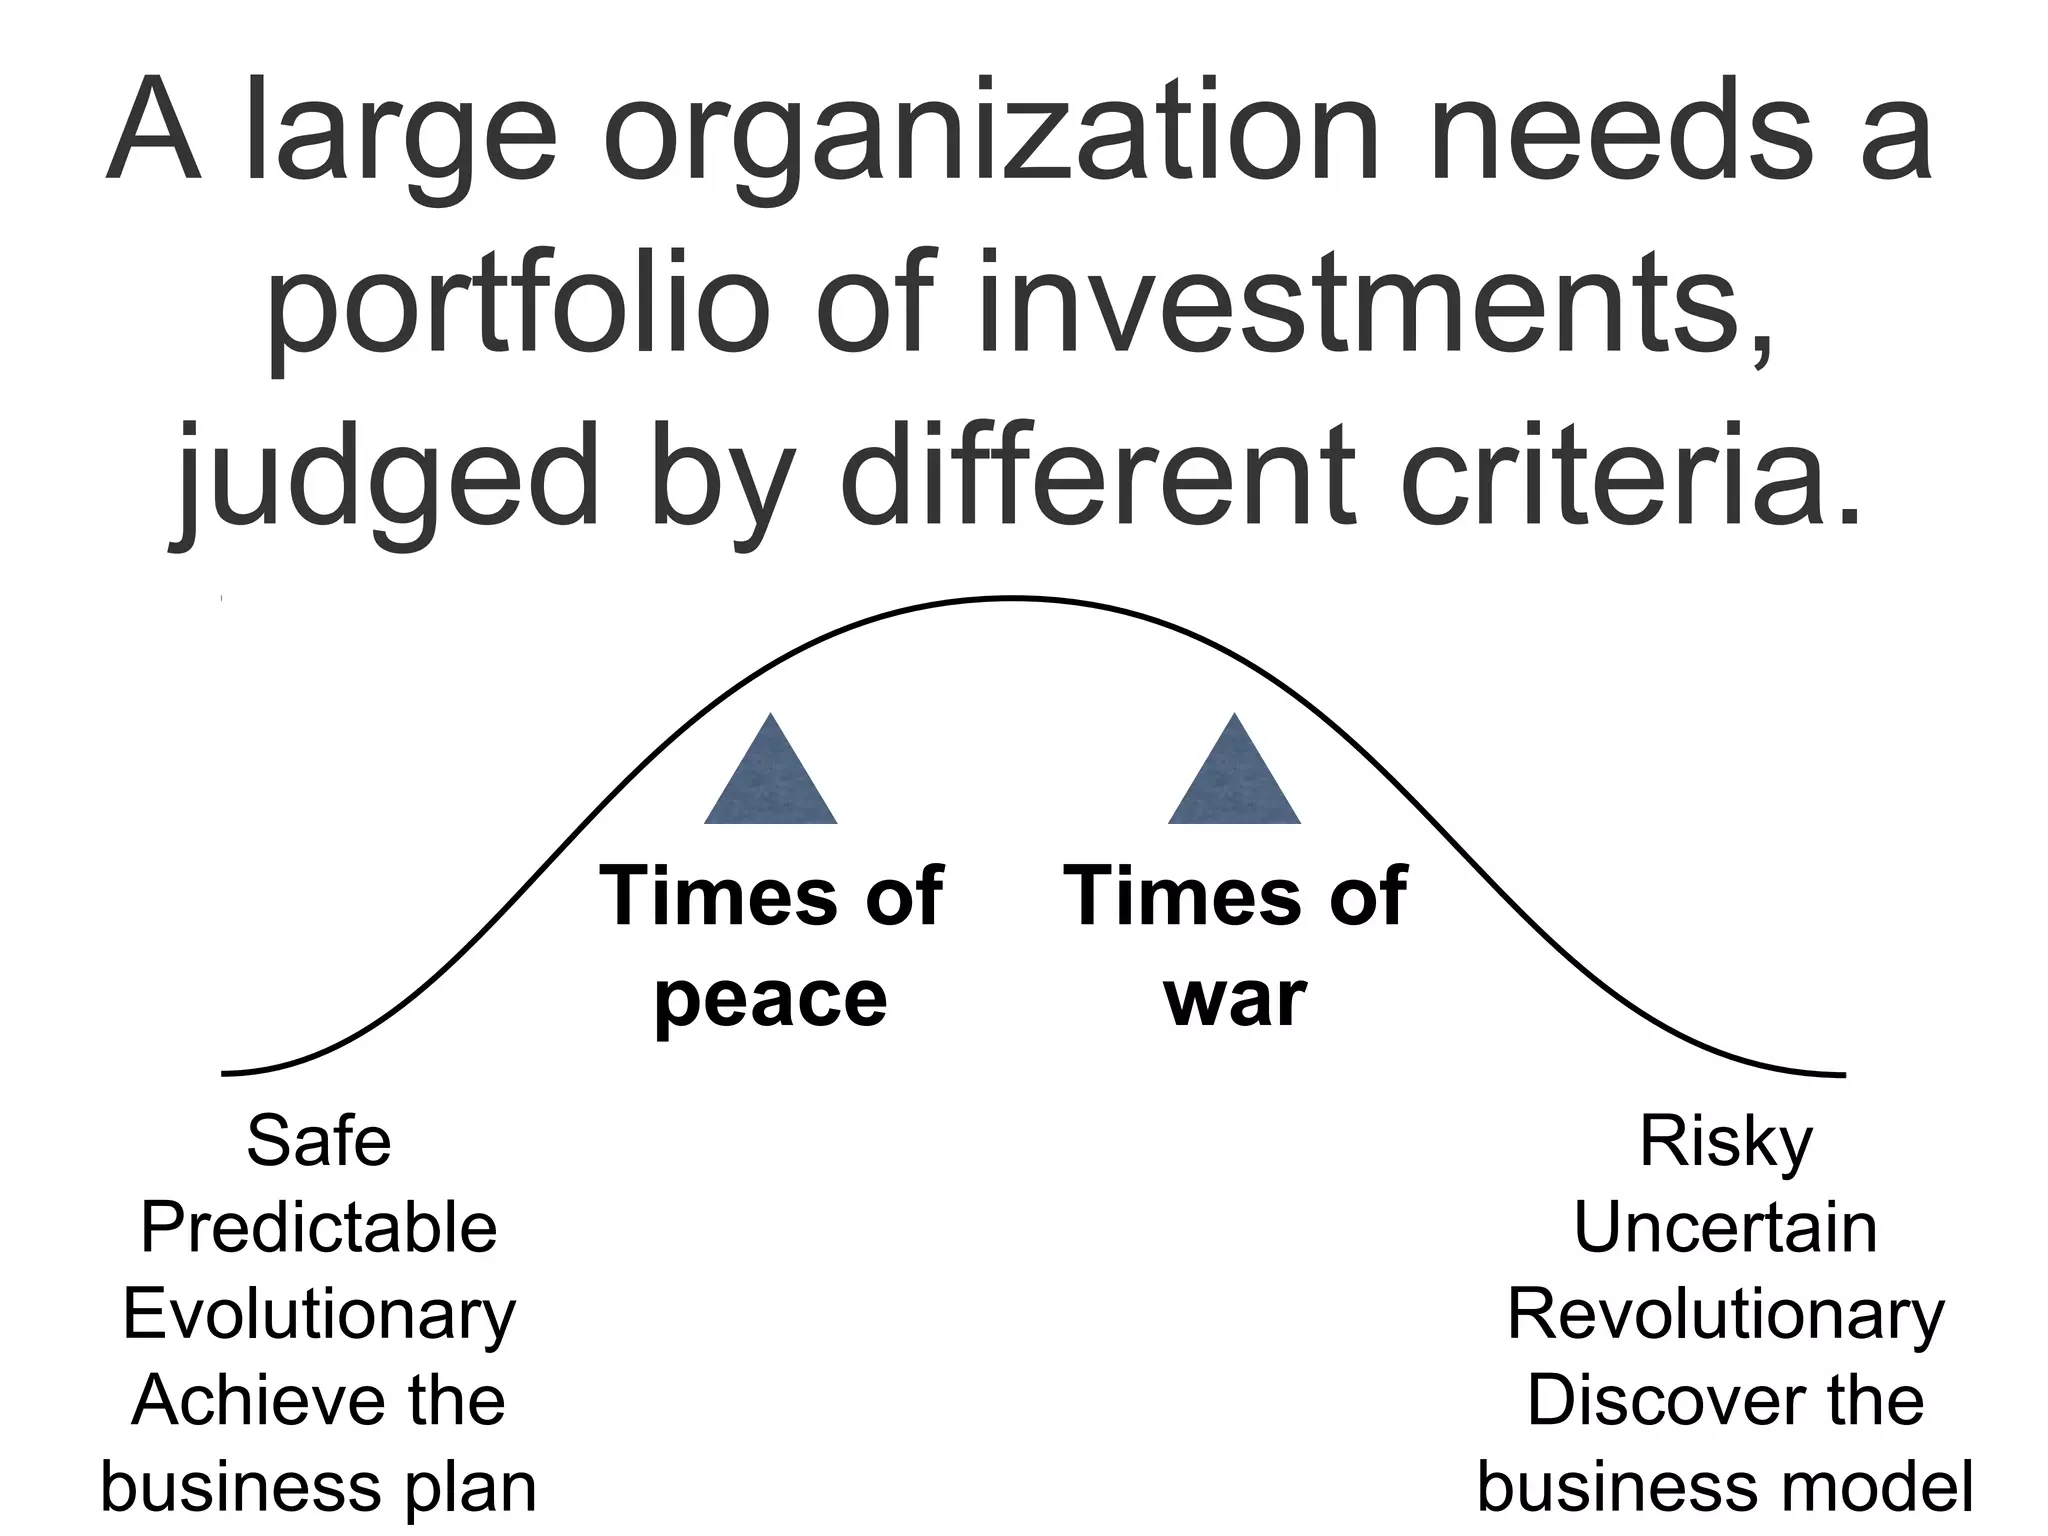
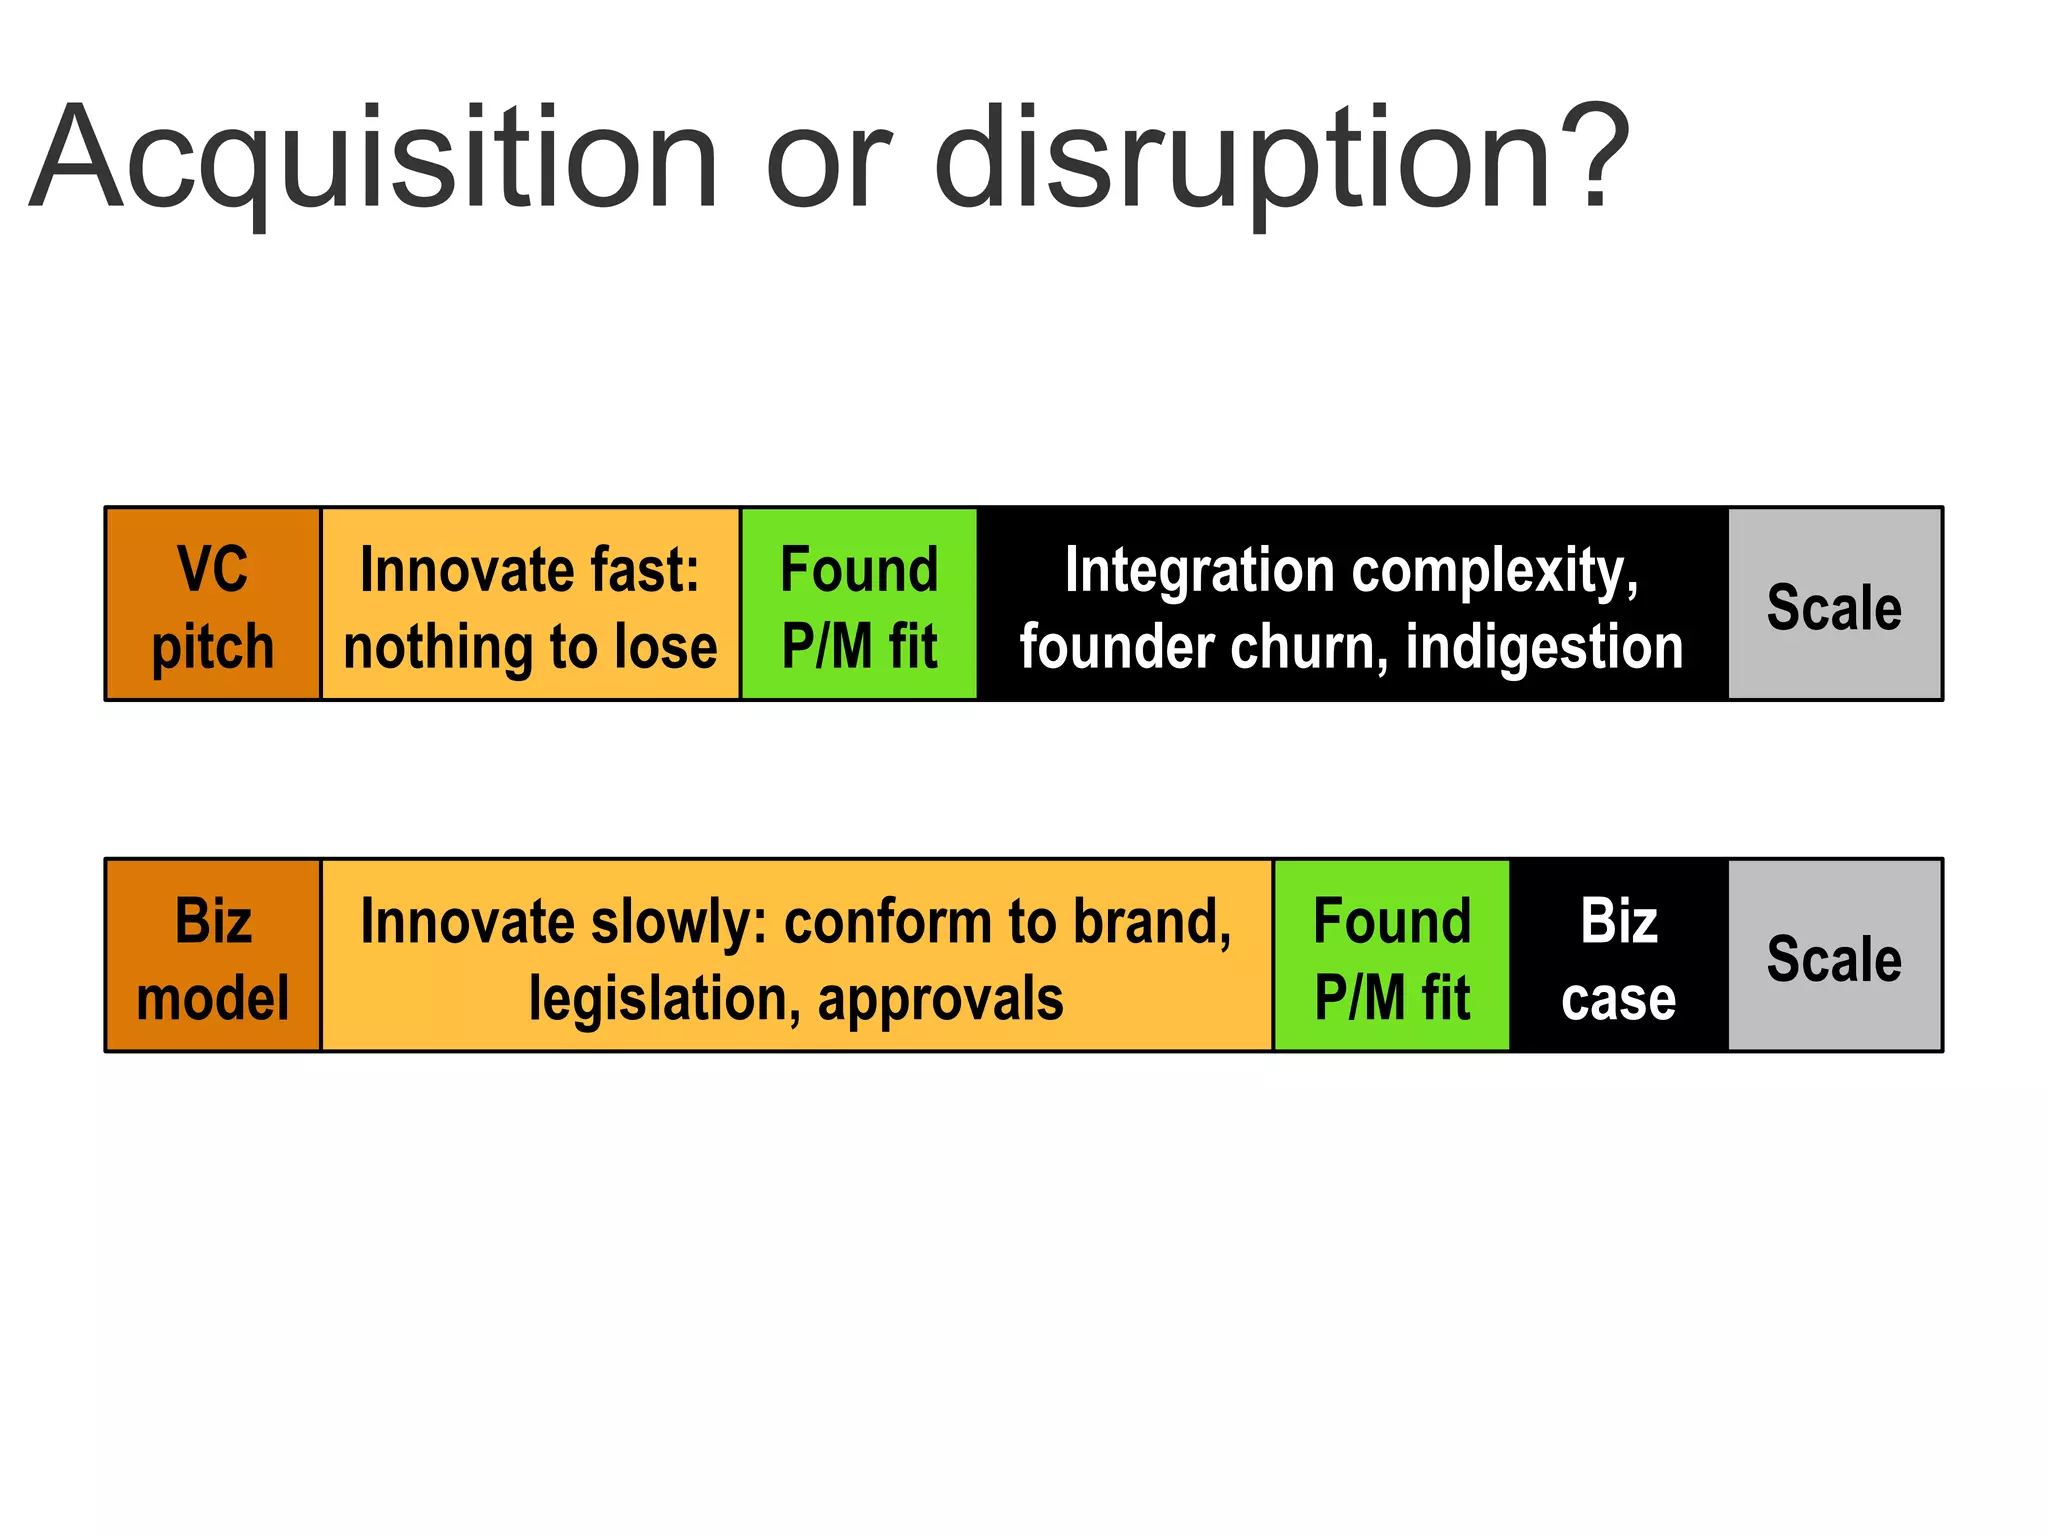
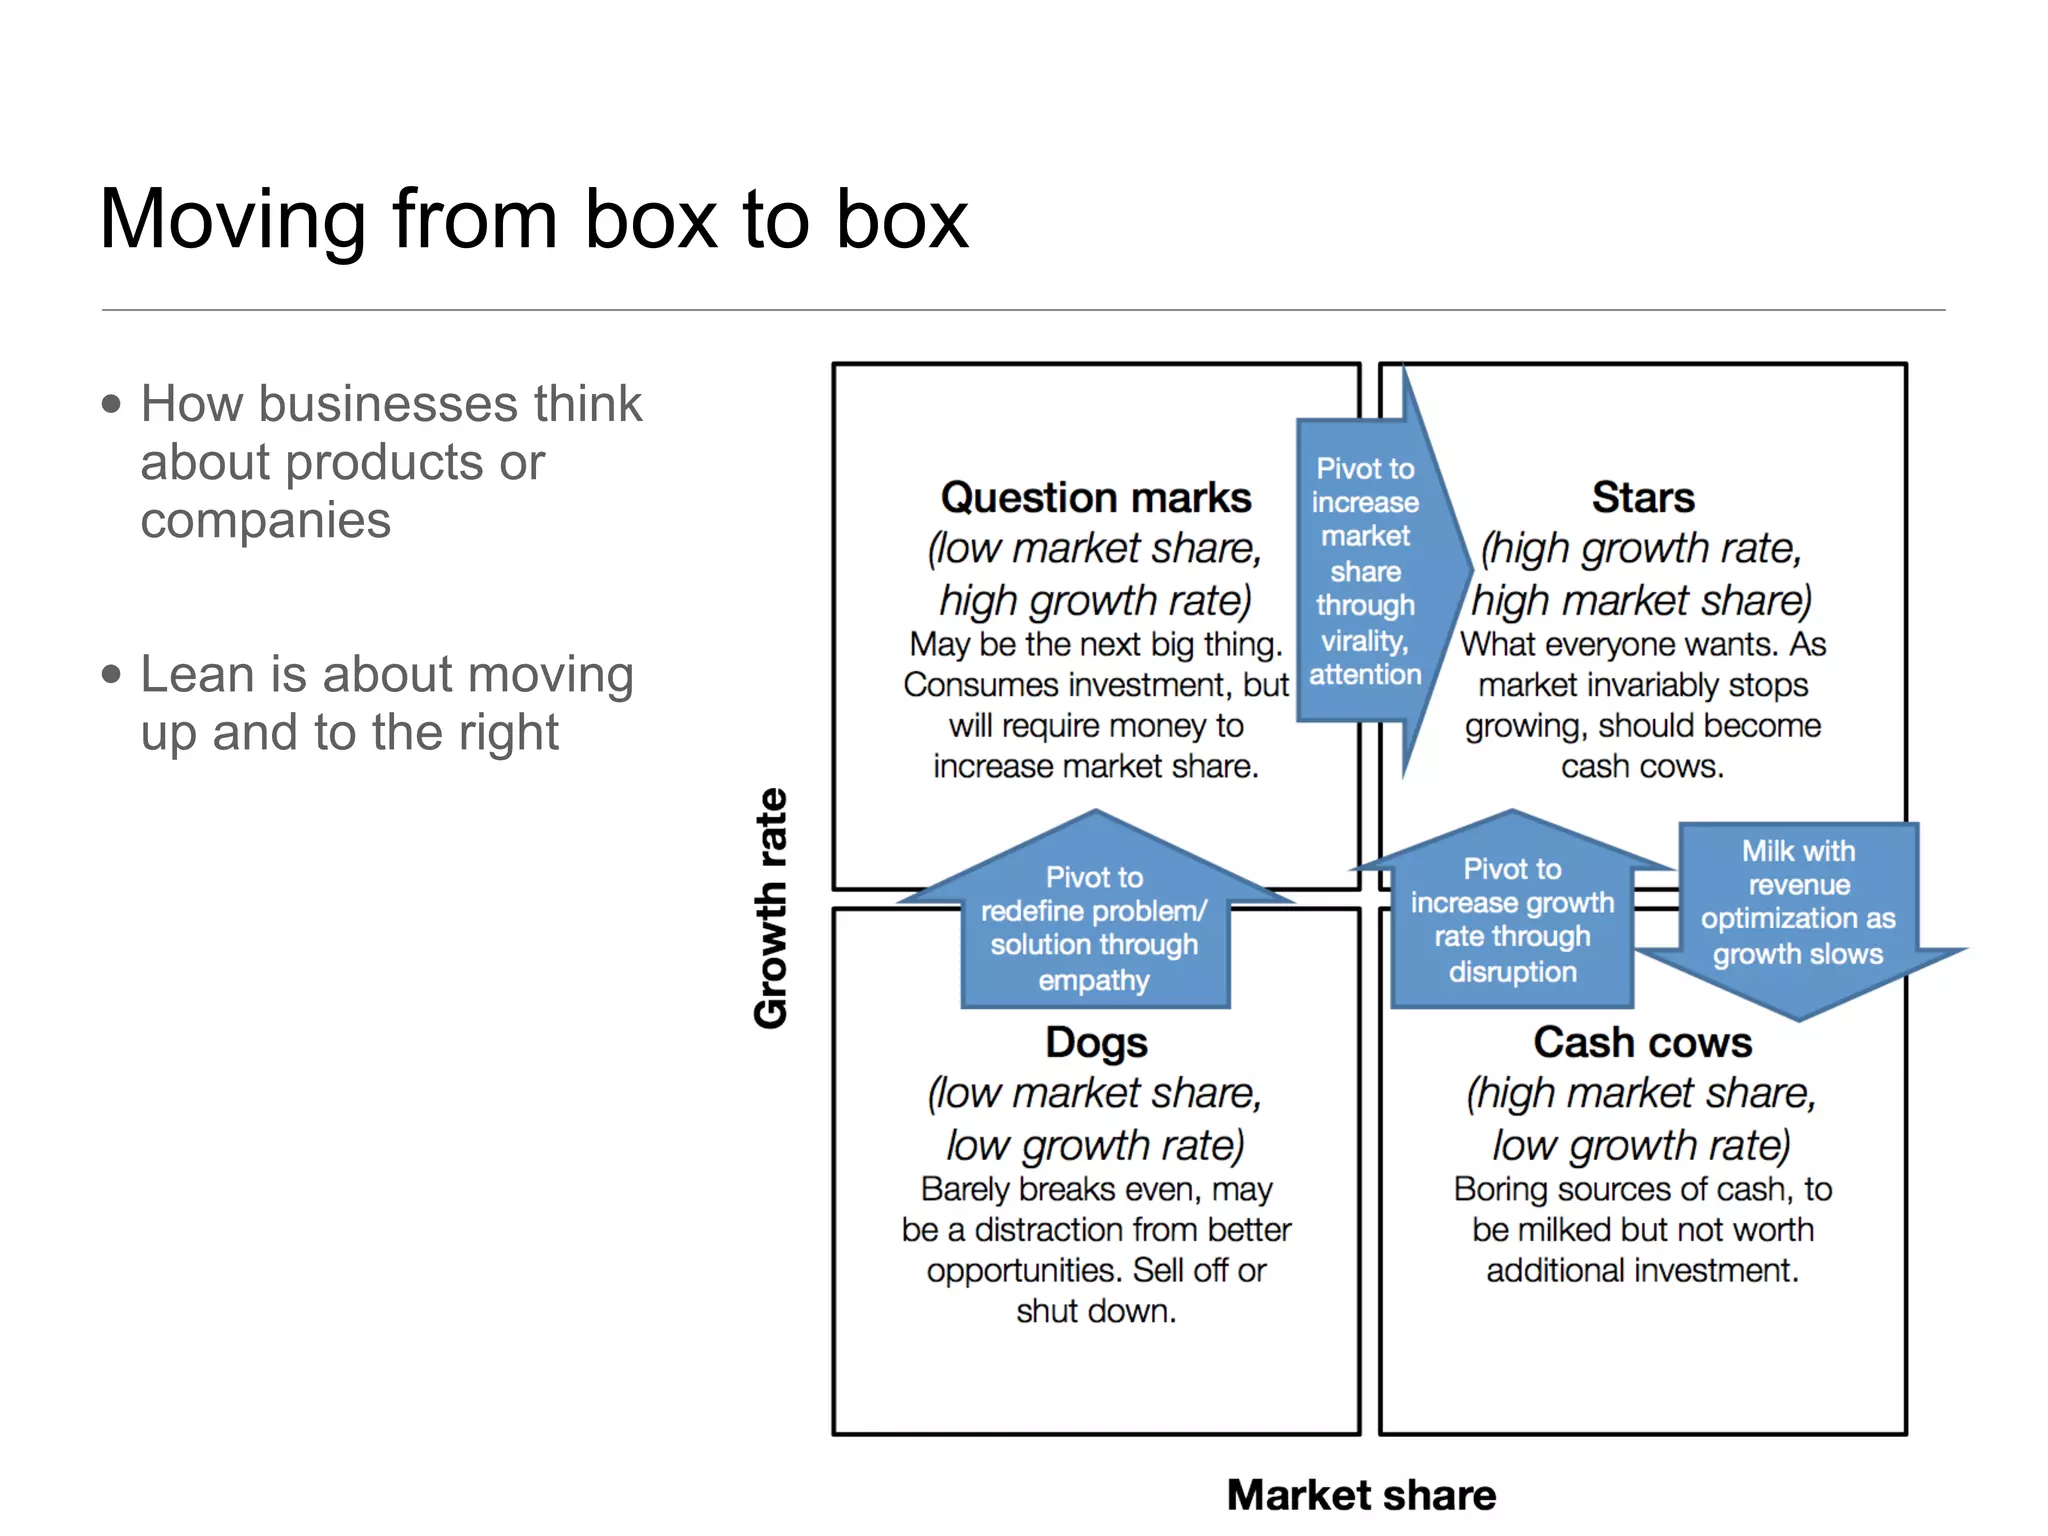
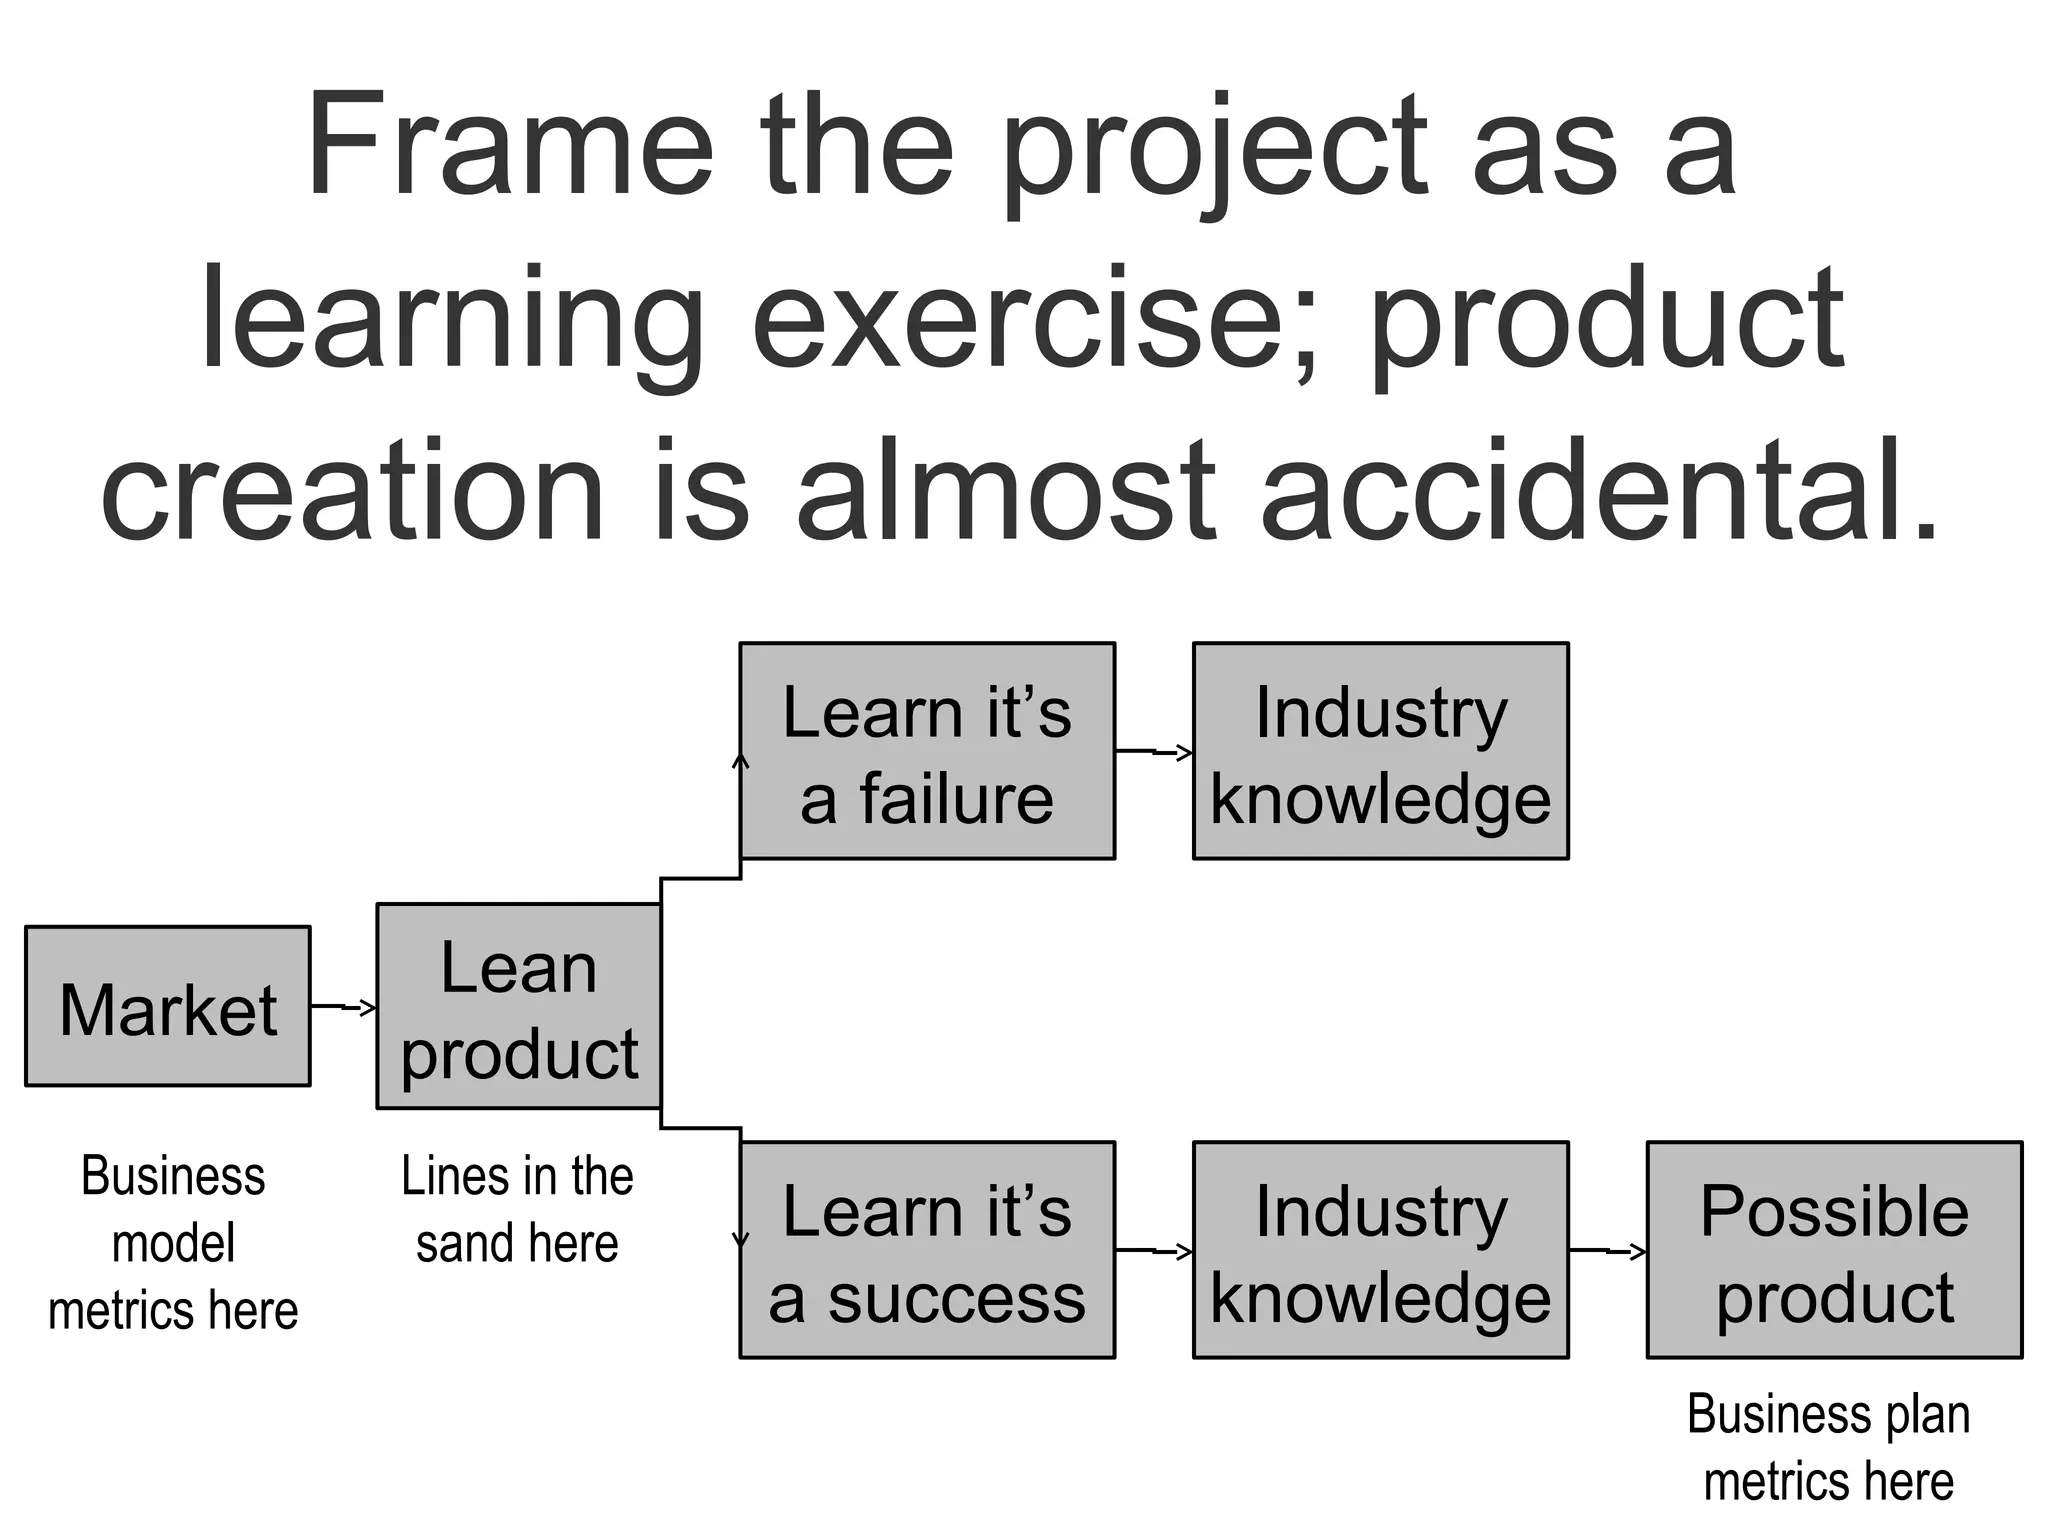
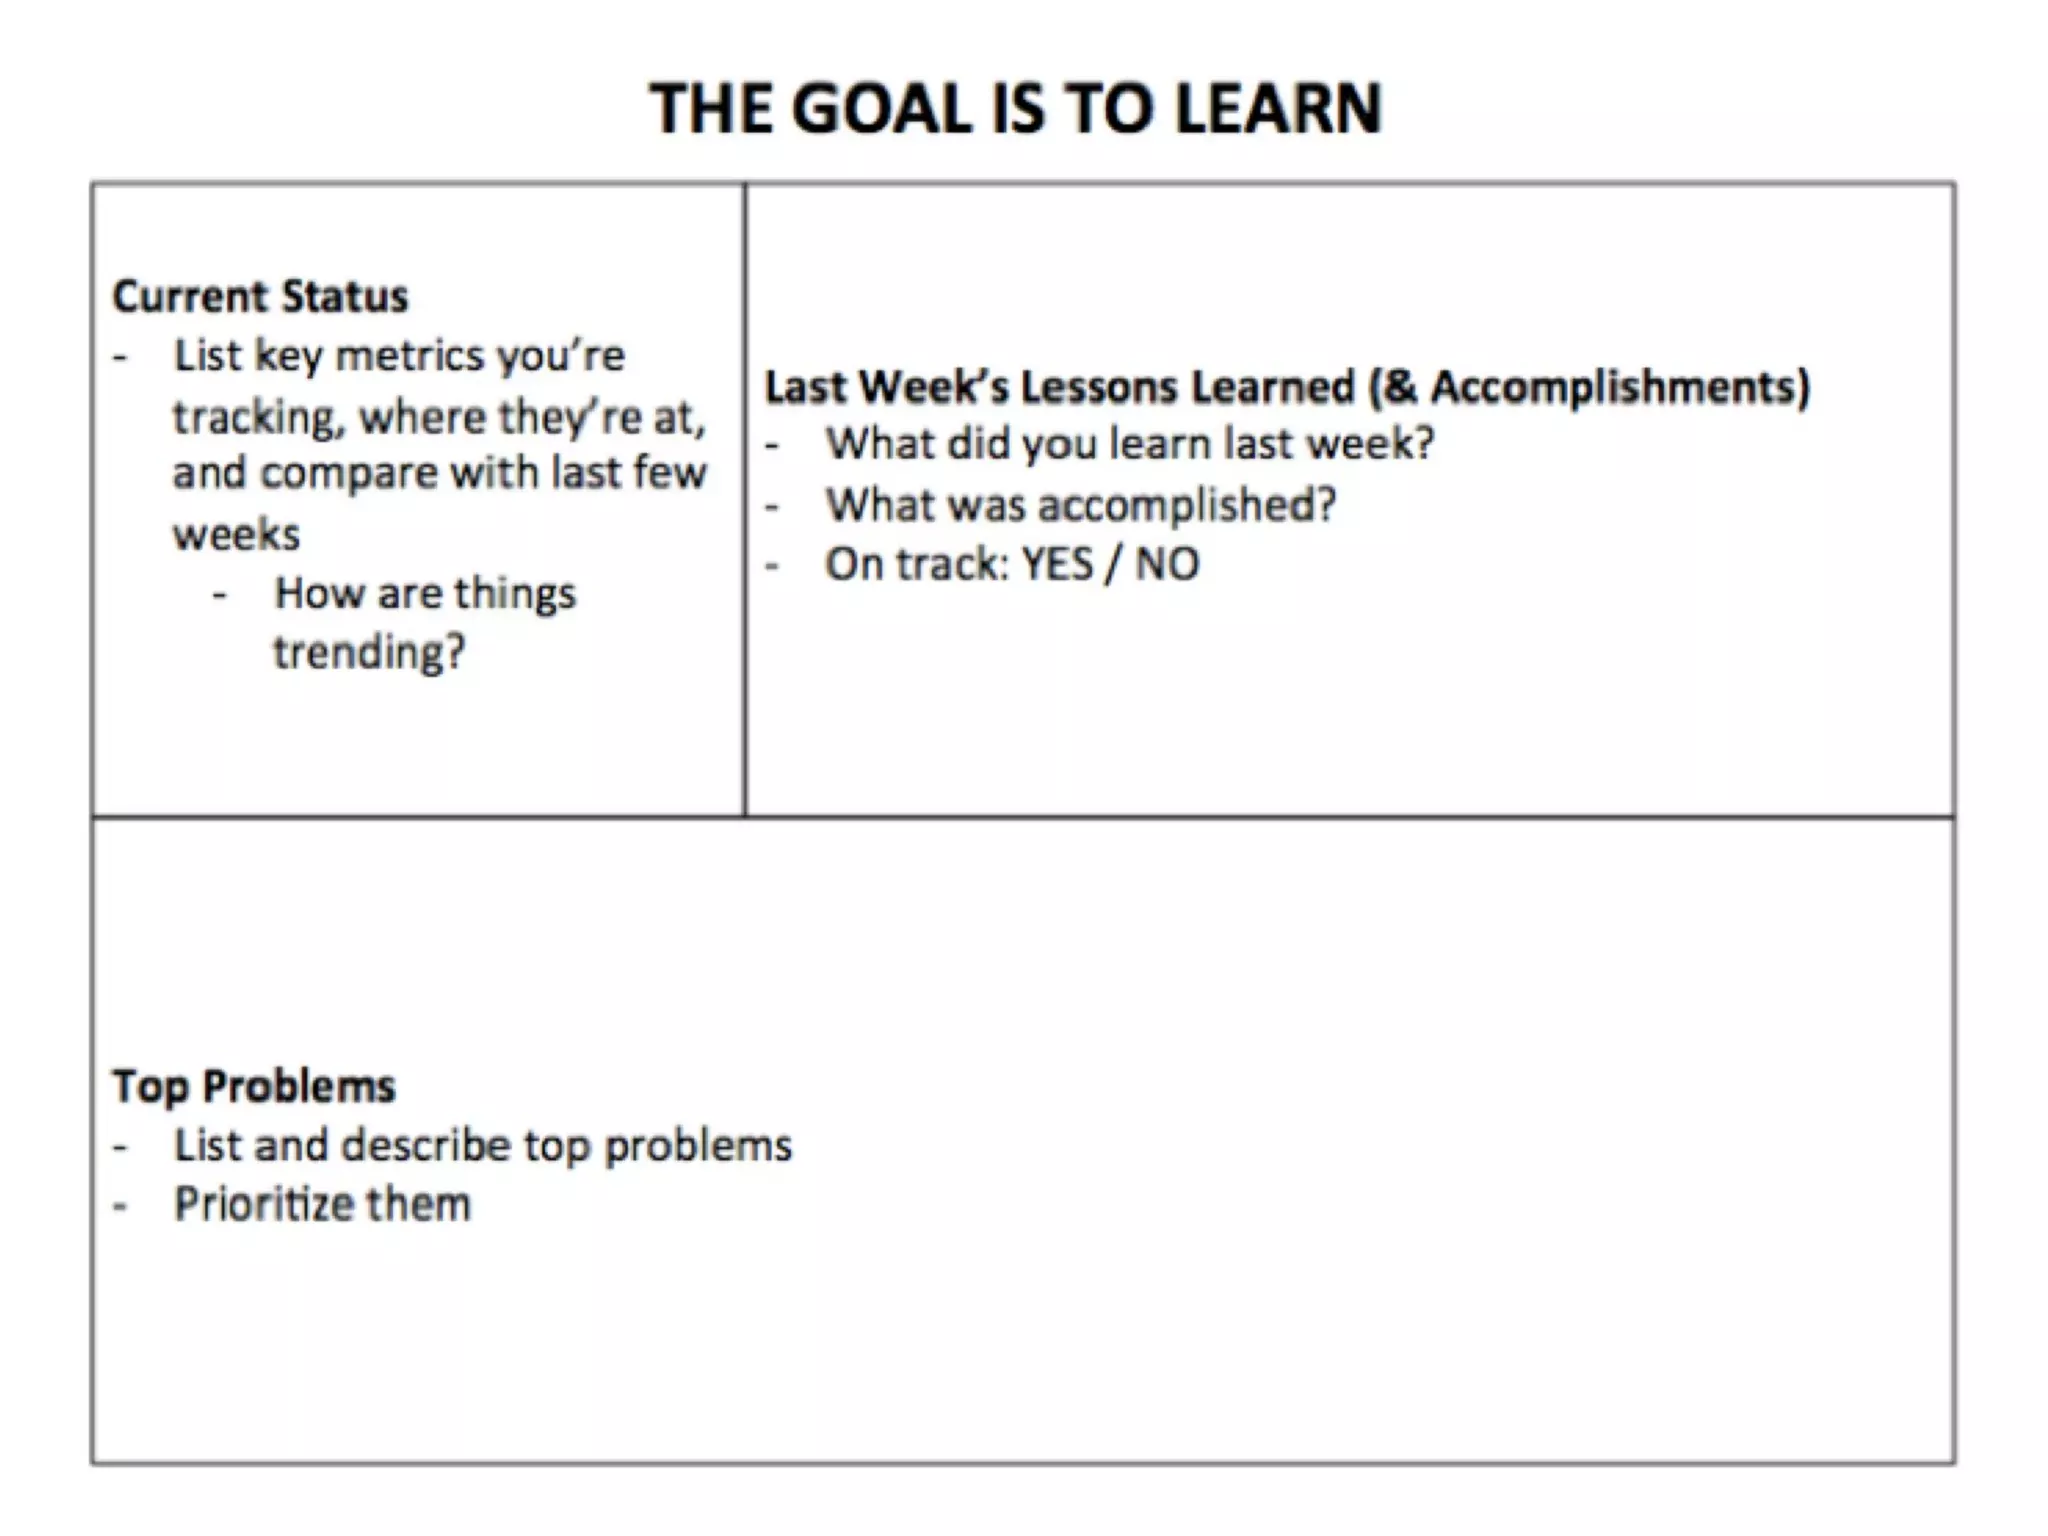
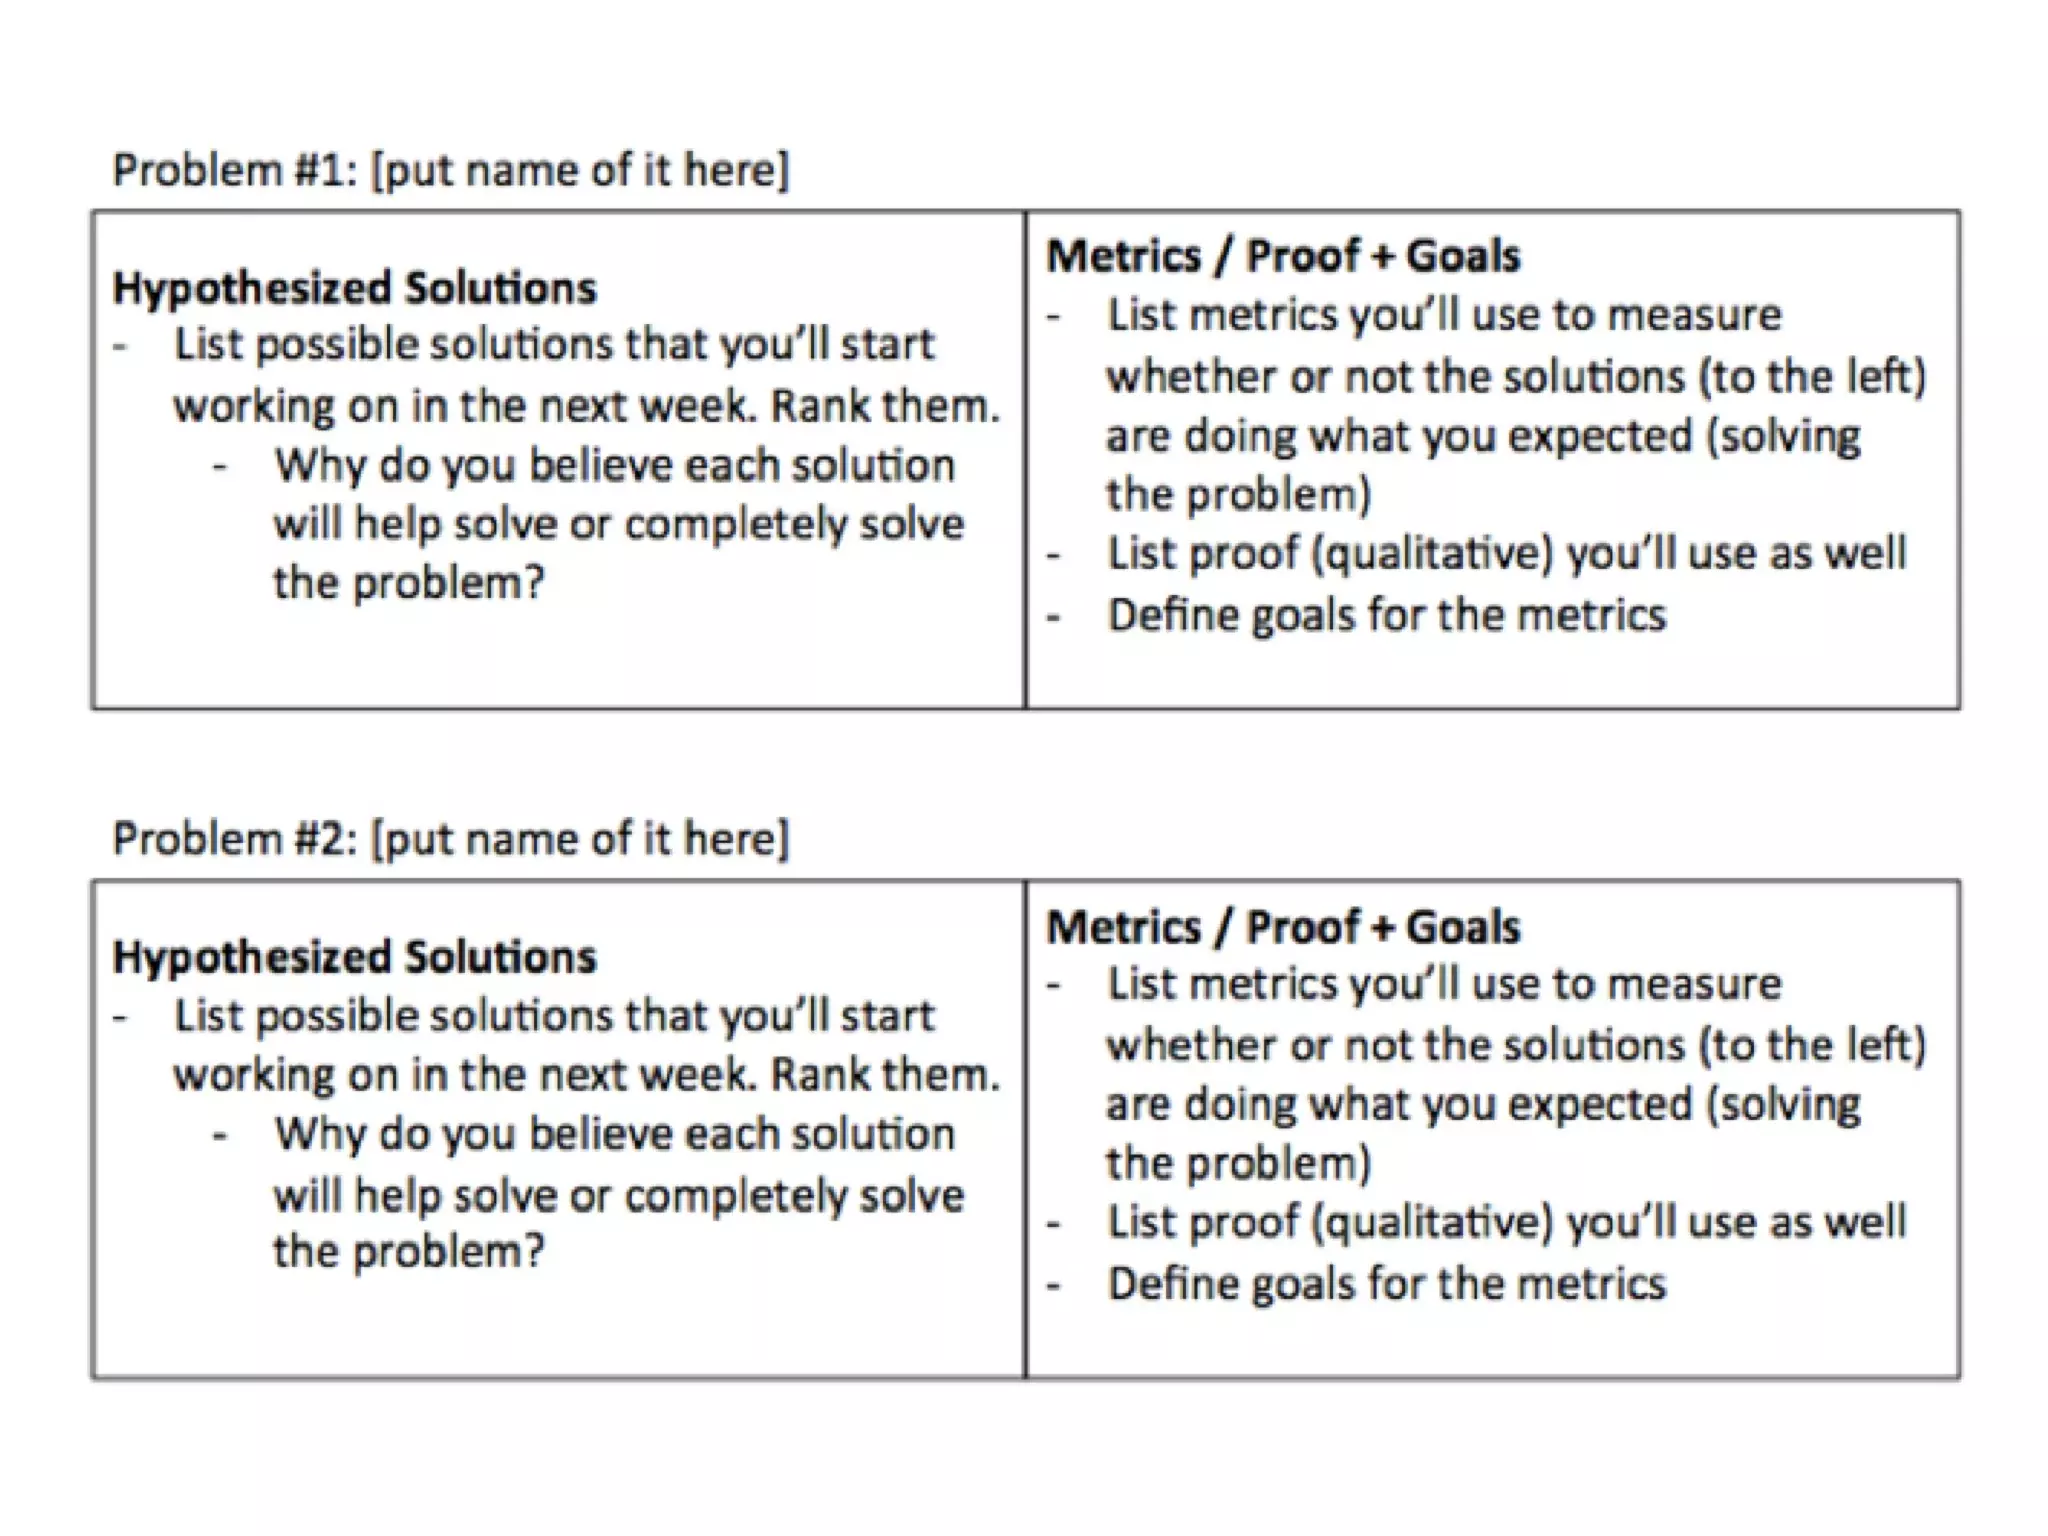
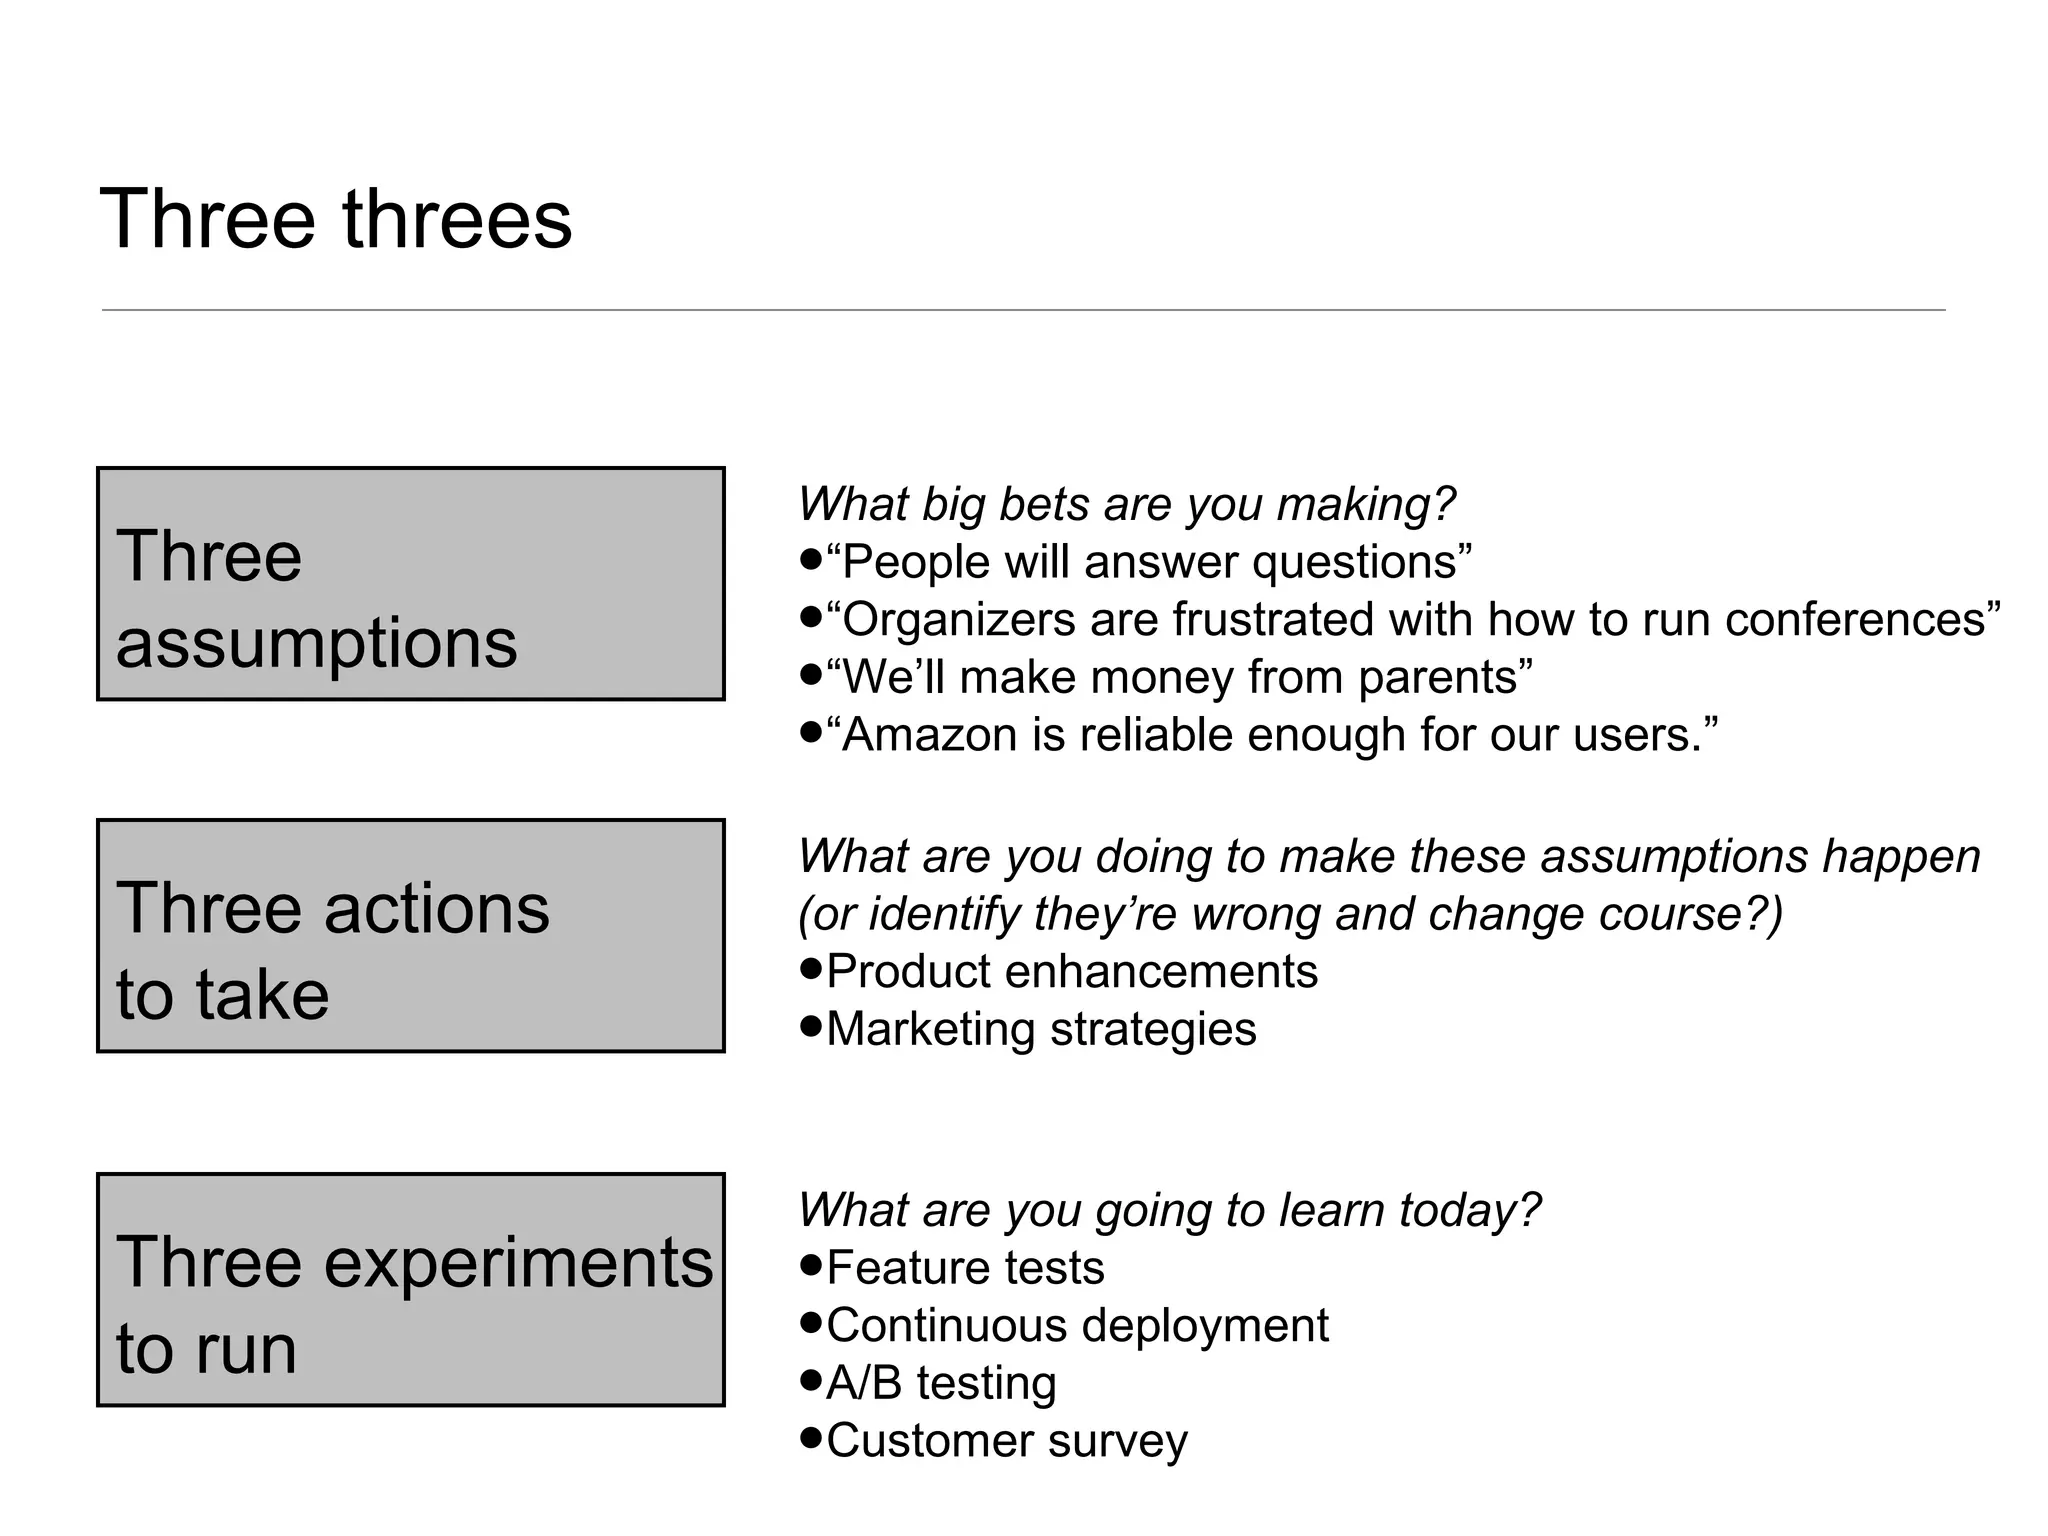
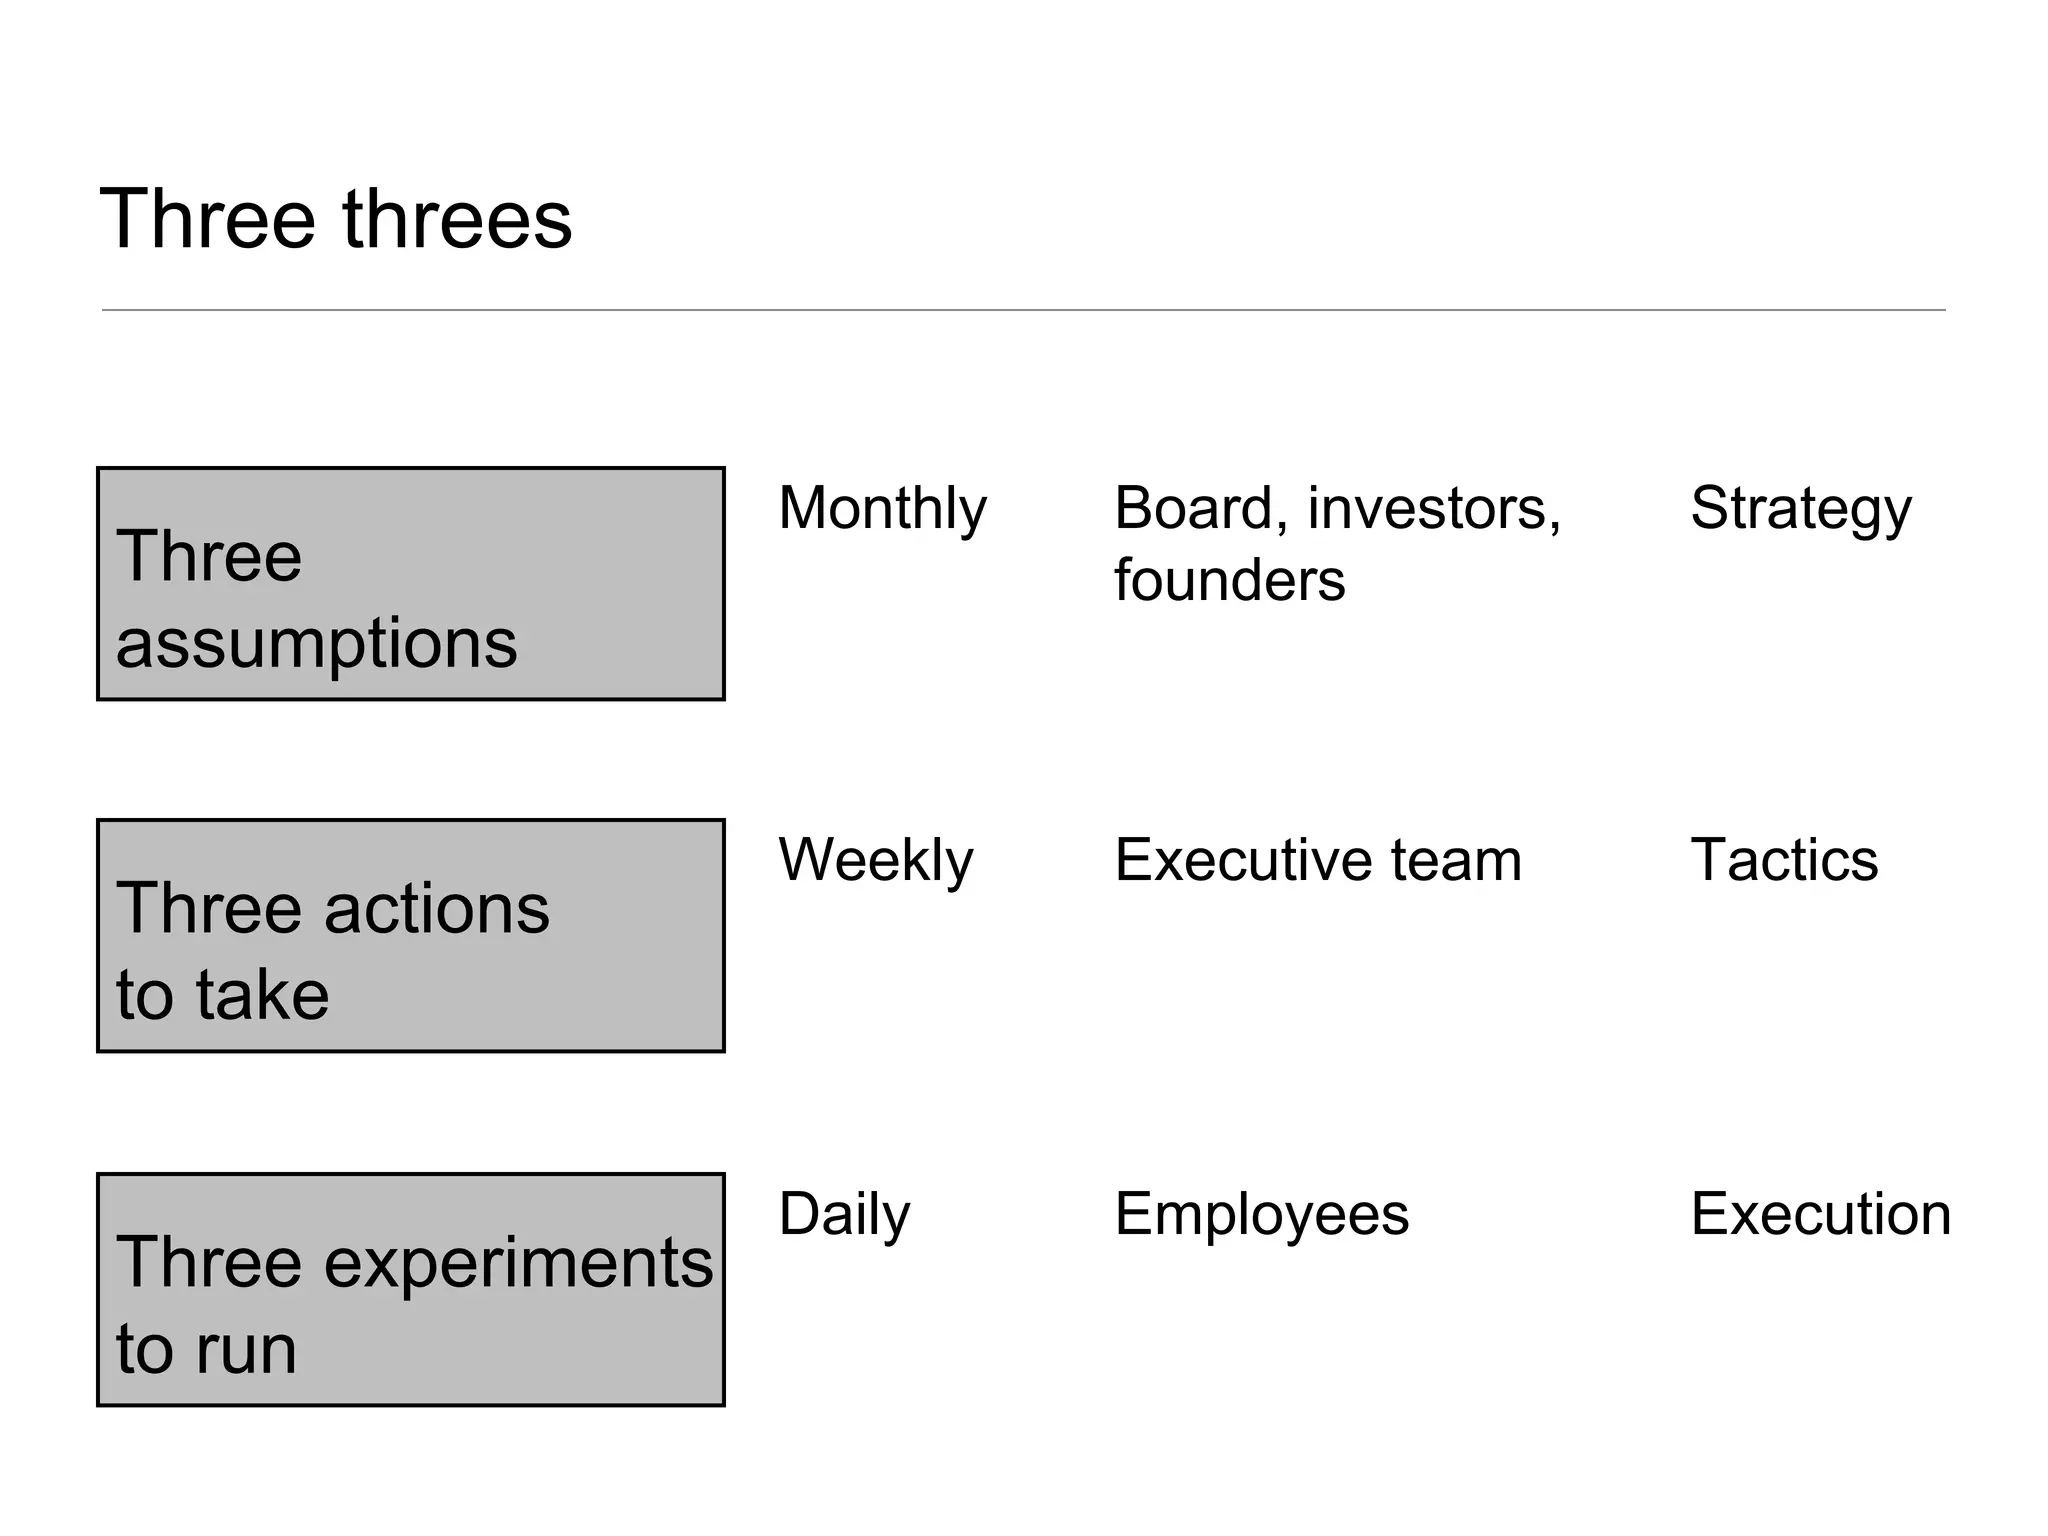
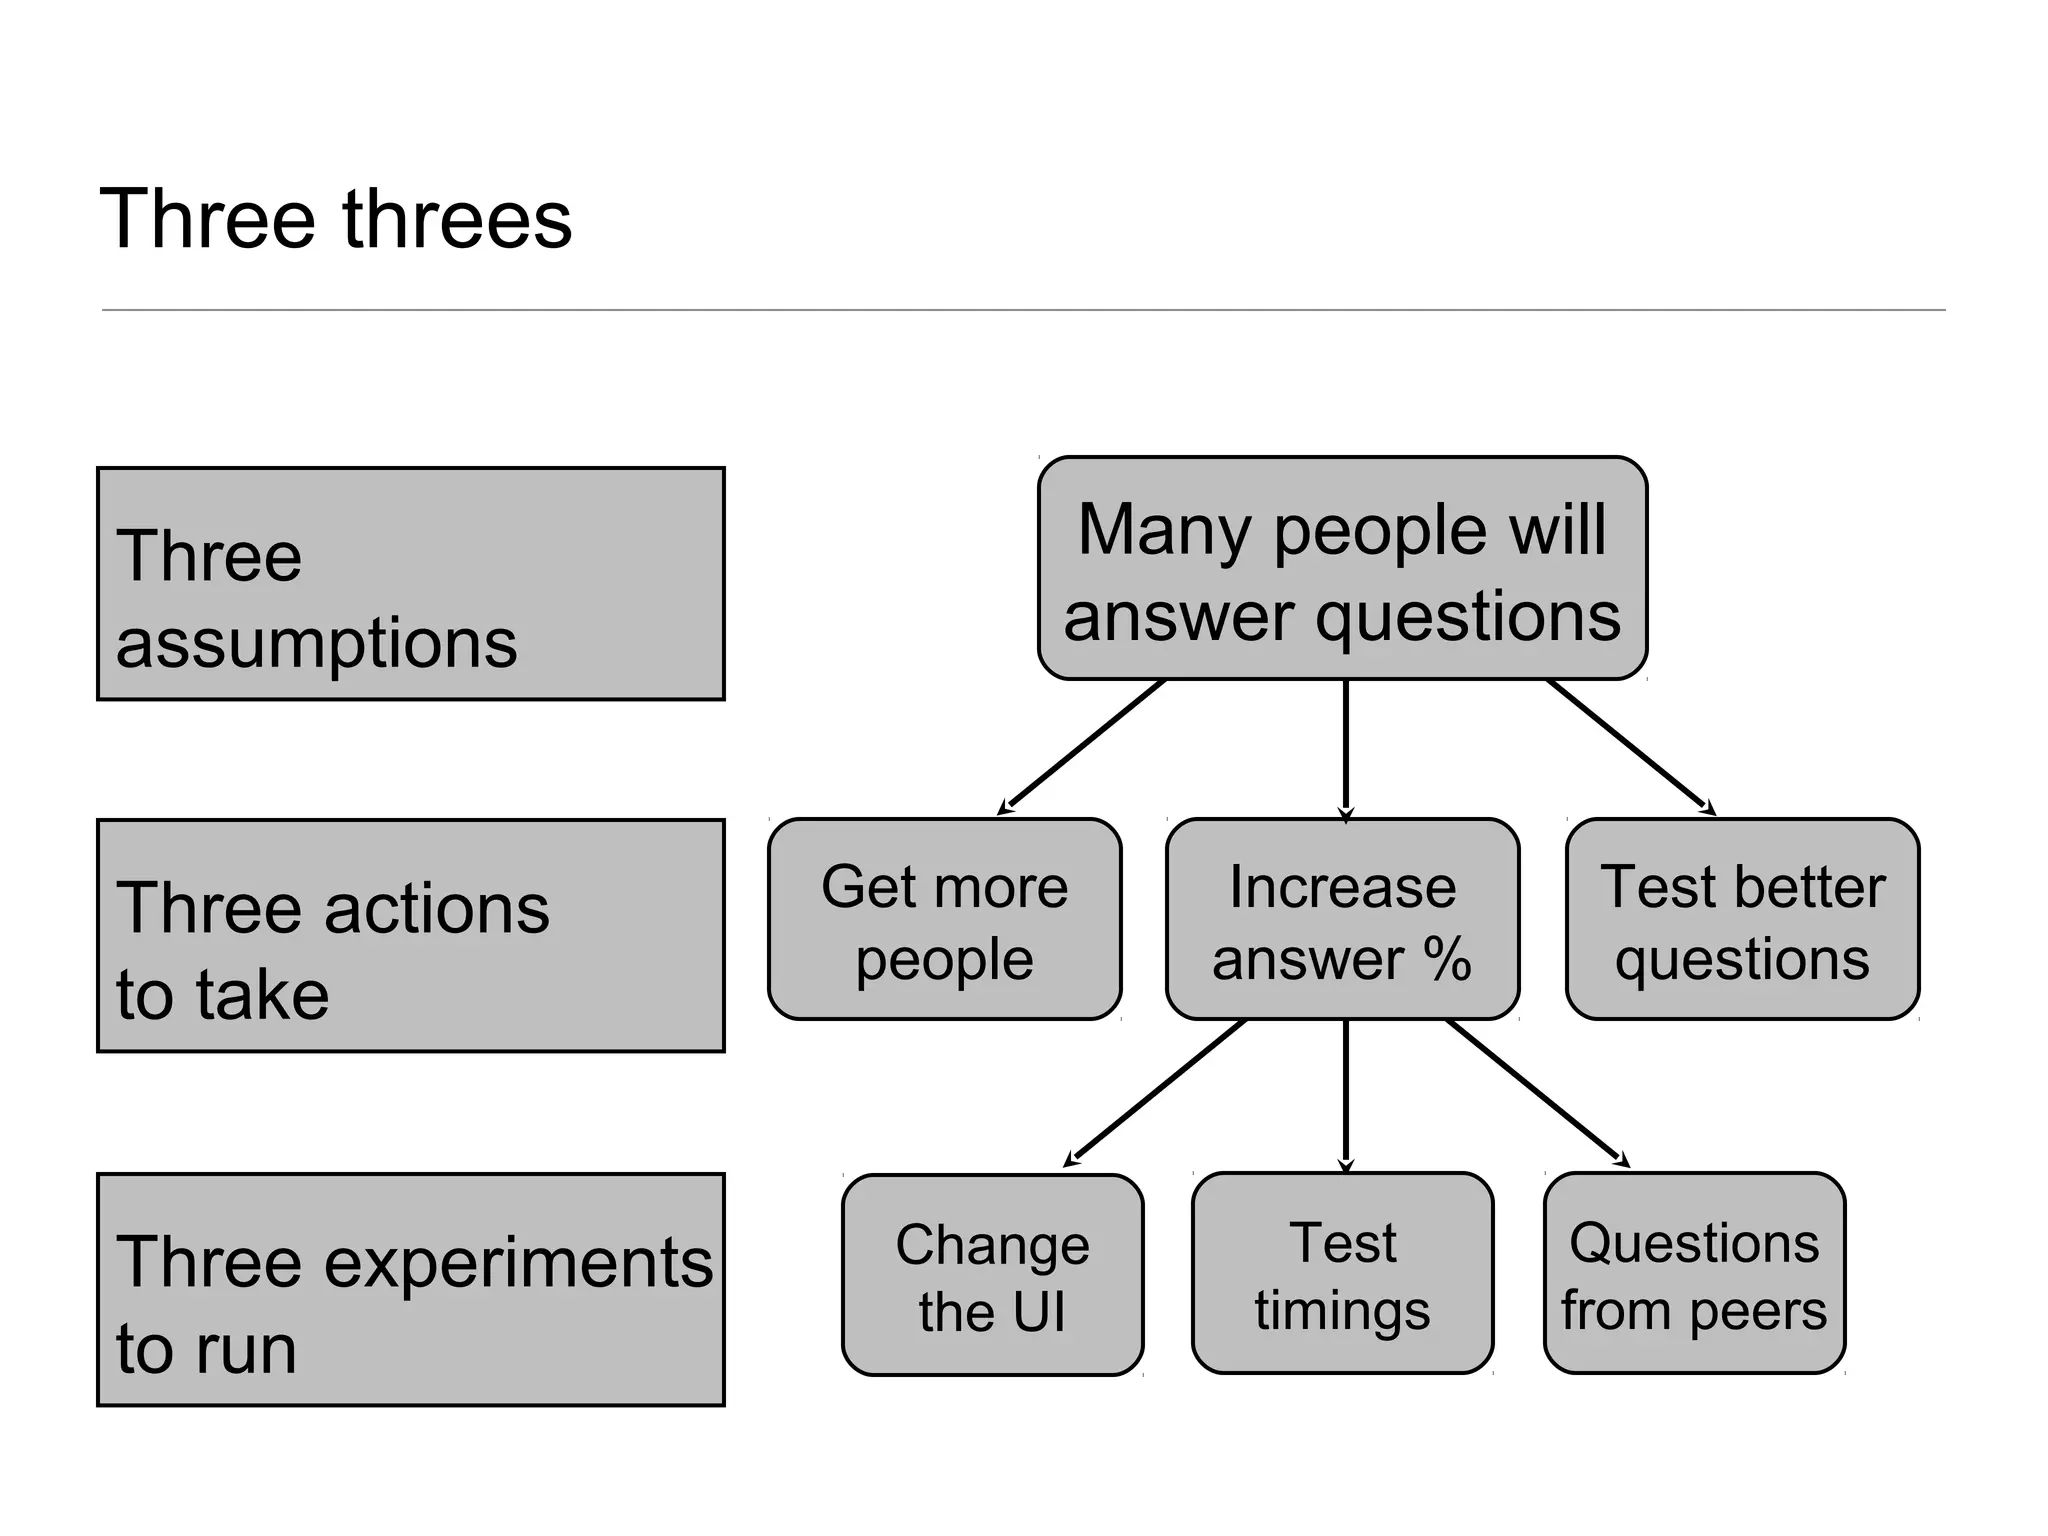
The document discusses Lean Analytics and how data can be used to build a better business faster. It provides an overview of Lean principles and the stages of Lean Analytics - Empathy, Stickiness, Virality, Revenue, and Scale. It also discusses lessons like mining existing data, testing a new product daily, identifying local maxima, differences between startups and large companies, and building analytics into operations. The document advocates for an iterative process of generating hypotheses, designing tests, measuring results, and making production changes to continually learn and improve.
Introduction to Lean Analytics for Lean Startup Circle SFLean Analytics
An introduction to Lean Analytics for the Lean Startup Circle SF event. Covers the basic topics of analytics, Lean Analytics framework, and a number of case studies from companies such as Circle of Friends, Localmind, Static Pixels and more.
Presentation on Lean Analytics at MicroConf 2013. Understanding what metrics are the most value, when, for your type of business.
* What makes a good metric?
* Types of metrics (qualitative vs. quantitative, vanity vs. actionable, etc.)
* Lean Analytics framework
Shared a number of case studies: Airbnb, Buffer, ClearFit, OffceDrop and others.
Lean Analytics for Startups and EnterprisesLean Analytics
Latest Lean Analytics workshop from the Lean Startup Week in San Francisco. Focusing on what metrics matter to both startups and big corporations. Incorporates elements of corporate innovation into the Lean Analytics framework to help bigger companies think through the data that really matters.
Understanding Lean Analytics (and how analytics helps businesses win)Lean Analytics
This is the workshop on Lean Analytics from the Web Analytics Congress (#wac13) in Amsterdam. It covers the basics of Lean Analytics + Lean Startup. It goes into details on specific business models such as media and e-commerce and includes many case studies from the Lean Analytics book.
Lean Analytics: Using Data to Build a Better Business FasterLean Startup Co.
Alistair Croll, Solve for Interesting , @acroll
At the core of Lean Startup approaches is a continuous cycle of measurement and learning. But what should you measure? To find the right metric, you need to understand the stage you’re at and the business model you’re in, as well as where to draw the line so you know when to cut your losses—and when to step on the gas. In these two sessions, entrepreneur and best-selling author of Lean Analytics Alistair Croll will show you how to put data to work.
How to think about data and what makes a good metric
The importance of cohorts and proper analysis
The five stages every startup goes through
Six business model archetypes and how to find your own
What “good enough” looks like and how to run experiments
What works for larger organizations trying to change and innovate.
This session is relevant for both early-stage founders and intrapreneurs in large organizations. Based on interviews with over 130 analysts, entrepreneurs, and investors, this session is packed with practical information, hard numbers, and concrete steps you can put to work immediately. Attendees need not be technical but should come armed with a basic understanding of web analytics, business metrics, and their current business model, plus a willingness to share with one another.
This workshop is sponsored by Amplitude.
A comprehensive (but not complete!) review of the Lean Analytics book (http://leananalyticsbook.com), which was presented at the Lean Startup Conference in 2012. Focuses on the
I gave this presentation about the Lean Analytics book at the Lean Startup Meetup in Karlsruhe.
Follow my blog for updates: http://jan-koenig.com/blog/
Or Twitter: https://twitter.com/einkoenig
Optimize Your Funnel By Getting Inside Your Buyer's HeadDavid Skok
Part of finding product/market fit is turning early wins into repeatable, scalable, and profitable sales. In this talk given as part of the Heavybit speaker series, I discuss how to shorten the time to customer conversion from trials, freemium and open source products.
Jerry Chen, partner at Greylock and former VP of Cloud and Application Services at VMware, shares his Unit of Value framework for startups building a go-to-market strategy. He developed this strategy while managing product and marketing teams at VMware that shipped many “1.0” releases, including VMware VDI, Cloud Foundry, and vFabric, and continues to use the framework to evaluate companies as an investor.
Startup Metrics: The Data That Will Make or Break Your Business by Alistair C...Lean Startup Co.
If you’re being methodical about growth, analytics matters. For startups, analytics is about measuring the right metric, in the right way, to produce the change the business needs most at that point in time. That’s harder than it sounds: you need a solid understanding of your business model; an awareness of what’s most at risk; and a clear idea of where to draw the line between success and failure. Metrics measure not only the health of your business, but also your journey to product/market fit; the value of your company; and the reliability of your underlying infrastructure. Join Lean Analytics co-author Alistair Croll for an all-day, in-depth look at analytics, measurement, and working with data. We’ll cover:
The five stages of growth every company goes through, and how they guide your choice of metrics
Six business-model archetypes and their unique measurement challenges
What “good enough” looks like for fundamental metrics
How to think about cohorts, segments, percentiles, and histograms
Measuring and aggregating infrastructure KPIs such as latency and availability
Using the Lean Analytics cycle to improve through experimentation
This workshop is relevant for people working in standalone startups and for corporate entrepreneurs. It will combine presentations, case studies, and interactive discussion of the audience’s specific measurement challenges. Attendees need not be technical but should come armed with a basic understanding of web analytics, business metrics, and their current business model, plus a willingness to share with one another.
The SaaS Founder’s Journey: What Matters at Each StageDavid Skok
From a talk given at SaaStock 2017 in Dublin, this slide deck covers the three stages of a startup, the most important question founders should be asking to ensure survival/success, and how to build and scale a sales funnel.
12 Steps to Effective Growth Hacking (www.wepullthetrigger.com)Trigger
Do you consider growth hacking to be a fluffy concept and practice? Are you unsure how to crack the code on how to get started? Good news ahead. We have broken down the process in 12 effective steps that will help you kick off your growth (hacking) efforts. Let's get started!
Mark Grove presented on Cumulative Flow Diagrams at the DC Scrum User Group. Video and slides available at https://www.kaizenko.com/washington-dc-scrum-user-group-dcsug/
Abstract:
The Cumulative Flow Diagram (CFD). Perhaps you’ve heard of it. Maybe you’ve been told it can help you better understand the flow of work, identify bottlenecks, and get a sense how long work items will take to complete. It sounds intriguing, but…how exactly do you read it? What is it trying to tell you? How can you use it to improve your team’s flow? Perhaps you’re a Scrum team using a traditional burndown chart. Could the CFD be more helpful?
In this part lecture, part workshop presentation, we’ll take a closer look at what a CFD is, how it’s constructed, and, most importantly, how to interpret what you’re observing. Being able to identify patterns in your CFD is a valuable skill to better understand how work is flowing across your Scrum or Kanban board. We’ll then examine several CFD patterns you might see with your teams while addressing three key questions: What are you observing? Why might it be happening? and What actions might you suggest for improvement?
Would you like to be able to increase the adoption rate of your product? In this session, we will introduce you to cutting edge concepts and techniques to shift your product development process from output to outcome driven. We will combine elements of Lean Startup, Product Discovery, and Experiment Driven Development to accelerate learning to quickly build products customer love.
Digital Intent partner Sean Johnson discusses tactics and strategies for optimizing each stage of the customer development funnel.
View the Udemy course for over 2 hours of additional material: https://www.udemy.com/the-ultimate-guide-to-funnel-optimization/
To learn more about Digital Intent, visit http://www.digintent.com.
To learn more about Sean, visit http://www.sean-johnson.com
Top 3 ways to use your UX team - producttank DFW MeetupJeremy Johnson
As a product owner or manager how should you be using your User Experience team? In this quick talk I go over the top three ways to use your UX team to support you in building better products.
A regular talk I give across the globe for both corporate innovation and startup ideation. I took a great group of Hubbers through the process of finding product market fit with their ideas, startups and products
Dan Olsen, The Lean Product Playbook , @danolsen
Room: C260
Everyone working on a new product is trying to achieve the same goal: product-market fit. Although product-market fit is one of the most important Lean Startup concepts, it’s also the least well defined. Dan Olsen shares the top advice from his book The Lean Product Playbook, including the Product-Market Fit Pyramid: an actionable model that breaks product-market fit down into 5 key elements. Dan also explains the Lean Product Process, a 6-step methodology with practical guidance on how to achieve product-market fit, illustrated with a real-world case study.
Product Development with Spotify's Product ManagerProduct School
Companies treat the role of product management differently. Miles Davis, Product Manager at Spotify, shared how they articulate the product development process at Spotify and the role and expectations of a PM.
Quantifying the Invisible Audience in Social NetworksMichael Bernstein
Presented at CHI 2013
When you share content in an online social network, who is listening? Users have scarce information about who actually sees their content, making their audience seem invisible and difficult to estimate. However, understanding this invisible audience can impact both science and design, since perceived audiences influence content production and self-presentation online. In this paper, we combine survey and large-scale log data to examine how well users’ perceptions of their audience match their actual audience on Facebook. We find that social media users consistently underestimate their audience size for their posts, guessing that their audience is just 27% of its true size. Qualitative coding of survey responses reveals folk theories that attempt to reverse-engineer audience size using feedback and friend count, though none of these approaches are particularly accurate. We analyze audience
logs for 222,000 Facebook users’ posts over the course of one month and find that publicly visible signals — friend count, likes, and comments — vary widely and do not strongly indicate the audience of a single post. Despite the variation, users typically reach 61% of their friends each month. Together, our results begin to reveal the invisible undercurrents of audience attention and behavior in online social networks.
Lean Analytics for Intrapreneurs (Lean Startup Conf 2013)Lean Analytics
Lean Analytics for Intrapreneurs workshop by Alistair Croll, based on Lean Analytics book and research done with dozens of large organizations on how they're using data, analytics and Lean principles to innovate and improve.
Lean analytics from Web A Quebec mars 2014Lean Analytics
Présentation fait au Web à Québec. Comment utiliser les données met metriques pour croitre votre startup plus rapidement, avec des leçons pour entreprises de toutes grandeurs. Version franglais; le plupart des slides sont traduis. Veuillez excuser les erreurs; le français n'est pas ma langue maternelle.
Closing keynote for the Web A Quebec conference in Quebec City. Looks at how to use data to build a better business faster, for organizations of all sizes.
How to start a new game business using our startup Everyplay (www.everyplay.com) as an example case.
Delivered at the Casual Connect Europe conference, in Hamburg, Germany on 12th February 2009.
How to use data to build a better business faster. Based on the book Lean Analytics, this presentation looks at startup metrics and offers a framework for deliberate growth and iterative improvement of a new business. It also includes examples from larger organizations trying to change from within.
SLIM is Spark's approach to lean intrapreneurship. Intrapreneurship can be a huge undertaking - it affects an entire organization and, if done wrong, can be devastating. Check the presentation and feel free to contact us if you have any questions.
The Future is Operations: Why Mobile Games Need BackendsJames Gwertzman
The future of mobile gaming is in operations. It’s not enough to just have great gameplay — that’s table stakes now. Winning games need to be able to engage their players long after launch and keep them coming back for more. To do that you need a great live operations strategy and the backend tools to execute it. And while it used to be that if you wanted a backend for your game, you had to build it yourself, companies like PlayFab and others are now making it easy for everyone.
Mobile Game Go-to-Market case study presented by ex-CEO of Com2us USA, a leading mobile game company having offices in Silicon Valley, Korea, China and Japan.
How To Fail: 25 Secrets Learned through FailureTaylor Davidson
25 Secrets Learned through Failure, by Taylor Davidson at Unstructured Ventures.
Visit the post on unstructuredventures.com/uv (short link to post: http://tinyurl.com/howtofail ) to add to the discussion, share your lessons learned from failure, and view more.
Final cycles overview jan 2019 with toolkitBryan Cassady
Scaling up is hard and deadly if done wrong. We would like to help you get it right.
This presentation introduces the ABCs method of innovation and provides toolkits you could use to grow fast while reducing riks
Details
A study by Startup Genome analyzed the results of 3,200 start-ups, they found that of the majority of start-ups failed. That shouldn’t come as a surprise to anyone. What is more important is they found, 70% failed because of premature or faulty scaling.
In this workshop, you learn about the ABCs method. The ABCs method is a system-based approach to growing your business. It has been proven to build ideas up to 6x faster while reducing risks 30-80%.
New contemporary concepts on the value of leaders who generates organizational leadership as more of collaborative work place ambiance than just heroics.
Fundraising Strategy - useful tools that really work IoF 2011Simon Burne
This is intended to provide you with a range of tools to apply directly to developing effective strategies that deliver real results. All the tools have been tried and tested and have been proven to work. Not all of them will be right for you but you're guaranteed to come away with some tools that you'll want to use straight away.
Instead of asking "Are you ready to fundraise", perhaps the better question is.. "Are you ready to grow?"
Learn about the basics of fundraising and whether you are ready.
Use the free tools and frameworks
Lean Canvas Plus (aka Fat Canvas) https://bit.ly/jdlfatcanvas
Fingerprint4Success Human Analytics: https://bit.ly/censusf4s
Achieving Business Excellence (a ChangeThis Manifesto by John Spence)Samuli Pahkala
"There is no single strategy that will carry your company forever—just ask my buddy Tom Peters, who wrote the fantastic book In Search of Excellence back in 1982, only to watch more than half of the companies he highlighted go out of business! Markets shift, consumer preferences change, new competitors appear, technology advances—and so must you. Even though I can recommend which of today’s popular strategies I believe deserve your attention, there is no guarantee that these same strategies will still be as relevant in 20 years. I think they will, but no one can see that far ahead.
With all of that said, [these] are the six strategies on which all the great companies I studied were relentlessly focused."
Master the essentials of conversion optimizationArnas Rackauskas
Conversion optimization is a process. Amateurs follow best practices and don’t know where to begin. Experts follow frameworks and processes.
This expert guide will teach you the process of optimization.
Using Powerful Questions to Drive Your Information StrategyRob Saker
We've moved from a world of data scarcity to nearly unlimited accessibility and availability of information. Systems and technology have rapidly advanced as well, but firms are still seeing mixed results. This presentation discusses why we need to focus on better questioning and actionability as the core of an information strategy.
The "Genesis: Idea Stage" ebook explains the phase where the journey starts for every startup: the idea stage. This eBook is the first part of the "Startup Master Class" series covering the idea, problem/solution fit, product/market fit and scaling stages.
http://productprosystems.com - The Product Creation Manifesto is a guide to information marketing and creating information products. Written by Greg Rollett, the ProductPro, this guide will show you the "why" behind recording your own info products as well as practical tips that walk you through the creation of your very own information marketing products.
Making Sense of the Numbers (Lean Analytics)Lean Analytics
This is the keynote presentation on Lean Analytics for the Web Analytics Congress (#wac13) from Amsterdam. It covers the basics of Lean Analytics, along with ways to effectively communicate the value of analytics to business managers and owners.
Business Valuation Principles for EntrepreneursBen Wann
This insightful presentation is designed to equip entrepreneurs with the essential knowledge and tools needed to accurately value their businesses. Understanding business valuation is crucial for making informed decisions, whether you're seeking investment, planning to sell, or simply want to gauge your company's worth.
[Note: This is a partial preview. To download this presentation, visit:
https://www.oeconsulting.com.sg/training-presentations]
Sustainability has become an increasingly critical topic as the world recognizes the need to protect our planet and its resources for future generations. Sustainability means meeting our current needs without compromising the ability of future generations to meet theirs. It involves long-term planning and consideration of the consequences of our actions. The goal is to create strategies that ensure the long-term viability of People, Planet, and Profit.
Leading companies such as Nike, Toyota, and Siemens are prioritizing sustainable innovation in their business models, setting an example for others to follow. In this Sustainability training presentation, you will learn key concepts, principles, and practices of sustainability applicable across industries. This training aims to create awareness and educate employees, senior executives, consultants, and other key stakeholders, including investors, policymakers, and supply chain partners, on the importance and implementation of sustainability.
LEARNING OBJECTIVES
1. Develop a comprehensive understanding of the fundamental principles and concepts that form the foundation of sustainability within corporate environments.
2. Explore the sustainability implementation model, focusing on effective measures and reporting strategies to track and communicate sustainability efforts.
3. Identify and define best practices and critical success factors essential for achieving sustainability goals within organizations.
CONTENTS
1. Introduction and Key Concepts of Sustainability
2. Principles and Practices of Sustainability
3. Measures and Reporting in Sustainability
4. Sustainability Implementation & Best Practices
To download the complete presentation, visit: https://www.oeconsulting.com.sg/training-presentations
What is the TDS Return Filing Due Date for FY 2024-25.pdfseoforlegalpillers
It is crucial for the taxpayers to understand about the TDS Return Filing Due Date, so that they can fulfill your TDS obligations efficiently. Taxpayers can avoid penalties by sticking to the deadlines and by accurate filing of TDS. Timely filing of TDS will make sure about the availability of tax credits. You can also seek the professional guidance of experts like Legal Pillers for timely filing of the TDS Return.
Unveiling the Secrets How Does Generative AI Work.pdfSam H
At its core, generative artificial intelligence relies on the concept of generative models, which serve as engines that churn out entirely new data resembling their training data. It is like a sculptor who has studied so many forms found in nature and then uses this knowledge to create sculptures from his imagination that have never been seen before anywhere else. If taken to cyberspace, gans work almost the same way.
VAT Registration Outlined In UAE: Benefits and Requirementsuae taxgpt
Vat Registration is a legal obligation for businesses meeting the threshold requirement, helping companies avoid fines and ramifications. Contact now!
https://viralsocialtrends.com/vat-registration-outlined-in-uae/
Digital Transformation and IT Strategy Toolkit and TemplatesAurelien Domont, MBA
This Digital Transformation and IT Strategy Toolkit was created by ex-McKinsey, Deloitte and BCG Management Consultants, after more than 5,000 hours of work. It is considered the world's best & most comprehensive Digital Transformation and IT Strategy Toolkit. It includes all the Frameworks, Best Practices & Templates required to successfully undertake the Digital Transformation of your organization and define a robust IT Strategy.
Editable Toolkit to help you reuse our content: 700 Powerpoint slides | 35 Excel sheets | 84 minutes of Video training
This PowerPoint presentation is only a small preview of our Toolkits. For more details, visit www.domontconsulting.com
Affordable Stationery Printing Services in Jaipur | Navpack n PrintNavpack & Print
Looking for professional printing services in Jaipur? Navpack n Print offers high-quality and affordable stationery printing for all your business needs. Stand out with custom stationery designs and fast turnaround times. Contact us today for a quote!
LA HUG - Video Testimonials with Chynna Morgan - June 2024Lital Barkan
Have you ever heard that user-generated content or video testimonials can take your brand to the next level? We will explore how you can effectively use video testimonials to leverage and boost your sales, content strategy, and increase your CRM data.🤯
We will dig deeper into:
1. How to capture video testimonials that convert from your audience 🎥
2. How to leverage your testimonials to boost your sales 💲
3. How you can capture more CRM data to understand your audience better through video testimonials. 📊
Skye Residences | Extended Stay Residences Near Toronto Airportmarketingjdass
Experience unparalleled EXTENDED STAY and comfort at Skye Residences located just minutes from Toronto Airport. Discover sophisticated accommodations tailored for discerning travelers.
Website Link :
https://skyeresidences.com/
https://skyeresidences.com/about-us/
https://skyeresidences.com/gallery/
https://skyeresidences.com/rooms/
https://skyeresidences.com/near-by-attractions/
https://skyeresidences.com/commute/
https://skyeresidences.com/contact/
https://skyeresidences.com/queen-suite-with-sofa-bed/
https://skyeresidences.com/queen-suite-with-sofa-bed-and-balcony/
https://skyeresidences.com/queen-suite-with-sofa-bed-accessible/
https://skyeresidences.com/2-bedroom-deluxe-queen-suite-with-sofa-bed/
https://skyeresidences.com/2-bedroom-deluxe-king-queen-suite-with-sofa-bed/
https://skyeresidences.com/2-bedroom-deluxe-queen-suite-with-sofa-bed-accessible/
#Skye Residences Etobicoke, #Skye Residences Near Toronto Airport, #Skye Residences Toronto, #Skye Hotel Toronto, #Skye Hotel Near Toronto Airport, #Hotel Near Toronto Airport, #Near Toronto Airport Accommodation, #Suites Near Toronto Airport, #Etobicoke Suites Near Airport, #Hotel Near Toronto Pearson International Airport, #Toronto Airport Suite Rentals, #Pearson Airport Hotel Suites
Attending a job Interview for B1 and B2 Englsih learnersErika906060
It is a sample of an interview for a business english class for pre-intermediate and intermediate english students with emphasis on the speking ability.
Personal Brand Statement:
As an Army veteran dedicated to lifelong learning, I bring a disciplined, strategic mindset to my pursuits. I am constantly expanding my knowledge to innovate and lead effectively. My journey is driven by a commitment to excellence, and to make a meaningful impact in the world.
Tata Group Dials Taiwan for Its Chipmaking Ambition in Gujarat’s DholeraAvirahi City Dholera
The Tata Group, a titan of Indian industry, is making waves with its advanced talks with Taiwanese chipmakers Powerchip Semiconductor Manufacturing Corporation (PSMC) and UMC Group. The goal? Establishing a cutting-edge semiconductor fabrication unit (fab) in Dholera, Gujarat. This isn’t just any project; it’s a potential game changer for India’s chipmaking aspirations and a boon for investors seeking promising residential projects in dholera sir.
Visit : https://www.avirahi.com/blog/tata-group-dials-taiwan-for-its-chipmaking-ambition-in-gujarats-dholera/
4. Kevin Costner is a lousy entrepreneur.
Don’t sell what you can make.
Make what you can sell.
5. In a startup, the purpose
of analytics is to iterate to
a product/market fit before
the money runs out.
6. Everyone’s idea is
the best right?
People love
this part!
(but that’s not always
a good thing)
This is where things
fall apart.
No data, no
learning.
7. The five Stages of Lean Analytics
Empathy
Stickiness
Virality
Revenue
Scale
Thestageyou’reat
E-commerce SaaS Media
Mobile
app
User-gen
content
2-sided
market
The business you’re in
One Metric
That Matters.
8. If it won’t change
how you behave,
it’s a
bad
metric.
http://www.flickr.com/photos/circasassy/7858155676/
9. Five lessons beyond the basics
• Mining your existing data
• A new product every day
• Are you at your local maximum?
• It’s different when you’re big
• Build analytics into how you operate
11. Identify a key business problem,
pick the OMTM, draw a line in the
sand, and get started.
12. Draw a new line
Pivot or
give up
Try again
Success!
Did we move the
needle?
Measure
the results
Make changes
in production
Design a test
Hypothesis
With data:
find a
commonality
Without data:
make a good
guess
Find a potential
improvement
Draw a linePick a KPI
The Lean Analytics Cycle
13. Do hosts withDo hosts with
professionalprofessional
photography getphotography get
more business?more business?
Do hosts withDo hosts with
professionalprofessional
photography getphotography get
more business?more business?
Airbnb experiments...
14. Professional photography helps Airbnb’s business
Gut instinct
Concierge MVP
20 photographers in the field
Test results
Two to three times more bookings!
Back to the beginning
Use additional data to keep experimenting
18. Draw a new line
Pivot or
give up
Try again
Success!
Did we move the
needle?
Measure
the results
Make changes
in production
Design a test
Hypothesis
With data:
find a
commonality
Without data:
make a good
guess
Find a potential
improvement
Draw a linePick a KPI
Remember this?
19. “Gee, those houses
that do well look
really nice.”
Maybe it’s the
camera.
“Computer: What do
all the highly rented
houses have in
common?”
Camera model.
With data:
find a
commonality
Without data:
make a good
guess
20. The only thing worse than bad
feedback is no feedback at all.
- Dave McClure, Startupfest 2012
22. Virality stage:
Circle of Moms finds an
engaged market
• Stage: Stickiness
• Model: UGC
• Launched as Circle of Friends in 2007, it was a way for small groups to
interact atop Facebook’s platform; but when engagement wasn’t good
enough, the founders decided to dig deeper.
23. The problem: Not enough engagement
• Too few people were actually using the product
• Less than 20% of any circles had any activity after their initial creation
• A few million monthly uniques from 10M registered users, but no sustained
traction
24. A new product every day
Why cohorts matter more than you think.
25. Segments, cohorts, A/B, and multivariates
Segment:
Cross-sectional
comparison of all
people divided by
some attribute
(age, gender, etc.)
☀
☁
Cohort:
Comparison of
similar groups
along a timeline.
A/B test:
Changing one
thing (i.e. color)
and measuring
the result (i.e.
revenue.)
Multivariate
analysis:
Changing several
things at once to see
which correlates with
a result.
☀
☁
☀
☁
JanJan
FebFeb
MarMar
AprApr
MayMay
26. Why use cohorts? Here’s an example.
January February March April May
Rev/customer $5.00 $4.50 $4.33 $4.25 $4.50
Is this
company
growing or
stagnating?
Cohort 1 2 3 4 5
How about
this one?
January $5 $3 $2 $1 $0.5
February $6 $4 $2 $1
March $7 $6 $5
April $8 $7
May $9
27. Two views of the same company
Cohort 1 2 3 4 5
January $5 $3 $2 $1 $0.5
February $6 $4 $2 $1
March $7 $6 $5
April $8 $7
May $9
Averages $7 $5 $3 $1 $0.5
Look at the
same data
in cohorts
28. Are we at a local maximum?
You need optimization and inspiration.
29. The problem with local maxima
(http://www.slideshare.net/bokardo/metricsdriven-design-4317168)
30.
31. The vertebrate eye is “backwards
and upside down”. Light travels
through cornea, lens, aqueous
fluid, blood vessels, ganglion
cells, amacrine cells, horizontal
cells, and bipolar cells.
The cephalopod eye is
constructed the “right way
out”, with the nerves attached
to the rear of the retina. No
blind spot.
Extension of the brain Invagination of the head
44. Since large organizations
make data that
perpetuates things, you
have to willfully ignore
common wisdom at the
outset.
http://www.flickr.com/photos/jb912/8940173789
45. Disruption may not fit neatly into
an existing part of the
organization, so you need to
incubate it internally for a while.
46. Unlike a VC or startup,
when the initiative fails the
organization still learns.
48. The Lean Analytics lifecycle for an Intrapreneur
Empathy
Find problems; don’t test demand.
Skip the business case, do
analytics
Entitled, aggrieved
customers
Stickiness
Know your real minimum based on
expectations, regulations
Hidden “must haves”,
feature creep
Virality
Build inherent virality in from the
start; attention is the new currency
Luddites who don’t
understand sharing
Revenue
Consider the ecosystem, channels,
and established agreements
Channel conflict,
resistance, contracts
Scale
Hand the baton to others gracefully Hating what happens
to your baby
Stage Do this Fear this
Beforehand
Get buy-in Political fallout
49. A large organization needs a
portfolio of investments,
judged by different criteria.
Treasury
bonds
Venture
capital
50. A large organization needs a
portfolio of investments,
judged by different criteria.
Safe
Predictable
Evolutionary
Achieve the
business plan
Risky
Uncertain
Revolutionary
Discover the
business model
Times of
peace
Times of
war
51. Acquisition or disruption?
Innovate fast:
nothing to lose
Innovate slowly: conform to brand,
legislation, approvals
Found
P/M fit
Found
P/M fit
Integration complexity,
founder churn, indigestion
Biz
case
Scale
Scale
Biz
model
VC
pitch
52. Moving from box to box
• How businesses think
about products or
companies
• Lean is about moving
up and to the right
53. Frame the project as a
learning exercise; product
creation is almost accidental.
Learn it’s
a failure
Learn it’s
a success
Industry
knowledge
Industry
knowledge
Possible
product
Business plan
metrics here
Market
Business
model
metrics here
Lean
product
Lines in the
sand here
54. Build analytics into how you
operate the business
Three threes and the Problem-Solution Canvas
55.
56.
57. Three threes
Three
assumptions
What big bets are you making?
•“People will answer questions”
•“Organizers are frustrated with how to run conferences”
•“We’ll make money from parents”
•“Amazon is reliable enough for our users.”
Three actions
to take
What are you doing to make these assumptions happen
(or identify they’re wrong and change course?)
•Product enhancements
•Marketing strategies
Three experiments
to run
What are you going to learn today?
•Feature tests
•Continuous deployment
•A/B testing
•Customer survey
59. Three threes
Get more
people
Increase
answer %
Test better
questions
Change
the UI
Test
timings
Questions
from peers
Many people will
answer questions
Three
assumptions
Three actions
to take
Three experiments
to run
We ’ ve built on Eric ’ s model, because we believe that companies naturally go through five stages of growth. First, the need to get inside their customers ’ heads Then they need to make sure a small group of users keeps using the product Then they need to make sure that word can spread Then they need to feed some of their revenues back into customer acquisition, accelerated by the virality they ’ ve built. Then they need to scale.
THis is a simple test for whether a metric is real or bullshit.
Mike Greenfield and his co-founders started Circle of Friends in September 2007, shortly after Facebook launched their developer platform. The timing was perfect: Facebook became an open, viral place to acquire users as quickly as possible and build a startup. There had never been a platform with so many users (Facebook had about 50 million users at the time) that was so open to reaching them.Circle of Friends was a simple idea: a Facebook application that allowed you to organize your friends into circles for targeted content sharing. Mike notes now that it was basically, “ Google+ for Facebook ” (before Google+ existed.)
By mid-2008, Circle of Friends had 10 million users. Greenfield focused on growth above everything else. “ It was a land grab, ” he said. And Circle of Friends was clearly viral. But there was a problem. Too few people were actually using the product.According to Mike, less than 20% of circles had any activity whatsoever after their initial creation. “ We had a few million monthly uniques from those 10 million users, but as a general social network we knew that wasn ’ t good enough and monetization would likely be poor. ” So Mike went digging.
SegmentationA segment is simply a group that shares some common characteristic. It might be users that run Firefox; or restaurant patrons who make a reservation rather than walking in; or passengers who buy a first-class ticket; or parents who drive a minivan.On websites, we can often segment visitors according to a range of technical and demographic information. Then, by comparing one segment to another, we can learn things. If, for example, visitors using the Firefox browser have significantly fewer purchases, we may want to perform additional testing to find out why. If we see that a disproportionate number of buyers are coming from Australia, we might survey them to discover why, then try to replicate that success in other markets.Segmentation works for any industry and any form of marketing, not just for websites. As we ’ ll see, segmenting mailing lists is an essential part of improving e-mail performance; but direct mail marketers have been segmenting for decades with great success. Even if you ’ re selling to enterprise customers, dividing your messages by target audience, industry, or stage in the sales cycle—and then testing the results of those messages—is crucial.Cohort analysisA second kind of test is cohort analysis. As you build and test your product, you ’ ll be iterating regularly. Users that join you in the first week will have a different experience from those that join later on. For example, all of your users might go through an initial free trial, usage, payment, and abandonment cycle. As this happens, you ’ ll make changes to your business model. As a result, the users who experienced the trial in month one may have a significantly different onboarding experience from those who experienced it in month five. How did that affect their churn? To find this out, we use cohort analysis.Each group of users is a cohort—participants in an experiment across their lifecycle. You can compare cohorts against one another to see if, on the whole, key metrics are getting better over time.
Using cohorts is really, really important.
This is a fundamental problem with evolutionary optimization. To illustrate, let me tell you why you ’ ll always have a blind spot. There ’ s a place in your eye where you can ’ t see things. The other eye compensates, and your brain fills in the rest, but you really can ’ t see part of what you look at.
The eye has evolved in nature in many, many different forms, often independently. Our eyes and those of cephalopods like the octopus look similar, but have very different histories. The human eye is “ backwards ” —the infrastructure is actually in front of the retina. That means the optic nerve runs in front of the part that catches the light. This is because the human eye evolved as a growth of the brain. On the other hand, the octopus eye has the optic nerve behind the retina, because it evolved as a dent in the head. Which means octopuses don ’ t have a blind spot. But you ’ re not going to evolve a better eye, because the intermediate mutations would be worse.
Imagine I gave an algorithm three wheels and asked it to optimize their configuration. It would arrive at some form of tricycle. But it wouldn ’ t go, “ hey, can I get a fourth wheel? ” That would be what a human would do. That ’ s a leap of faith.
If you work in a company of any significant size, you owe your org chart to an enterprising General Superintendent of the railroad era named Daniel C. McCallum. In the 1850s, railroads were a booming business. Unfortunately for investors, they didn ’ t scale well. Small railroads turned a profit; big ones didn ’ t.McCallum noticed this, and divided his railroad into smaller sections, each run by subordinates who reported back a standard set of information he defined. McCallum ’ s line—as well as other lines that copied this approach—thrived. McCallum ’ s model, inspired by his time as a soldier and the regimented hierarchies he had learned there, was then applied to other fields.McCallum was the first management scientist, introducing controls, structure, and regulations in order to reduce risk and increase predictability at scale. Companies like Google and Apple know this, creating their own advanced research groups such as the Google X Lab.
As World War II exploded across Europe, the United States realized it needed a way to counteract German advances in aviation—specifically, jet aircraft. The US military asked Lockheed Martin (then the Lockheed Aircraft Corporation) to build a jet fighter. Desperate times called for desperate measures: in a month, they had a proposal; less than six months later, working in a closely guarded circus tent, the first plane was built.This group became known as the Skunk Works, a title that ’ s synonymous with an independent, autonomous group charged with innovation inside a bigger, slower-moving organization. These groups are often immune to the restrictions and budget oversight that guides the rest of the company, and have the specific goal of working “ out of the box ” to mitigate the inertia of large companies.
Beforehand: get buy-inBefore you start doing customer development, you need executive buy-in. This may be implicit—if it ’ s your job to try and find new opportunities. But once you think you ’ ve found an opportunity, you need explicit approval from an executive. You want to know where you are on the BCG box, and where you ’ re trying to go. And you need to know what metrics your progress will be judged by. You need to know what resources you have, and what rules apply to you. This is like a pre-nup: better signed before the wedding.At this stage, you ’ re defining your analytical strategy, and the “ lines in the sand ” against which you ’ ll be judged. These may be goals for the whole company, such as margins; or they may be a growth rate that ’ s considered success. You ’ ll also need to define how you will adjust these metrics based on what you learn.Empathy: find problems, don ’ t test demandOnce you start doing customer development, remember that you ’ re testing problems and solutions—not existing demand. If you ’ re truly disruptive, customers won ’ t tell you what they want. But they will tell you why they want it. In 2008, Swiffer creator Gianfranco Zaccai explained, “ Successful business innovation isn ’ t about giving consumers what they need now, but about giving them something they ’ ll desire in the future. ” Customers weren ’ t telling Netflix they wanted to stream videos, but their patterns of usage, computer adoption, broadband deployment, and browsing told the company a need existed.This is a place for qualitative interviews. You should talk to existing users and customers, of course. But if you ’ re trying to grow market share, you ’ ll also want to talk to your competitors ’ customers, to distributors, and to everyone involved in purchasing the product. If you ’ re trying to improve growth rate, you ’ ll talk to adjacent customers. That ’ s what Bombardier did when it expanded from its cash cow snowmobile business to its rapidly growing jet-ski business.Skip the business case, do the analyticsAt some point, when it comes time to go beyond interviewing people, you ’ ll need to build a business case. Traditional product managers build profit-and-loss analyses to try and justify their plans: they create a convincing business case, and once someone believes it, they get funding to proceed. But a Lean mindset reverses this: you sell the business model, without a lot of prediction, and then rely heavily on analytics to decide whether to kill the product or double-down on it.This analyze-after rather than predict-before model is possible because many of the costs of innovation can be pushed later in the product development cycle. Just-in-time manufacturing, on-demand printing, services that replace upfront investment with pay-by-the-drink capacity, CAD/CAM design, and mercenary contractors all mean that you don ’ t have to invest heavily up front (and therefore doesn ’ t have to argue a business case at the outset.) Rather, you can ask for a modest budget, build analytics into the product, and launch sooner for less money. You can then use the data and customer feedback you get, which is vanishingly cheap to collect given today ’ s technology, to plead your case based on actual evidence.Stickiness: know your real minimumIf you ’ ve identified a problem worth solving and a solution that customers will want, it ’ s time to make an MVP. But you need to know what your real minimum is. As a big organization, you may have restrictions on data sharing, reliability, or compliance to which smaller organizations (who have less to lose) aren ’ t subject. You also need to know what your unfair advantages are.Consider, for example, the many meal pre-ordering tools on the market today. These mobile applications let you place an order from a food court restaurant, pay, and pick up at an agreed-upon time without waiting. The restaurants like it because they save precious time in the lunchtime rush, and the diners like it because it ’ s simple and they can browse the menu at their leisure. It ’ s like Uber for lunch.Now consider what would happen if McDonalds were to decide to compete by introducing an application. They might have franchise constraints, or regulations for restaurants located in airports, or state laws about disclosing caloric content. All of these would have to be part of the MVP.Offsetting this, however, is the huge amount of market control the company has. It could promote the app, and give away three hamburgers for free to everyone who installed it. The company would make back the money quickly in saved time at the cash register, and have access to a new marketing channel and untapped analytical insight into its customers.Intrapreneurs need to factor these kinds of constraints and advantages into their MVP far more than independent startups do.What ’ s more, as people start to use your MVP, you have to manage the beta process carefully. You may be interfering with existing deals in the sales pipeline, or creating more work for customer support. If so, you need to have approval for the roll-out and the buy-in of stakeholders. If you ’ re launching an entirely new product line, you may even have to camouflage it so you don ’ t cannibalize existing markets until you know it ’ s successful. This, of course, undermines your ability to use unfair advantages like an existing customer base.Viral from the startIf you ’ re trying to move upwards in the BCG box, your product should include viral and word-of-mouth elements. In a world where everyone has access to a mobile device, every product needs to have an interactive strategy. There ’ s simply no excuse not to find a viral angle to act as a force multiplier for growth. In fact, adding a viral component is one of the keys to moving dogs and cash cows up into question marks and stars.Revenue within the ecosystemYou ’ ll have less flexibility to set pricing and reinvest revenues in product marketing, because as you grow you ’ ll have to coexist with other marketing efforts by your host company. When Microsoft wanted to test its SaaS-based office suite, it could do so in a relatively controlled way. But as soon as it wanted to monetize the product, it had to contend with cannibalization and push-back from a channel that depended on license revenue.Your pricing may have to take into account channels, distributors, and other factors that restrict your freedom to experiment, because changes you make will have an impact on other products in the marketplace. Had Blockbuster entered the streaming video market, it would have had to deal with labor and real estate issues at existing stores.Scale and the handoffIn the final stages of intrapreneur innovation, the new product has proven its viability. It ’ s either stolen by settlers—who can help it cross the chasm and broaden its appeal—or the team that created it must transition to a more traditional, structured model of business and take its place among the other products and divisions of the host organization.Most of the time, the DNA of a disruptive organization isn ’ t well suited to “ boring ” management and growth, so you ’ ll need to hand the product off to the rest of the organization and find the next thing to disrupt. That means you really have two customers: the external one buying the product, and the internal one that has to make, sell, and support it.Ultimately, the intrapreneur must manage the relationship with the host organization as well as the relationship with the target market. Initially, this can be intentionally distant, but as the disruptive product becomes part of the host, the hand-off must be graceful.
Why might you not want to disrupt things? To understand this, you need to look at how large organizations plan their product and market strategy.The Boston Consulting Group (BCG) box, shown in Figure 54, is a simple way to think about a company ’ s product portfolio. This venerated model classifies products or subsidiaries according to two dimensions: how quickly the market is growing, and how big a market share the company has in that market.Products with high market share, but slow growth, are “ cash cows. ” They generate revenue, but they aren ’ t worthy of heavy investment. By contrast, products with high growth but small market share are “ question marks, ” candidates for investment and development. Those with both growth and market share are the rising “ stars ” . Those with neither—called “ dogs ” —are to be sold off or shut down.The BCG box offers a thumbnail of a company ’ s product portfolio. It ’ s also a good way to think about innovation. If you ’ re trying to change a company, you ’ re either trying to create a new product (hopefully in a growing market) or you ’ re trying to innovate to revitalize an existing product with the addition of new features, markets, or services.
The first thing you ’ ll notice is the title: the Goal is to Learn. This is important, because it reminded the entrepreneurs about what they were setting out to do. It wasn ’ t about building “ stuff. ” It wasn ’ t about adding features. It wasn ’ t about getting PR, or anything else. Learning was the measure of success.Next, they would fill in a brief update on their current status, focusing on the key metrics (qualitative and/or quantitative) that they were tracking. Notice how small this box is compared to the others.The Lessons Learned box is a quick bulleted summary of key learning. The title says “ and accomplishments ” because we wanted to give entrepreneurs a place to brag … at least a little bit. Not surprisingly, they ’ d include some vanity metrics in here and we wouldn ’ t focus a lot of time on them. The “ on track: yes/no ” benchmark is designed as a test of intellectual honesty. Can entrepreneurs really come clean on what ’ s going on, good and bad? If so, we could be much more valuable.Finally, we asked entrepreneurs to list the top problems they were facing at that moment. At most we ’ d include three problems prioritized in order of importance. This section of the Problem-Solution Canvas often elicited the most debate; but it was always healthy and critical for resetting everyone ’ s goals and expectations.
In this section, the founders re-list the problems, and include hypothesized solutions. These solutions are hypothesized because we don ’ t know if they ’ ll work. These are experiments that the founders will run in the next week. We always asked them to define the metrics they ’ d use to measure success (or failure) and draw a line in the sand. If engagement was the most important problem, they had to include possible solutions they ’ d experiment with to increase engagement, define the metric (example: % daily active users) and set a target. What ’ s the problem, how do you propose to fix it, and how will you know if you succeeded? That ’ s the core of the Problem-Solution Canvas.For us (as mentors and advisors) it was an extremely valuable exercise. The Problem-Solution Canvas is also useful for internal decision-making. It ’ s a level below Lean Canvas, focusing on very specific details in a very specific time period (1-2 weeks.)
Here ’ s an example of finding a cause. SOME years ago, executives at a Houston airport faced a troubling customer-relations issue. Passengers were lodging an inordinate number of complaints about the long waits at baggage claim. In response, the executives increased the number of baggage handlers working that shift. The plan worked: the average wait fell to eight minutes, well within industry benchmarks. But the complaints persisted.Puzzled, the airport executives undertook a more careful, on-site analysis. They found that it took passengers a minute to walk from their arrival gates to baggage claim and seven more minutes to get their bags. Roughly 88 percent of their time, in other words, was spent standing around waiting for their bags.So the airport decided on a new approach: instead of reducing wait times, it moved the arrival gates away from the main terminal and routed bags to the outermost carousel. Passengers now had to walk six times longer to get their bags. Complaints dropped to near zero. Turns out that long delivery wasn ’ t causing dissatisfaction. Time spent waiting was.