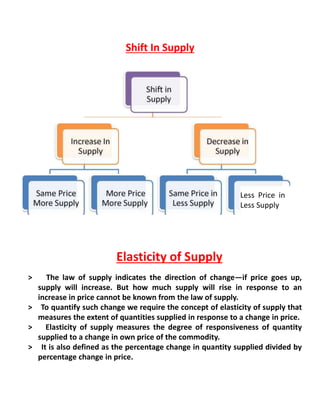
Supply and Law of Supply
Meaning Of Supply:
• Supply refers to the amount of commodity offered by a seller at a particular price per
unit of time.
• Supply is an economic term that refers to the amount of a given product or service that
suppliers are willing to offer to consumers at a given price level at a given period.
• Supply in a market can be depicted as an upward-sloping supply curve that shows how
the quantity supplied will respond to various prices over a period of time.
Definition:-
According to MC Connel "Supply may be defined as scheduled which shows the
various amount of a product which a particular seller is willing and able to produce and
available for possible price during same given period".
Factors Determining of supply
• Price of the Commodity
• Firm Goals
• Price of Inputs or Factors
• Technology
• Government Policy
• Expectations
• Prices of other Commodities
• Number of Firms
• Natural Factors
1. Price of the Commodity
• It is the main and the most important determinant of demand. When the price of the
commodity is high, the producers or suppliers are willing to sell more commodities.
• Thus, the supply of the commodity increases. Similarly, when the price is low the supply
of the commodity decreases owing to the direct relationship between the price of a
commodity and its supply.
2. Firm Goals
• The supply of goods also depends on the goals of an organization. An organization may
have various goals such as profit maximization, sales maximization, employment
maximization, etc.
• Where the firm's objective is the maximization of profit, it will sell more goods when
profits are high and less quantity of goods when the profits are low.
3. Price of Inputs or Factors
• The price of inputs or the factors of production such as land, labor, capital, and
entrepreneurship also determine the supply of the goods. When the price of inputs is
low the cost of production is also low.
• Thus, at this point, the firms tend to supply more goods in the market and vice-versa.
4. Technology
• When a firm uses new technology it saves the inputs and also reduces the cost of
production. Thus, firms produce more and supply more goods.
5. Government Policy
• The taxation policies and the subsidies given by the government also impact the supply
of goods.
• When the taxes are high the producers are unwilling to produce more goods and thus,
the supply will decrease.
• On the other hand, when the government grants various subsidies and gives financial
aids to the producers, they increase the production of goods. Thus, the supply also
increases.
6. Expectations
• When the producers or suppliers expect that the price shall increase in future they
hoard the goods so that they can sell them at higher prices later.
• This will result in a decrease in the supply of goods.
• Similarly, in case they expect a fall in price, they will increase the supply of goods.
7. Prices of other Commodities
• When the price of complementary goods increases their supply also increases. Thus, this
results in the increase in the supply of commodity also and vice-versa.
• Also, when the price of the substitutes increases their supply also increases. This results
in a decrease in the supply of goods.
8. Number of Firms
• When the number of firms in the market increase the supply of goods also increases and
vice-versa.
9. Natural Factors
• The factors like weather conditions, flood, drought, pests, etc. also affect the supply of
goods. When these factors are favorable the supply will increase.
Assumptions of the law of supply
> The mains factors which influence the supply of a commodity one, price of the commodity,
price of other related goods, price of inputs, technology of production, taxation policy of the
government and objective of the firm etc.
> The law of supply is based on the assumptions that all these factors determining supply
except price of the commodity should remain constant.
o Price of other related goods should remain the same o There should be no change in the price
of inputs (factors) o Technology of production should not change. o There is no change in the
taxation policy of the government. o Objective of the firm should not change
> The law of supply is based on the assumptions that the supply of commodity changes only
due to change in price when all other determinant of supply remain constant.
Supply Curve
• It is a Graphic presentation of supply scheduled, showing various quaintly of commodity
offered for sales at different possible prices of that commodity.
• It shows the positive relationship between price of a commodity and it quantity supply.
Types of Supply Curve
• Individual Supply Curve
• Market Supply Curve
Individual Supply Curve:- When we represent a single firm, willingness to sell
different quantities of a commodity at different prices during a given time period,
we get individual supply schedule
Example:-
Px QSy
10 5
20 10
30 15
s
10
20
30
05 10 15
X
O
Y
Market Supply Curve;> Market supply schedule is constructed by summing up the
supplies of all the individual firm at different prices during a given period of time.
> A market supply schedule is a table showing the total supply of a good by all
the firms at different price during a given time period.
Market supply schedule can be explained with the help of the following table.
Price
Quantity of
Sugar Supply
Firm A
Quantity of
Sugar Supply
Firm B
Quantity of
Sugar Supply
Firm C
Market Supply
A+B+C
25 100 200 0 300
30 200 300 100 600
35 300 400 200 900
40 400 500 300 1200
45 500 600 400 1500
In the above table we see that at a price of ' 25 per kg the firms A, B and C willing
to sell 100, 200 and 0 kgs of sugar respectively. So the market supply as ' 25 is 100
+ 200 + 0 = 300 kgs of sugar. In the same way the market supply has been
calculated at other prices also. The market supply is influenced by the number of
firms in the market.
FACTORS DETERMINING SUPPLY
Sn = f(Pn, Pr , Pf , T ,Tr, G)
Sn = Supply of commodity n
Pn = Price of the commodity n
Pr = Price of other related goods
Pf = Price of inputs/factors
T = Technology of production
Tr = Government policy or tax rate G = Goal or objective of the producer
Shift In Supply
Less Price in
Less Supply
Elasticity of Supply
> The law of supply indicates the direction of change—if price goes up,
supply will increase. But how much supply will rise in response to an
increase in price cannot be known from the law of supply.
> To quantify such change we require the concept of elasticity of supply that
measures the extent of quantities supplied in response to a change in price.
> Elasticity of supply measures the degree of responsiveness of quantity
supplied to a change in own price of the commodity.
> It is also defined as the percentage change in quantity supplied divided by
percentage change in price.
It can be calculated by using the following formula;
ES = % change in quantity supplied/% change in price
Symbolically,
ES = AQ/Q AP/P = AQ/AP x P/Q
Degrees of Elasticity of Supply
> Perfectly inelastic supply (Es = 0)
> Inelastic or less than unit elastic supply (Es < 1)
> Unitary elastic supply (Es = 1)
> Elastic or more than unit elastic supply (Es > 1)
> Perfectly elastic supply (Es = ~)
1. Perfectly inelastic supply (Es = 0)
• Supply of a commodity is said to be
perfectly inelastic when the quantity
supplied of a commodity does not change at
all in response to change in price of the
commodity.
• It means that the price of the commodity
may increase or decrease but its quantity
2. Inelastic or less than unit elastic supply (Es < 1)
i
• When the percentage change in quantity
supplied of a commodity is less than the
percentage change in its price, the supply of
the commodity is said to be inelastic or less
than unit elastic.
i
• It happens generally in case of perishable
i
goods as it is very difficult to store them.
3. Unitary elastic supply (Es = 1)
• When the percentage change in quantity
supplied of a commodity is equal to percentage
change in its price, the supply of the commodity
is said to be unitary elastic.
• It means if the price of the commodity
increases by 50 per cent its quantity supplied
will also increase by 50 percent.
4. Elastic or more than unit elastic supply (Es > 1)
• When the percentage change in quantity supplied
of a commodity is greater than the percentage change
in its price, the supply of the commodity is said to be
greater than unit elastic.
• It happens in case of durable goods because if the
price falls they can be easily stored for future sale.
• If the price of such goods falls by 20%, their
quantity supplied falls by more than 20%. In such
cases, price elasticity of supply is greater than one.
5. Perfectly elastic supply (Es = ~)
When the quantity supplied of a commodity
expands or contracts to any extent without any
change or with an infinitely small change in its price,
the supply of the commodity is called perfectly
elastic
Its supply curve is a horizontal line parallel to x-axis.
It can be shown with the help of the following
supply schedule and supply curve.
*
Measurement & Methods of Supply
After knowing various degrees of price elasticity of supply we have to understand the
methods of calculating price elasticity of supply. At this stage we shall discuss the following
two methods that are used for calculating price elasticity of supply.
(i) Percentage or Proportionate method.
(ii) Geometric or Point method.
I. Percentage or Proportionate method:
> This is the most popular method of measurement of price elasticity of supply.
With the help of this method we can calculate the accurate value of price
elasticity of supply.
> This method measures the degree of responsiveness of quantity supplied of a
commodity to change in its price. The price elasticity of supply is the ratio of
percentage change in quantity supplied of a commodity to percentage change in
its price.
Example
QS = change in quantity supplied
P = Change in price
P = Original price
Qs = Original quantity supplied
Price Quantity
RS 10 100 Unit
RS 30 500Unit
Ans:-
Qs = Qi - Q = 500-100 = 400Units, Q = 100Unit
AP = Pi- P = 30- 10 = Rs 40/- P = Rs 10/-
Es = AQs / AP X P/Q
= 400/40 X 10/100 = 1 (Unitary elastic supply, Es = 1)
II.Geometric or Point method
> Geometric method is also called the point method of calculating price elasticity of
supply as with the help of this method we can calculate price elasticity of supply of a
commodity at a point on the supply curve.
> Under this method we can calculate price elasticity of supply at a given point on the
supply curve with the help of the following method. To measure price elasticity of
supply at a point we extend the supply curve so that it meets the x-axis at point B in its
negative range, positive range or exactly at the point of origin.
Formula
BQ (Horizontal segment)
OQ (Quantity supplied)
In figure (a) Es=
In figure (c) Es=
In figure (b) Es=
THANK YOU

Law-Of-Supply-_-Elasticity-of-Supply-PPT.ppt

  • 1.
    Supply and Lawof Supply Meaning Of Supply: • Supply refers to the amount of commodity offered by a seller at a particular price per unit of time. • Supply is an economic term that refers to the amount of a given product or service that suppliers are willing to offer to consumers at a given price level at a given period. • Supply in a market can be depicted as an upward-sloping supply curve that shows how the quantity supplied will respond to various prices over a period of time. Definition:- According to MC Connel "Supply may be defined as scheduled which shows the various amount of a product which a particular seller is willing and able to produce and available for possible price during same given period". Factors Determining of supply • Price of the Commodity • Firm Goals • Price of Inputs or Factors • Technology • Government Policy • Expectations • Prices of other Commodities • Number of Firms • Natural Factors 1. Price of the Commodity • It is the main and the most important determinant of demand. When the price of the commodity is high, the producers or suppliers are willing to sell more commodities. • Thus, the supply of the commodity increases. Similarly, when the price is low the supply of the commodity decreases owing to the direct relationship between the price of a commodity and its supply. 2. Firm Goals • The supply of goods also depends on the goals of an organization. An organization may have various goals such as profit maximization, sales maximization, employment maximization, etc. • Where the firm's objective is the maximization of profit, it will sell more goods when profits are high and less quantity of goods when the profits are low.
  • 2.
    3. Price ofInputs or Factors • The price of inputs or the factors of production such as land, labor, capital, and entrepreneurship also determine the supply of the goods. When the price of inputs is low the cost of production is also low. • Thus, at this point, the firms tend to supply more goods in the market and vice-versa. 4. Technology • When a firm uses new technology it saves the inputs and also reduces the cost of production. Thus, firms produce more and supply more goods. 5. Government Policy • The taxation policies and the subsidies given by the government also impact the supply of goods. • When the taxes are high the producers are unwilling to produce more goods and thus, the supply will decrease. • On the other hand, when the government grants various subsidies and gives financial aids to the producers, they increase the production of goods. Thus, the supply also increases. 6. Expectations • When the producers or suppliers expect that the price shall increase in future they hoard the goods so that they can sell them at higher prices later. • This will result in a decrease in the supply of goods. • Similarly, in case they expect a fall in price, they will increase the supply of goods. 7. Prices of other Commodities • When the price of complementary goods increases their supply also increases. Thus, this results in the increase in the supply of commodity also and vice-versa. • Also, when the price of the substitutes increases their supply also increases. This results in a decrease in the supply of goods. 8. Number of Firms • When the number of firms in the market increase the supply of goods also increases and vice-versa. 9. Natural Factors • The factors like weather conditions, flood, drought, pests, etc. also affect the supply of goods. When these factors are favorable the supply will increase.
  • 3.
    Assumptions of thelaw of supply > The mains factors which influence the supply of a commodity one, price of the commodity, price of other related goods, price of inputs, technology of production, taxation policy of the government and objective of the firm etc. > The law of supply is based on the assumptions that all these factors determining supply except price of the commodity should remain constant. o Price of other related goods should remain the same o There should be no change in the price of inputs (factors) o Technology of production should not change. o There is no change in the taxation policy of the government. o Objective of the firm should not change > The law of supply is based on the assumptions that the supply of commodity changes only due to change in price when all other determinant of supply remain constant. Supply Curve • It is a Graphic presentation of supply scheduled, showing various quaintly of commodity offered for sales at different possible prices of that commodity. • It shows the positive relationship between price of a commodity and it quantity supply. Types of Supply Curve • Individual Supply Curve • Market Supply Curve Individual Supply Curve:- When we represent a single firm, willingness to sell different quantities of a commodity at different prices during a given time period, we get individual supply schedule Example:- Px QSy 10 5 20 10 30 15 s 10 20 30 05 10 15 X O Y
  • 4.
    Market Supply Curve;>Market supply schedule is constructed by summing up the supplies of all the individual firm at different prices during a given period of time. > A market supply schedule is a table showing the total supply of a good by all the firms at different price during a given time period. Market supply schedule can be explained with the help of the following table. Price Quantity of Sugar Supply Firm A Quantity of Sugar Supply Firm B Quantity of Sugar Supply Firm C Market Supply A+B+C 25 100 200 0 300 30 200 300 100 600 35 300 400 200 900 40 400 500 300 1200 45 500 600 400 1500 In the above table we see that at a price of ' 25 per kg the firms A, B and C willing to sell 100, 200 and 0 kgs of sugar respectively. So the market supply as ' 25 is 100 + 200 + 0 = 300 kgs of sugar. In the same way the market supply has been calculated at other prices also. The market supply is influenced by the number of firms in the market. FACTORS DETERMINING SUPPLY Sn = f(Pn, Pr , Pf , T ,Tr, G) Sn = Supply of commodity n Pn = Price of the commodity n Pr = Price of other related goods Pf = Price of inputs/factors T = Technology of production Tr = Government policy or tax rate G = Goal or objective of the producer
  • 5.
    Shift In Supply LessPrice in Less Supply Elasticity of Supply > The law of supply indicates the direction of change—if price goes up, supply will increase. But how much supply will rise in response to an increase in price cannot be known from the law of supply. > To quantify such change we require the concept of elasticity of supply that measures the extent of quantities supplied in response to a change in price. > Elasticity of supply measures the degree of responsiveness of quantity supplied to a change in own price of the commodity. > It is also defined as the percentage change in quantity supplied divided by percentage change in price.
  • 6.
    It can becalculated by using the following formula; ES = % change in quantity supplied/% change in price Symbolically, ES = AQ/Q AP/P = AQ/AP x P/Q Degrees of Elasticity of Supply > Perfectly inelastic supply (Es = 0) > Inelastic or less than unit elastic supply (Es < 1) > Unitary elastic supply (Es = 1) > Elastic or more than unit elastic supply (Es > 1) > Perfectly elastic supply (Es = ~) 1. Perfectly inelastic supply (Es = 0) • Supply of a commodity is said to be perfectly inelastic when the quantity supplied of a commodity does not change at all in response to change in price of the commodity. • It means that the price of the commodity may increase or decrease but its quantity 2. Inelastic or less than unit elastic supply (Es < 1) i • When the percentage change in quantity supplied of a commodity is less than the percentage change in its price, the supply of the commodity is said to be inelastic or less than unit elastic. i • It happens generally in case of perishable i goods as it is very difficult to store them.
  • 7.
    3. Unitary elasticsupply (Es = 1) • When the percentage change in quantity supplied of a commodity is equal to percentage change in its price, the supply of the commodity is said to be unitary elastic. • It means if the price of the commodity increases by 50 per cent its quantity supplied will also increase by 50 percent. 4. Elastic or more than unit elastic supply (Es > 1) • When the percentage change in quantity supplied of a commodity is greater than the percentage change in its price, the supply of the commodity is said to be greater than unit elastic. • It happens in case of durable goods because if the price falls they can be easily stored for future sale. • If the price of such goods falls by 20%, their quantity supplied falls by more than 20%. In such cases, price elasticity of supply is greater than one. 5. Perfectly elastic supply (Es = ~) When the quantity supplied of a commodity expands or contracts to any extent without any change or with an infinitely small change in its price, the supply of the commodity is called perfectly elastic Its supply curve is a horizontal line parallel to x-axis. It can be shown with the help of the following supply schedule and supply curve. *
  • 8.
    Measurement & Methodsof Supply After knowing various degrees of price elasticity of supply we have to understand the methods of calculating price elasticity of supply. At this stage we shall discuss the following two methods that are used for calculating price elasticity of supply. (i) Percentage or Proportionate method. (ii) Geometric or Point method. I. Percentage or Proportionate method: > This is the most popular method of measurement of price elasticity of supply. With the help of this method we can calculate the accurate value of price elasticity of supply. > This method measures the degree of responsiveness of quantity supplied of a commodity to change in its price. The price elasticity of supply is the ratio of percentage change in quantity supplied of a commodity to percentage change in its price. Example QS = change in quantity supplied P = Change in price P = Original price Qs = Original quantity supplied Price Quantity RS 10 100 Unit RS 30 500Unit
  • 9.
    Ans:- Qs = Qi- Q = 500-100 = 400Units, Q = 100Unit AP = Pi- P = 30- 10 = Rs 40/- P = Rs 10/- Es = AQs / AP X P/Q = 400/40 X 10/100 = 1 (Unitary elastic supply, Es = 1) II.Geometric or Point method > Geometric method is also called the point method of calculating price elasticity of supply as with the help of this method we can calculate price elasticity of supply of a commodity at a point on the supply curve. > Under this method we can calculate price elasticity of supply at a given point on the supply curve with the help of the following method. To measure price elasticity of supply at a point we extend the supply curve so that it meets the x-axis at point B in its negative range, positive range or exactly at the point of origin. Formula BQ (Horizontal segment) OQ (Quantity supplied) In figure (a) Es= In figure (c) Es= In figure (b) Es=
  • 10.