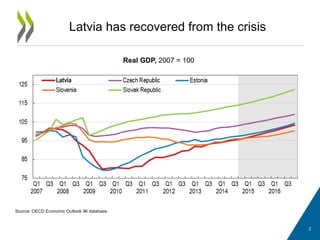
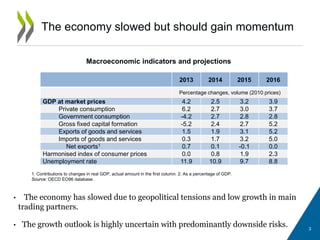
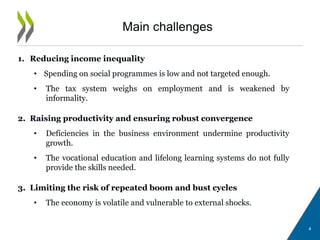
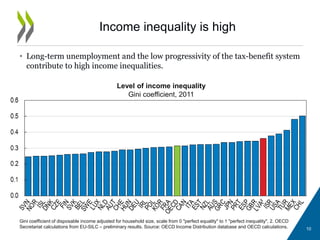
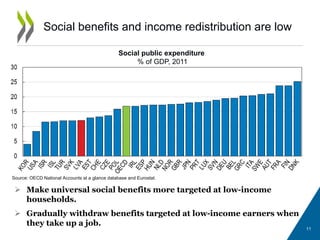
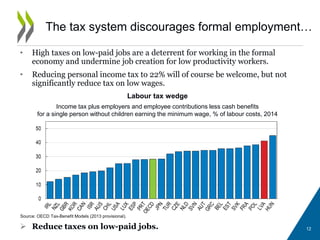
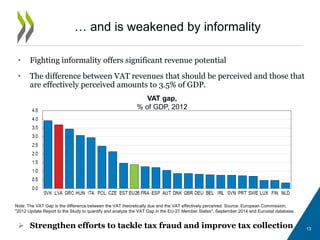
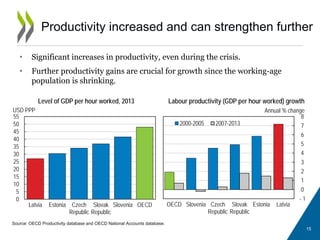
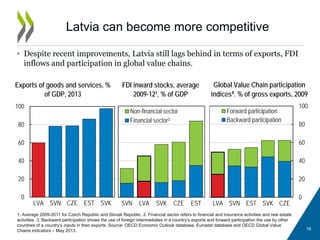
www.oecd.org/eco/surveys/economic-survey-latvia.htm
OECD
OECD Economics
2015 OECD ECONOMIC SURVEY
OF LATVIA
ENSURE INCLUSIVE AND ROBUST GROWTH
Riga, 25 February 2015
Latvia has recovered from the crisis
Real GDP, 2007 = 100
Source: OECD Economic Outlook 96 database.
2
The economy slowed but should gain momentum
2013 2014 2015 2016
Percentage changes, volume (2010 prices)
GDP at market prices 4.2 2.5 3.2 3.9
Private consumption 6.2 2.7 3.0 3.7
Government consumption -4.2 2.7 2.8 2.8
Gross fixed capital formation -5.2 2.4 2.7 5.2
Exports of goods and services 1.5 1.9 3.1 5.2
Imports of goods and services 0.3 1.7 3.2 5.0
Net exports1 0.7 0.1 -0.1 0.0
Harmonised index of consumer prices 0.0 0.8 1.9 2.3
Unemployment rate 11.9 10.9 9.7 8.8
Macroeconomic indicators and projections
1. Contributions to changes in real GDP, actual amount in the first column. 2. As a percentage of GDP.
Source: OECD EO96 database.
• The economy has slowed due to geopolitical tensions and low growth in main
trading partners.
• The growth outlook is highly uncertain with predominantly downside risks. 3
Main challenges
1. Reducing income inequality
• Spending on social programmes is low and not targeted enough.
• The tax system weighs on employment and is weakened by
informality.
2. Raising productivity and ensuring robust convergence
• Deficiencies in the business environment undermine productivity
growth.
• The vocational education and lifelong learning systems do not fully
provide the skills needed.
3. Limiting the risk of repeated boom and bust cycles
• The economy is volatile and vulnerable to external shocks.
4
Key recommendations
1. Reducing income inequality
• Make social benefits better targeted to low-income households.
• Reduce taxes on low-paid jobs.
• Strengthen efforts to tackle tax fraud and improve tax collection.
2. Raising productivity and ensuring robust convergence
• Reduce entry barriers and red tape, improve governance of state-
owned enterprises.
• Proceed with the reform of vocational education and training,
including the extension of work-based learning.
3. Limiting the risk of repeated boom and bust cycles
• Build up a fiscal reserve to cope with adverse macroeconomic
shocks.
5
• Latvia has made significant progress, achieving important milestones, such as
the euro area membership (2014).
• GDP per capita remains well below the best performing OECD countries.
Convergence has resumed
Income gap to the upper half of OECD countries, %
Percentage gap with respect to the simple average of the highest 17 OECD countries in terms of GDP per capita (in constant 2005 PPPs).
Source: OECD National accounts database and World Bank, WDI database.
6
But well-being can be improved
Note: difference with the OECD average normalized by the standard deviation. A positive difference means that the country does
better than the average of OECD countries in terms of this variable. Source: OECD National accounts database, Eurostat database,
World Development Indicators Database, OECD Labour Force Statistics database, OECD PISA 2012 database, International Institute
for Democracy and Electoral Assistance (IDEA) database, OECD Health Statistics database, Central Statistical Bureau of Latvia,
WHO Mortality database and Gallup World.
Difference with the OECD average
7
• GDP, inflation, unemployment tend to fluctuate significantly.
• Latvia is particularly exposed to external shocks.
And the economy remains highly volatile
GDP growth rate compared to the same quarter previous year, %
Source: OECD Quarterly national accounts database.
8
Reducing income inequality
by improving public sector efficiency
9
• Long-term unemployment and the low progressivity of the tax-benefit system
contribute to high income inequalities.
Income inequality is high
Gini coefficient of disposable income adjusted for household size, scale from 0 "perfect equality" to 1 "perfect inequality", 2. OECD
Secretariat calculations from EU-SILC – preliminary results. Source: OECD Income Distribution database and OECD calculations.
Level of income inequality
Gini coefficient, 2011
10
Social benefits and income redistribution are low
 Make universal social benefits more targeted at low-income
households.
 Gradually withdraw benefits targeted at low-income earners when
they take up a job.
Social public expenditure
% of GDP, 2011
Source: OECD National Accounts at a glance database and Eurostat.
11
• High taxes on low-paid jobs are a deterrent for working in the formal
economy and undermine job creation for low productivity workers.
• Reducing personal income tax to 22% will of course be welcome, but not
significantly reduce tax on low wages.
 Reduce taxes on low-paid jobs.
The tax system discourages formal employment…
Source: OECD Tax-Benefit Models (2013 provisional).
Labour tax wedge
Income tax plus employers and employee contributions less cash benefits
for a single person without children earning the minimum wage, % of labour costs, 2014
12
• Fighting informality offers significant revenue potential
• The difference between VAT revenues that should be perceived and those that
are effectively perceived amounts to 3.5% of GDP.
 Strengthen efforts to tackle tax fraud and improve tax collection
… and is weakened by informality
VAT gap,
% of GDP, 2012
Note: The VAT Gap is the difference between the VAT theoretically due and the VAT effectively perceived. Source: European Commission,
"2012 Update Report to the Study to quantify and analyze the VAT Gap in the EU-27 Member States", September 2014 and Eurostat database.
13
Raising productivity and
ensuring robust convergence
14
Productivity increased and can strengthen further
• Significant increases in productivity, even during the crisis.
• Further productivity gains are crucial for growth since the working-age
population is shrinking.
Source: OECD Productivity database and OECD National Accounts database.
Level of GDP per hour worked, 2013 Labour productivity (GDP per hour worked) growth
0
5
10
15
20
25
30
35
40
45
50
55
Latvia Estonia Czech
Republic
Slovak
Republic
Slovenia OECD
USD PPP
- 1
0
1
2
3
4
5
6
7
8
OECD Slovenia Czech
Republic
Slovak
Republic
Estonia Latvia
Annual % change
2000-2005 2007-2013
15
• Despite recent improvements, Latvia still lags behind in terms of exports, FDI
inflows and participation in global value chains.
Latvia can become more competitive
1. Average 2009-2011 for Czech Republic and Slovak Republic. 2. Financial sector refers to financial and insurance activities and real estate
activities. 3. Backward participation shows the use of foreign intermediates in a country’s exports and forward participation the use by other
countries of a country’s inputs in their exports. Source: OECD Economic Outlook database, Eurostat database and OECD Global Value
Chains indicators – May 2013.
Global Value Chain participation
indices³. % of gross exports, 2009
Exports of goods and services, %
of GDP, 2013
FDI inward stocks, average
2009-12¹, % of GDP
0
20
40
60
80
100
LVA SVN CZE EST SVK
0
20
40
60
80
100
LVA SVN EST SVK CZE
Forward participation
Backward participation
SVN LVA SVK CZE EST
Non-financial sector
Financial sector²
16
Regulation weighs on the economy
 Make regulation more competition-friendly by reducing entry barriers
Source: OECD (2013), Product Market Regulation Database
Product Market Regulation (PMR) is more restrictive than in the average
OECD country
Overall indicator
0.0
0.5
1.0
1.5
2.0
2.5
3.0
17
The business environment can be enhanced
Product Market Regulation (PMR) sub-indicators
2013, index scale of 0-6 from least to most restrictive
Source: OECD (2013), Product Market Regulation Database
 Improve the governance of state-owned enterprises.
 Continue reducing red tape, by simplifying the permits and licenses
system.
 Continue improving the connectivity of energy networks with the rest
of the European Union.
Government involvement in network sectors Licenses and permits system
0
1
2
3
4
5
6
CZE SVK EST LVA SVN OECD
average
0
0
1
2
3
4
5
6
SVK CZE EST SVN LVA OECD
average
18
Energy intensity is above the OECD average
• Reducing energy intensity would improve cost-competitiveness, reduce
greenhouse gas emissions and lower the vulnerability to supply disruptions.
 Increase energy taxes and phase out tax exemptions and
reductions.
Total final energy consumption per unit of GDP
toe per thousand 2005 PPP USD of GDP, 2012
Source: IEA (2014), World Energy Statistics and Balances database.
19
• University graduates do well, but those with lower education level lag behind.
 Proceed with the reform of vocational education and training,
including the planned extension of work-based learning.
Employment rates can rise further
Employment rates among 25-64 year olds
%, 2013
Source: Eurostat database.
20
Lifelong learning has to play a bigger role
 Encourage
lifelong
learning and
training:
 Improve
information
about
training
opportunities
and adult
learning
 Ensure the
portability of
skills.
Participation rate in formal or non-formal education and training
25-64 years-olds, 2011, %
Note: Based on the adult education survey (AES). 2007 data for Turkey. Source: Eurostat database.
Formal education and training
Non-formal education and training
0
10
20
30
40
50
60
70
80
0
2
4
6
8
10
12
14
16
21
• Both private and public spending on R&D is low.
• Number of incentives have been put in place to foster R&D and innovation.
R&D expenditure should be increased
Gross domestic expenditure on R&D, % of GDP, 2012 or lastest year available
Target 2020
0.0
0.5
1.0
1.5
2.0
2.5
3.0
3.5
4.0
4.5
%
22
Limiting the risk
of repeated boom-bust cycle
23
Imbalances came at a cost, but debt is set to decline
• The fiscal deficit and the public debt increased during the crisis.
• A major fiscal consolidation was implemented with a negative impact on
domestic demand.
Source: OECD Economic Outlook 96 database.
Public deficit and government debt
24
Fiscal policy
• The fiscal rules bring long-term view, should ensure public finances are
sustainable and automatic stabilisers work freely.
• Latvia remains vulnerable to market turbulence that may generate access
barriers to international financial markets.
 Build up a fiscal reserve to cope with adverse economic shocks.
Financial sector supervision
• The financial supervision is appropriate but risks related to the large share of
non-resident deposits in the banking sector are difficult to eliminate.
 Continue monitoring non-resident banking businesses.
Policies need to lean against the wind
25
More Information…
www.oecd.org/eco/surveys/economic-survey-latvia.htm
OECD
OECD Economics
Disclaimers:
The statistical data for Israel are supplied by and under the responsibility of the relevant Israeli authorities. The use of such data by the OECD is without
prejudice to the status of the Golan Heights, East Jerusalem and Israeli settlements in the West Bank under the terms of international law.
This document and any map included herein are without prejudice to the status of or sovereignty over any territory, to the delimitation of international frontiers
and boundaries and to the name of any territory, city or area.
26

Latvia ensure--inclusive-and-robust-growth-main-findings-oecd

  • 1.
    www.oecd.org/eco/surveys/economic-survey-latvia.htm OECD OECD Economics 2015 OECDECONOMIC SURVEY OF LATVIA ENSURE INCLUSIVE AND ROBUST GROWTH Riga, 25 February 2015
  • 2.
    Latvia has recoveredfrom the crisis Real GDP, 2007 = 100 Source: OECD Economic Outlook 96 database. 2
  • 3.
    The economy slowedbut should gain momentum 2013 2014 2015 2016 Percentage changes, volume (2010 prices) GDP at market prices 4.2 2.5 3.2 3.9 Private consumption 6.2 2.7 3.0 3.7 Government consumption -4.2 2.7 2.8 2.8 Gross fixed capital formation -5.2 2.4 2.7 5.2 Exports of goods and services 1.5 1.9 3.1 5.2 Imports of goods and services 0.3 1.7 3.2 5.0 Net exports1 0.7 0.1 -0.1 0.0 Harmonised index of consumer prices 0.0 0.8 1.9 2.3 Unemployment rate 11.9 10.9 9.7 8.8 Macroeconomic indicators and projections 1. Contributions to changes in real GDP, actual amount in the first column. 2. As a percentage of GDP. Source: OECD EO96 database. • The economy has slowed due to geopolitical tensions and low growth in main trading partners. • The growth outlook is highly uncertain with predominantly downside risks. 3
  • 4.
    Main challenges 1. Reducingincome inequality • Spending on social programmes is low and not targeted enough. • The tax system weighs on employment and is weakened by informality. 2. Raising productivity and ensuring robust convergence • Deficiencies in the business environment undermine productivity growth. • The vocational education and lifelong learning systems do not fully provide the skills needed. 3. Limiting the risk of repeated boom and bust cycles • The economy is volatile and vulnerable to external shocks. 4
  • 5.
    Key recommendations 1. Reducingincome inequality • Make social benefits better targeted to low-income households. • Reduce taxes on low-paid jobs. • Strengthen efforts to tackle tax fraud and improve tax collection. 2. Raising productivity and ensuring robust convergence • Reduce entry barriers and red tape, improve governance of state- owned enterprises. • Proceed with the reform of vocational education and training, including the extension of work-based learning. 3. Limiting the risk of repeated boom and bust cycles • Build up a fiscal reserve to cope with adverse macroeconomic shocks. 5
  • 6.
    • Latvia hasmade significant progress, achieving important milestones, such as the euro area membership (2014). • GDP per capita remains well below the best performing OECD countries. Convergence has resumed Income gap to the upper half of OECD countries, % Percentage gap with respect to the simple average of the highest 17 OECD countries in terms of GDP per capita (in constant 2005 PPPs). Source: OECD National accounts database and World Bank, WDI database. 6
  • 7.
    But well-being canbe improved Note: difference with the OECD average normalized by the standard deviation. A positive difference means that the country does better than the average of OECD countries in terms of this variable. Source: OECD National accounts database, Eurostat database, World Development Indicators Database, OECD Labour Force Statistics database, OECD PISA 2012 database, International Institute for Democracy and Electoral Assistance (IDEA) database, OECD Health Statistics database, Central Statistical Bureau of Latvia, WHO Mortality database and Gallup World. Difference with the OECD average 7
  • 8.
    • GDP, inflation,unemployment tend to fluctuate significantly. • Latvia is particularly exposed to external shocks. And the economy remains highly volatile GDP growth rate compared to the same quarter previous year, % Source: OECD Quarterly national accounts database. 8
  • 9.
    Reducing income inequality byimproving public sector efficiency 9
  • 10.
    • Long-term unemploymentand the low progressivity of the tax-benefit system contribute to high income inequalities. Income inequality is high Gini coefficient of disposable income adjusted for household size, scale from 0 "perfect equality" to 1 "perfect inequality", 2. OECD Secretariat calculations from EU-SILC – preliminary results. Source: OECD Income Distribution database and OECD calculations. Level of income inequality Gini coefficient, 2011 10
  • 11.
    Social benefits andincome redistribution are low  Make universal social benefits more targeted at low-income households.  Gradually withdraw benefits targeted at low-income earners when they take up a job. Social public expenditure % of GDP, 2011 Source: OECD National Accounts at a glance database and Eurostat. 11
  • 12.
    • High taxeson low-paid jobs are a deterrent for working in the formal economy and undermine job creation for low productivity workers. • Reducing personal income tax to 22% will of course be welcome, but not significantly reduce tax on low wages.  Reduce taxes on low-paid jobs. The tax system discourages formal employment… Source: OECD Tax-Benefit Models (2013 provisional). Labour tax wedge Income tax plus employers and employee contributions less cash benefits for a single person without children earning the minimum wage, % of labour costs, 2014 12
  • 13.
    • Fighting informalityoffers significant revenue potential • The difference between VAT revenues that should be perceived and those that are effectively perceived amounts to 3.5% of GDP.  Strengthen efforts to tackle tax fraud and improve tax collection … and is weakened by informality VAT gap, % of GDP, 2012 Note: The VAT Gap is the difference between the VAT theoretically due and the VAT effectively perceived. Source: European Commission, "2012 Update Report to the Study to quantify and analyze the VAT Gap in the EU-27 Member States", September 2014 and Eurostat database. 13
  • 14.
    Raising productivity and ensuringrobust convergence 14
  • 15.
    Productivity increased andcan strengthen further • Significant increases in productivity, even during the crisis. • Further productivity gains are crucial for growth since the working-age population is shrinking. Source: OECD Productivity database and OECD National Accounts database. Level of GDP per hour worked, 2013 Labour productivity (GDP per hour worked) growth 0 5 10 15 20 25 30 35 40 45 50 55 Latvia Estonia Czech Republic Slovak Republic Slovenia OECD USD PPP - 1 0 1 2 3 4 5 6 7 8 OECD Slovenia Czech Republic Slovak Republic Estonia Latvia Annual % change 2000-2005 2007-2013 15
  • 16.
    • Despite recentimprovements, Latvia still lags behind in terms of exports, FDI inflows and participation in global value chains. Latvia can become more competitive 1. Average 2009-2011 for Czech Republic and Slovak Republic. 2. Financial sector refers to financial and insurance activities and real estate activities. 3. Backward participation shows the use of foreign intermediates in a country’s exports and forward participation the use by other countries of a country’s inputs in their exports. Source: OECD Economic Outlook database, Eurostat database and OECD Global Value Chains indicators – May 2013. Global Value Chain participation indices³. % of gross exports, 2009 Exports of goods and services, % of GDP, 2013 FDI inward stocks, average 2009-12¹, % of GDP 0 20 40 60 80 100 LVA SVN CZE EST SVK 0 20 40 60 80 100 LVA SVN EST SVK CZE Forward participation Backward participation SVN LVA SVK CZE EST Non-financial sector Financial sector² 16
  • 17.
    Regulation weighs onthe economy  Make regulation more competition-friendly by reducing entry barriers Source: OECD (2013), Product Market Regulation Database Product Market Regulation (PMR) is more restrictive than in the average OECD country Overall indicator 0.0 0.5 1.0 1.5 2.0 2.5 3.0 17
  • 18.
    The business environmentcan be enhanced Product Market Regulation (PMR) sub-indicators 2013, index scale of 0-6 from least to most restrictive Source: OECD (2013), Product Market Regulation Database  Improve the governance of state-owned enterprises.  Continue reducing red tape, by simplifying the permits and licenses system.  Continue improving the connectivity of energy networks with the rest of the European Union. Government involvement in network sectors Licenses and permits system 0 1 2 3 4 5 6 CZE SVK EST LVA SVN OECD average 0 0 1 2 3 4 5 6 SVK CZE EST SVN LVA OECD average 18
  • 19.
    Energy intensity isabove the OECD average • Reducing energy intensity would improve cost-competitiveness, reduce greenhouse gas emissions and lower the vulnerability to supply disruptions.  Increase energy taxes and phase out tax exemptions and reductions. Total final energy consumption per unit of GDP toe per thousand 2005 PPP USD of GDP, 2012 Source: IEA (2014), World Energy Statistics and Balances database. 19
  • 20.
    • University graduatesdo well, but those with lower education level lag behind.  Proceed with the reform of vocational education and training, including the planned extension of work-based learning. Employment rates can rise further Employment rates among 25-64 year olds %, 2013 Source: Eurostat database. 20
  • 21.
    Lifelong learning hasto play a bigger role  Encourage lifelong learning and training:  Improve information about training opportunities and adult learning  Ensure the portability of skills. Participation rate in formal or non-formal education and training 25-64 years-olds, 2011, % Note: Based on the adult education survey (AES). 2007 data for Turkey. Source: Eurostat database. Formal education and training Non-formal education and training 0 10 20 30 40 50 60 70 80 0 2 4 6 8 10 12 14 16 21
  • 22.
    • Both privateand public spending on R&D is low. • Number of incentives have been put in place to foster R&D and innovation. R&D expenditure should be increased Gross domestic expenditure on R&D, % of GDP, 2012 or lastest year available Target 2020 0.0 0.5 1.0 1.5 2.0 2.5 3.0 3.5 4.0 4.5 % 22
  • 23.
    Limiting the risk ofrepeated boom-bust cycle 23
  • 24.
    Imbalances came ata cost, but debt is set to decline • The fiscal deficit and the public debt increased during the crisis. • A major fiscal consolidation was implemented with a negative impact on domestic demand. Source: OECD Economic Outlook 96 database. Public deficit and government debt 24
  • 25.
    Fiscal policy • Thefiscal rules bring long-term view, should ensure public finances are sustainable and automatic stabilisers work freely. • Latvia remains vulnerable to market turbulence that may generate access barriers to international financial markets.  Build up a fiscal reserve to cope with adverse economic shocks. Financial sector supervision • The financial supervision is appropriate but risks related to the large share of non-resident deposits in the banking sector are difficult to eliminate.  Continue monitoring non-resident banking businesses. Policies need to lean against the wind 25
  • 26.
    More Information… www.oecd.org/eco/surveys/economic-survey-latvia.htm OECD OECD Economics Disclaimers: Thestatistical data for Israel are supplied by and under the responsibility of the relevant Israeli authorities. The use of such data by the OECD is without prejudice to the status of the Golan Heights, East Jerusalem and Israeli settlements in the West Bank under the terms of international law. This document and any map included herein are without prejudice to the status of or sovereignty over any territory, to the delimitation of international frontiers and boundaries and to the name of any territory, city or area. 26