Downloaded 142 times
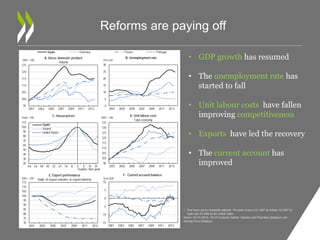


The 2014 OECD Economic Survey of Spain highlights that structural reforms in the labor market, banking, and fiscal policies have initiated economic recovery, yet unemployment remains high and innovation is lacking. Recommendations include enhancing job search assistance, improving tax structures, streamlining regulations for business growth, and boosting financing access for firms. While GDP growth has resumed and the current account has improved, public debt remains elevated, necessitating further reforms to support sustainable growth and reduce inequality.


![Awareness of digital currency[1] (1).pptx](https://cdn.slidesharecdn.com/ss_thumbnails/awarenessofdigitalcurrency11-260125155504-b1badee4-thumbnail.jpg?width=640&height=640&fit=bounds)


