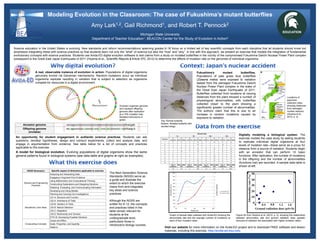
Modeling Evolution in the Classroom: The case of Fukushima’s mutant butterflies
Amy Lark1,2, Gail Richmond1, and Robert T. Pennock2
Michigan State University
Department of Teacher Education1, BEACON Center for the Study of Evolution in Action2
EDUCATION
NGSS Dimension Specific aspect of dimension applicable to exercise
Science and Engineering
Practices
Analyzing and Interpreting Data
Engaging in Argument from Evidence
Using Mathematics and Computational Thinking
Constructing Explanations and Designing Solutions
Obtaining, Evaluating, and Communicating Information
Developing and Using Models
Planning and Carrying Out Investigations
Disciplinary Core Ideas
LS1.A: Structure and Function
LS3.A: Inheritance of Traits
LS3.B: Variation of Traits
LS4.B: Natural Selection
LS4.C: Adaptation
LS4.D: Biodiversity and Humans
ETS1.B: Developing Possible Solutions
Crosscutting Concepts
Cause and Effect
Scale, Proportion, and Quantity
Patterns
Ancestor genome wzcagcccccccccccccccccccccccccccccccccccczvfcaxgab
Offspring genome
(inviable)
wzyagcccccccoccccccqcccvpcccqcctcccccccmczvfcaxgrb
Science education in the United States is evolving. New standards and reform recommendations spanning grades K-16 focus on a limited set of key scientific concepts from each discipline that all students should know but
emphasize integrating these with science practices so that students learn not only the “what” of science but also the “how” and “why”. In line with this approach, we present an exercise that models the integration of fundamental
evolutionary concepts with science practices. Students use Avida-ED digital evolution software to test claims from a study on mutated butterflies in the vicinity of the compromised Fukushima Daiichi Nuclear Power Plant complex
subsequent to the Great East Japan Earthquake of 2011 (Hiyama et al., Scientific Reports 2 Article 570, 2012) to determine the effects of mutation rate on the genomes of individual organisms.
A real, observable instance of evolution in action. Populations of digital organisms
genuinely evolve via Darwinian mechanisms. Random mutations occur as individual
organisms replicate resulting in variation that is subject to selection as organisms
compete for resources in a digital environment.
An opportunity for student engagement in authentic science practices. Students can ask
questions, develop hypotheses, design and conduct experiments, collect and analyze data, and
engage in argumentation from evidence. See table below for a list of concepts and practices
applicable to this exercise.
A model for biological evolution. Evolving populations of digital organisms show the same
general patterns found in biological systems (see data table and graphs at right as examples).
Ancestor organism genome
and resultant offspring
genome after replication
at a 15% mutation rate.
Mutated instructions in
green.
The Next Generation Science
Standards (NGSS) serve as
a guide and illustrate the
extent to which the exercise
draws from and integrates
key ideas and science
practices.
Although the NGSS are
written for K-12, the concepts
and practices listed in the
table remain relevant for
students at the
undergraduate level,
particularly those in
introductory biology courses.
Fukushima’s mutant butterflies.
Populations of pale grass blue butterflies
(Zizeeria maha) were exposed to radiation
leaked from the damaged Fukushima Daiichi
Nuclear Power Plant complex in the wake of
the Great East Japan Earthquake of 2011.
Butterflies collected from locations at varying
distances from the plant showed a number of
physiological abnormalities, with butterflies
collected closer to the plant showing a
significantly greater number of abnormalities.
The authors claim that this is due to an
increase in random mutations caused by
exposure to radiation.
Locations of
specimen
collection sites,
showing distances
from damaged
nuclear reactors.
(Hiyama et al.,
2012; p. 2)
Top: Normal butterfly.
Bottom: Mutated butterfly with
stunted wings.
Figure 4b from Hiyama et al. (2012; p. 5), showing the relationship
between abnormality rate and ground radiation dose (greater
amounts of radiation are associated with higher mutation rates).
Graph of sample data collected with Avida-ED showing the
abnormality rate and the average number of mutations at
each of four mutation rates.
Mutation Rate
1% 5% 10% 15%
Replicate
#
mutations
#
abnormalities
#
mutations
#
abnormalities
#
mutations
#
abnormalities
#
mutations
#
abnormalities
1 0 0 2 10 3 10 11 10
2 1 1 1 10 1 1 10 7
3 0 0 2 3 4 3 6 3
4 1 0 2 10 5 10 8 10
5 1 10 2 10 2 6 8 10
6 2 6 1 2 2 9 8 10
7 0 0 0 0 5 10 9 10
8 3 0 1 9 4 10 5 10
9 1 0 4 10 6 10 8 10
10 0 0 2 10 4 0 5 10
Avg. #
mutations
Abnormality
rate
Avg. #
mutations
Abnormality
rate
Avg. #
mutations
Abnormality
rate
Avg. #
mutations
Abnormality
rate
0.9 17% 1.7 74% 3.6 69% 7.8 90%
0
1
2
3
4
5
6
7
8
9
10
0%
10%
20%
30%
40%
50%
60%
70%
80%
90%
100%
0% 5% 10% 15% 20%
Average#mutations
Abnormalityrate(%)
Mutation rate
Abnormality rate
Average mutations
Digitally modeling a biological system. The
exercise models the case study by asking students
to replicate individual digital organisms at four
levels of mutation rate—these serve as a proxy for
distance from a source of radiation. Students begin
with an ancestor that can perform 10 basic
functions. After replication, the number of mutations
in the offspring and the number of abnormalities
(functions lost) are recorded. A sample data table is
shown at left.
Visit our website for more information on the Avida-ED project and to download FREE software and lesson
materials, including this exercise. http://avida-ed.msu.edu

Modeling evolution in the classroom: The case of Fukushima’s mutant butterflies

  • 1.
    Modeling Evolution inthe Classroom: The case of Fukushima’s mutant butterflies Amy Lark1,2, Gail Richmond1, and Robert T. Pennock2 Michigan State University Department of Teacher Education1, BEACON Center for the Study of Evolution in Action2 EDUCATION NGSS Dimension Specific aspect of dimension applicable to exercise Science and Engineering Practices Analyzing and Interpreting Data Engaging in Argument from Evidence Using Mathematics and Computational Thinking Constructing Explanations and Designing Solutions Obtaining, Evaluating, and Communicating Information Developing and Using Models Planning and Carrying Out Investigations Disciplinary Core Ideas LS1.A: Structure and Function LS3.A: Inheritance of Traits LS3.B: Variation of Traits LS4.B: Natural Selection LS4.C: Adaptation LS4.D: Biodiversity and Humans ETS1.B: Developing Possible Solutions Crosscutting Concepts Cause and Effect Scale, Proportion, and Quantity Patterns Ancestor genome wzcagcccccccccccccccccccccccccccccccccccczvfcaxgab Offspring genome (inviable) wzyagcccccccoccccccqcccvpcccqcctcccccccmczvfcaxgrb Science education in the United States is evolving. New standards and reform recommendations spanning grades K-16 focus on a limited set of key scientific concepts from each discipline that all students should know but emphasize integrating these with science practices so that students learn not only the “what” of science but also the “how” and “why”. In line with this approach, we present an exercise that models the integration of fundamental evolutionary concepts with science practices. Students use Avida-ED digital evolution software to test claims from a study on mutated butterflies in the vicinity of the compromised Fukushima Daiichi Nuclear Power Plant complex subsequent to the Great East Japan Earthquake of 2011 (Hiyama et al., Scientific Reports 2 Article 570, 2012) to determine the effects of mutation rate on the genomes of individual organisms. A real, observable instance of evolution in action. Populations of digital organisms genuinely evolve via Darwinian mechanisms. Random mutations occur as individual organisms replicate resulting in variation that is subject to selection as organisms compete for resources in a digital environment. An opportunity for student engagement in authentic science practices. Students can ask questions, develop hypotheses, design and conduct experiments, collect and analyze data, and engage in argumentation from evidence. See table below for a list of concepts and practices applicable to this exercise. A model for biological evolution. Evolving populations of digital organisms show the same general patterns found in biological systems (see data table and graphs at right as examples). Ancestor organism genome and resultant offspring genome after replication at a 15% mutation rate. Mutated instructions in green. The Next Generation Science Standards (NGSS) serve as a guide and illustrate the extent to which the exercise draws from and integrates key ideas and science practices. Although the NGSS are written for K-12, the concepts and practices listed in the table remain relevant for students at the undergraduate level, particularly those in introductory biology courses. Fukushima’s mutant butterflies. Populations of pale grass blue butterflies (Zizeeria maha) were exposed to radiation leaked from the damaged Fukushima Daiichi Nuclear Power Plant complex in the wake of the Great East Japan Earthquake of 2011. Butterflies collected from locations at varying distances from the plant showed a number of physiological abnormalities, with butterflies collected closer to the plant showing a significantly greater number of abnormalities. The authors claim that this is due to an increase in random mutations caused by exposure to radiation. Locations of specimen collection sites, showing distances from damaged nuclear reactors. (Hiyama et al., 2012; p. 2) Top: Normal butterfly. Bottom: Mutated butterfly with stunted wings. Figure 4b from Hiyama et al. (2012; p. 5), showing the relationship between abnormality rate and ground radiation dose (greater amounts of radiation are associated with higher mutation rates). Graph of sample data collected with Avida-ED showing the abnormality rate and the average number of mutations at each of four mutation rates. Mutation Rate 1% 5% 10% 15% Replicate # mutations # abnormalities # mutations # abnormalities # mutations # abnormalities # mutations # abnormalities 1 0 0 2 10 3 10 11 10 2 1 1 1 10 1 1 10 7 3 0 0 2 3 4 3 6 3 4 1 0 2 10 5 10 8 10 5 1 10 2 10 2 6 8 10 6 2 6 1 2 2 9 8 10 7 0 0 0 0 5 10 9 10 8 3 0 1 9 4 10 5 10 9 1 0 4 10 6 10 8 10 10 0 0 2 10 4 0 5 10 Avg. # mutations Abnormality rate Avg. # mutations Abnormality rate Avg. # mutations Abnormality rate Avg. # mutations Abnormality rate 0.9 17% 1.7 74% 3.6 69% 7.8 90% 0 1 2 3 4 5 6 7 8 9 10 0% 10% 20% 30% 40% 50% 60% 70% 80% 90% 100% 0% 5% 10% 15% 20% Average#mutations Abnormalityrate(%) Mutation rate Abnormality rate Average mutations Digitally modeling a biological system. The exercise models the case study by asking students to replicate individual digital organisms at four levels of mutation rate—these serve as a proxy for distance from a source of radiation. Students begin with an ancestor that can perform 10 basic functions. After replication, the number of mutations in the offspring and the number of abnormalities (functions lost) are recorded. A sample data table is shown at left. Visit our website for more information on the Avida-ED project and to download FREE software and lesson materials, including this exercise. http://avida-ed.msu.edu