Downloaded 13 times


![Abstract
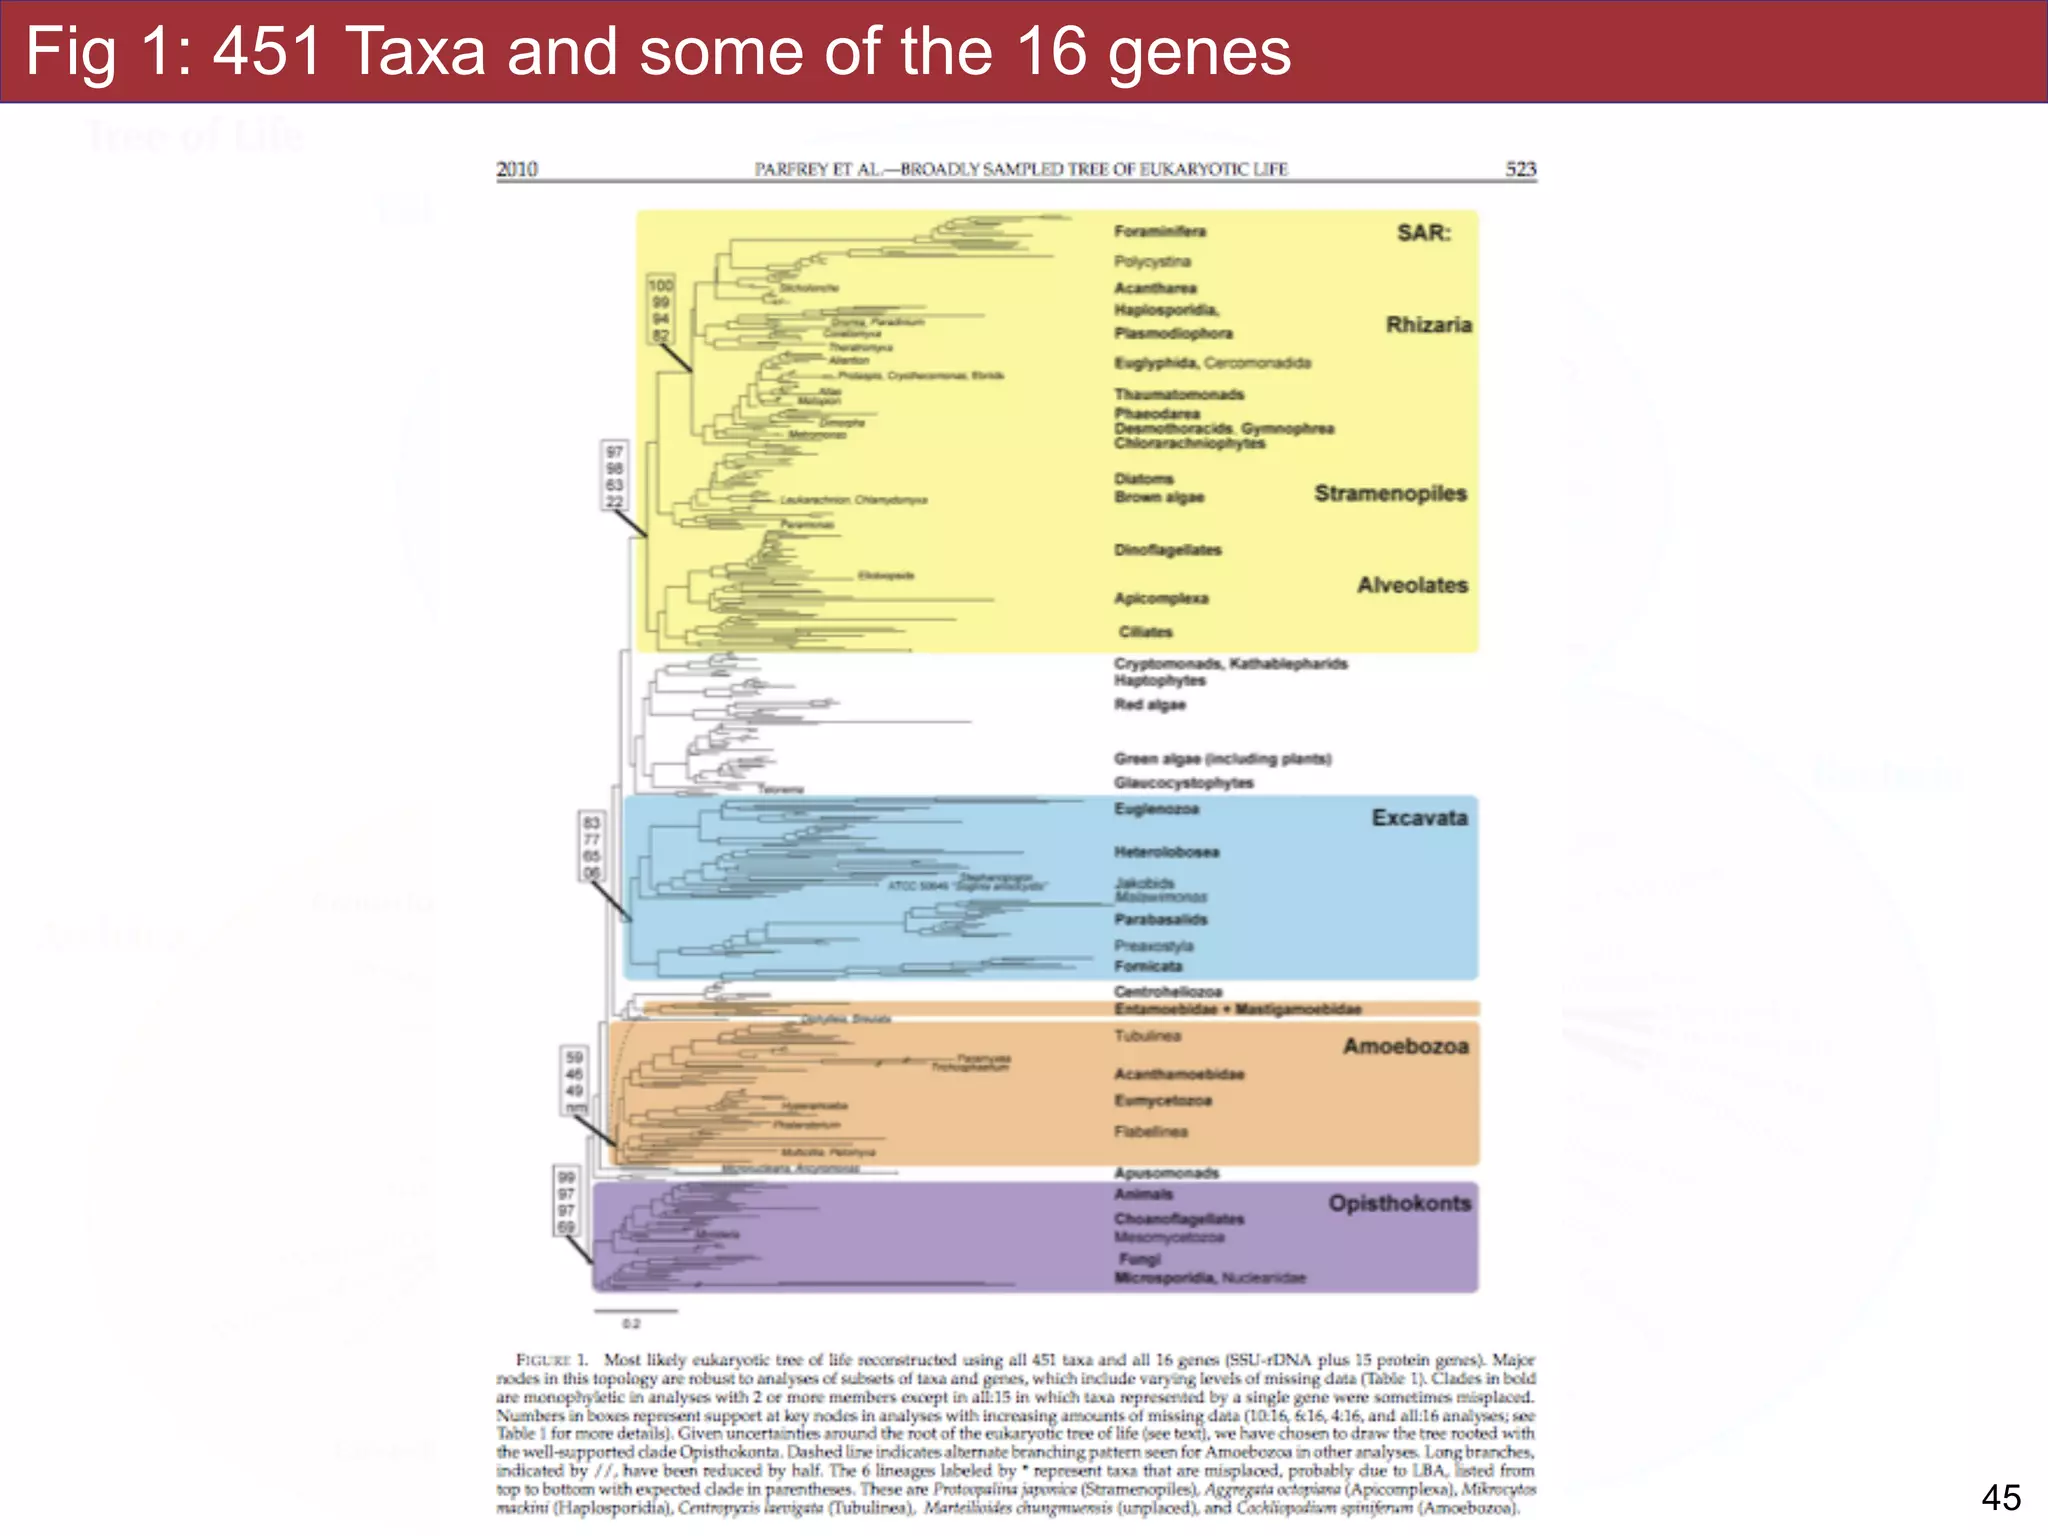
An accurate reconstruction of the eukaryotic tree of life is essential to identify the
innovations underlying the diversity of microbial and macroscopic (e.g., plants and animals)
eukaryotes. Previous work has divided eukaryotic diversity into a small number of high-level
“supergroups,” many of which receive strong support in phylogenomic analyses. However,
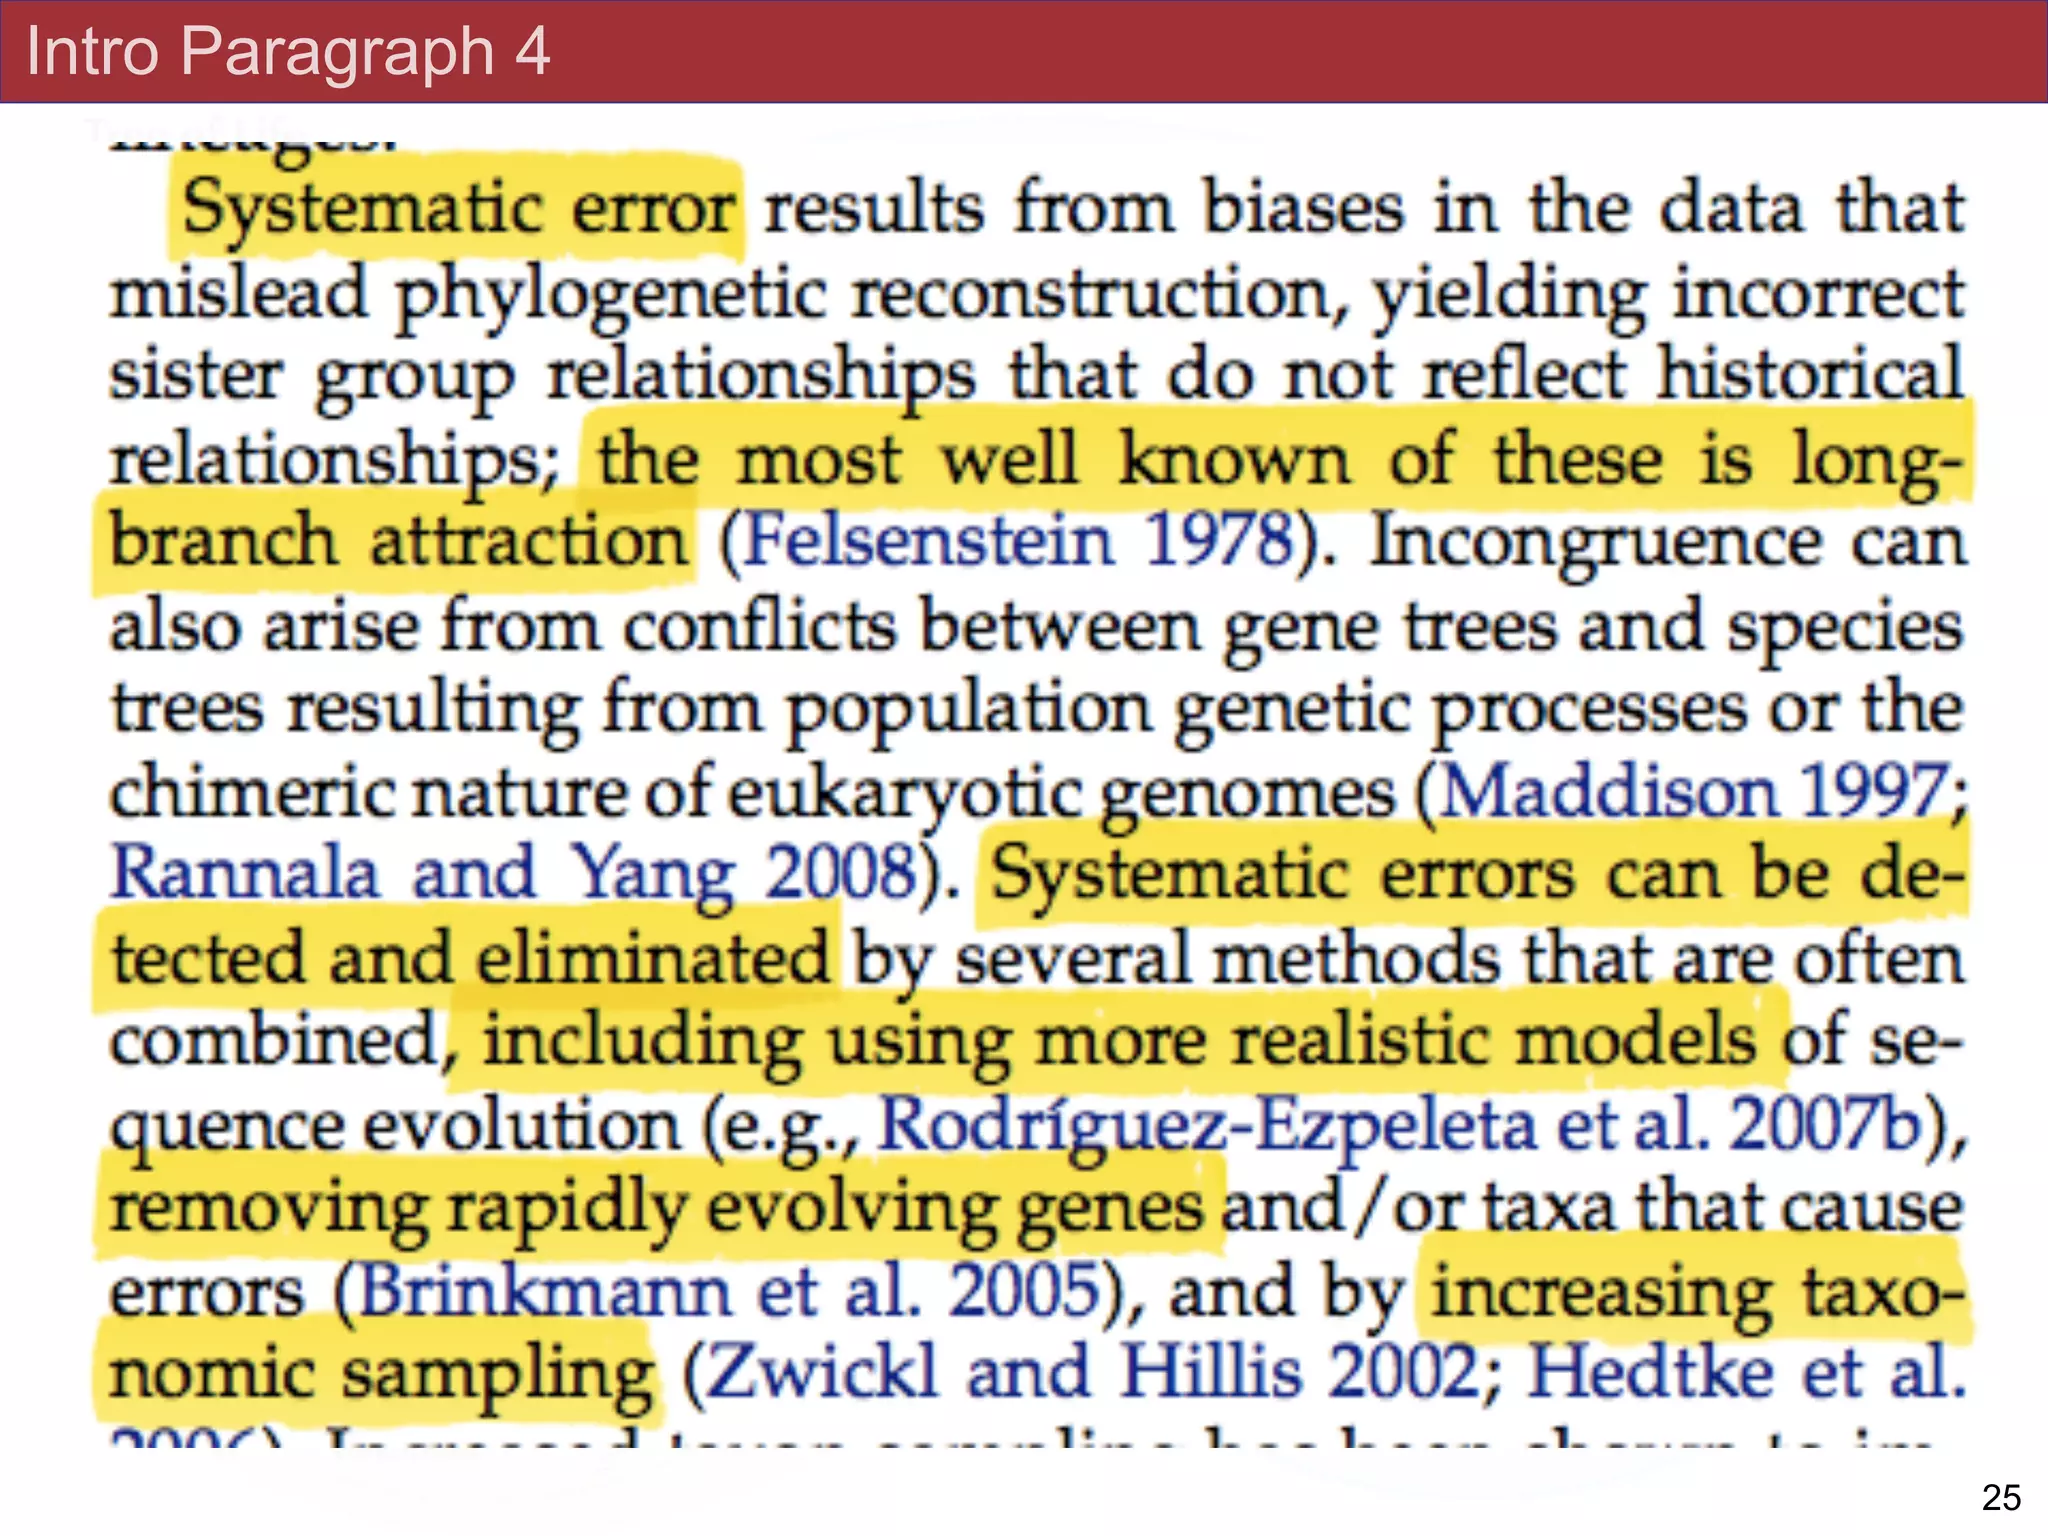
the abundance of data in phylogenomic analyses can lead to highly supported but incorrect
relationships due to systematic phylogenetic error. Furthermore, the paucity of major
eukaryotic lineages (19 or fewer) included in these genomic studies may exaggerate
systematic error and reduce power to evaluate hypotheses. Here, we use a taxon-rich
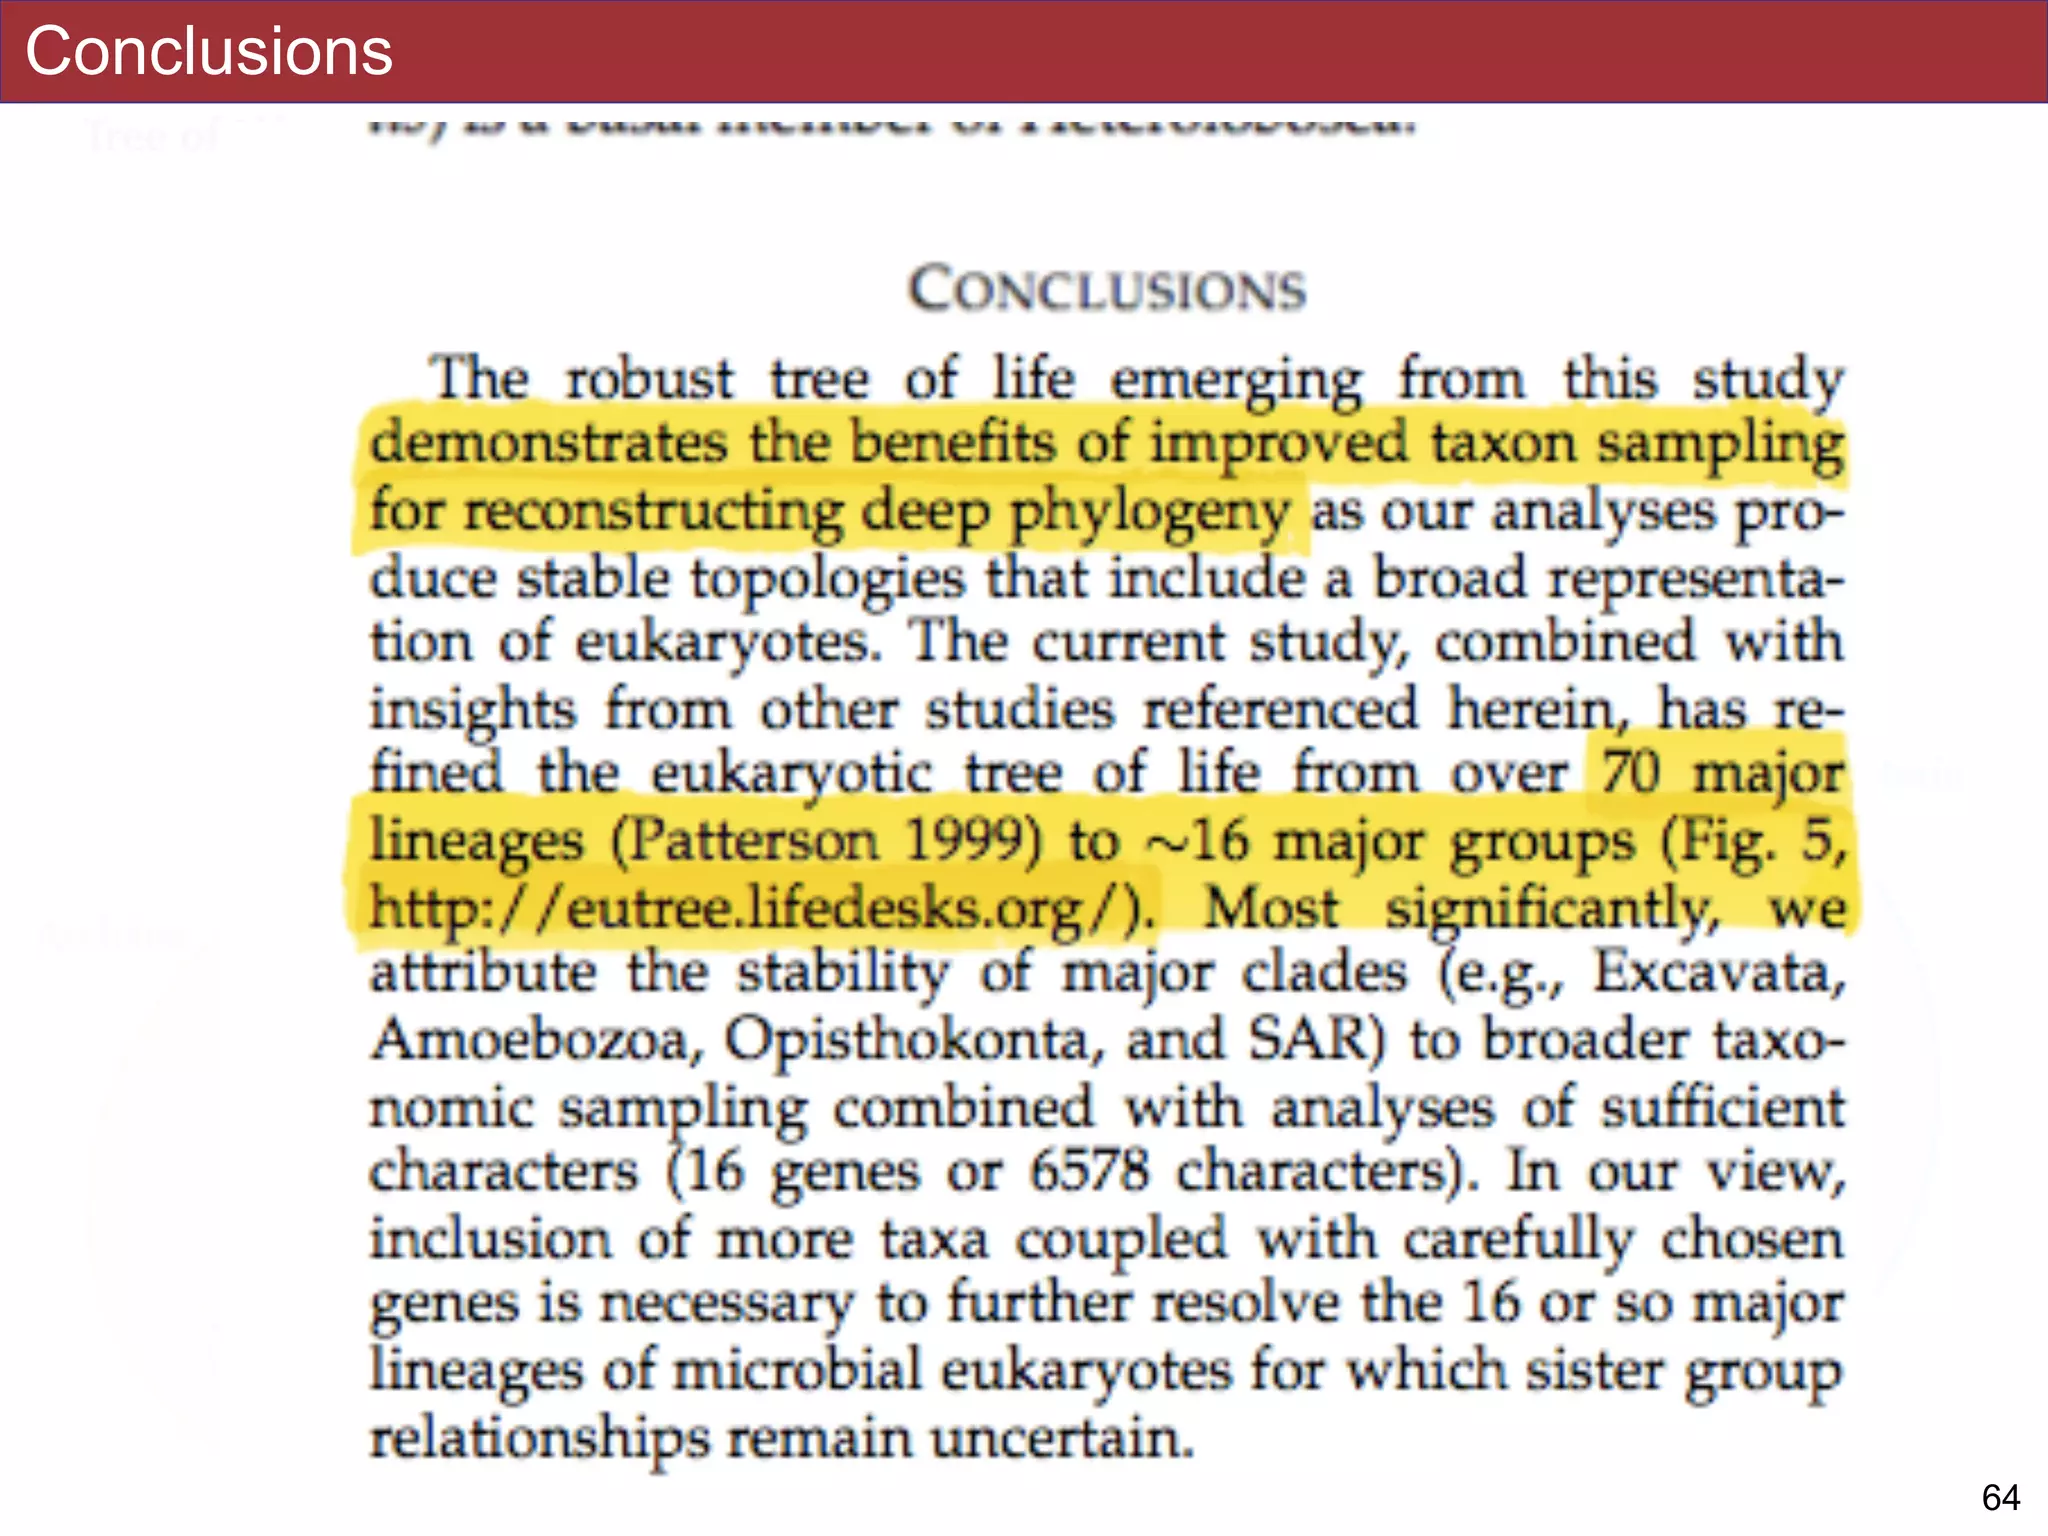
strategy to assess eukaryotic relationships. We show that analyses emphasizing broad
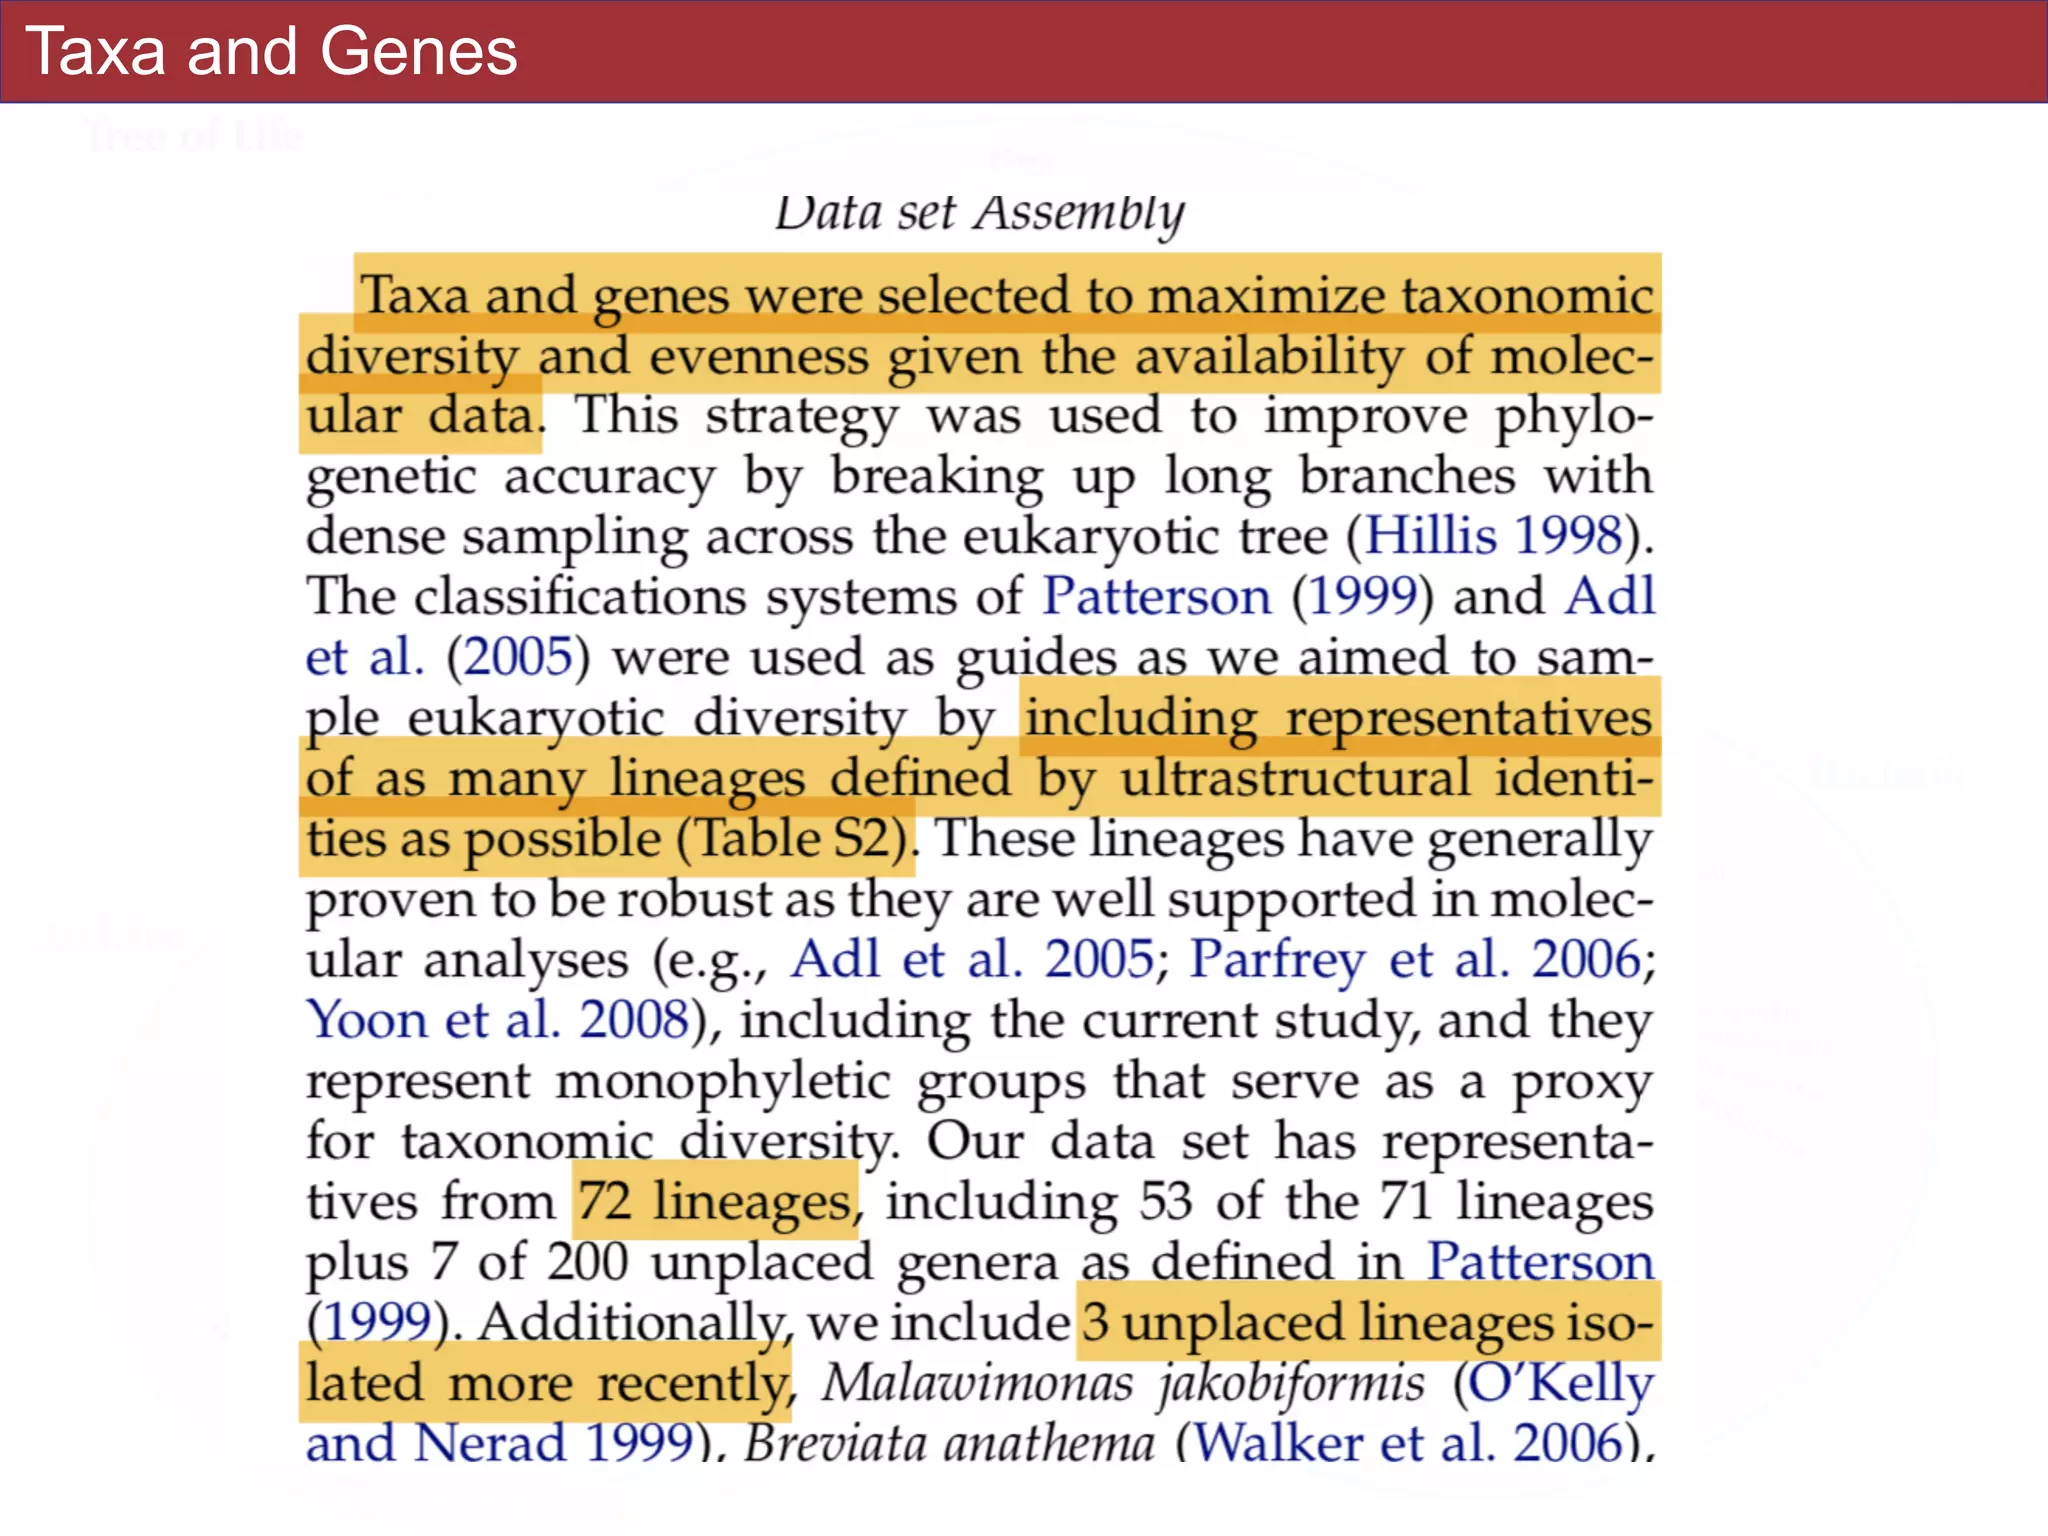
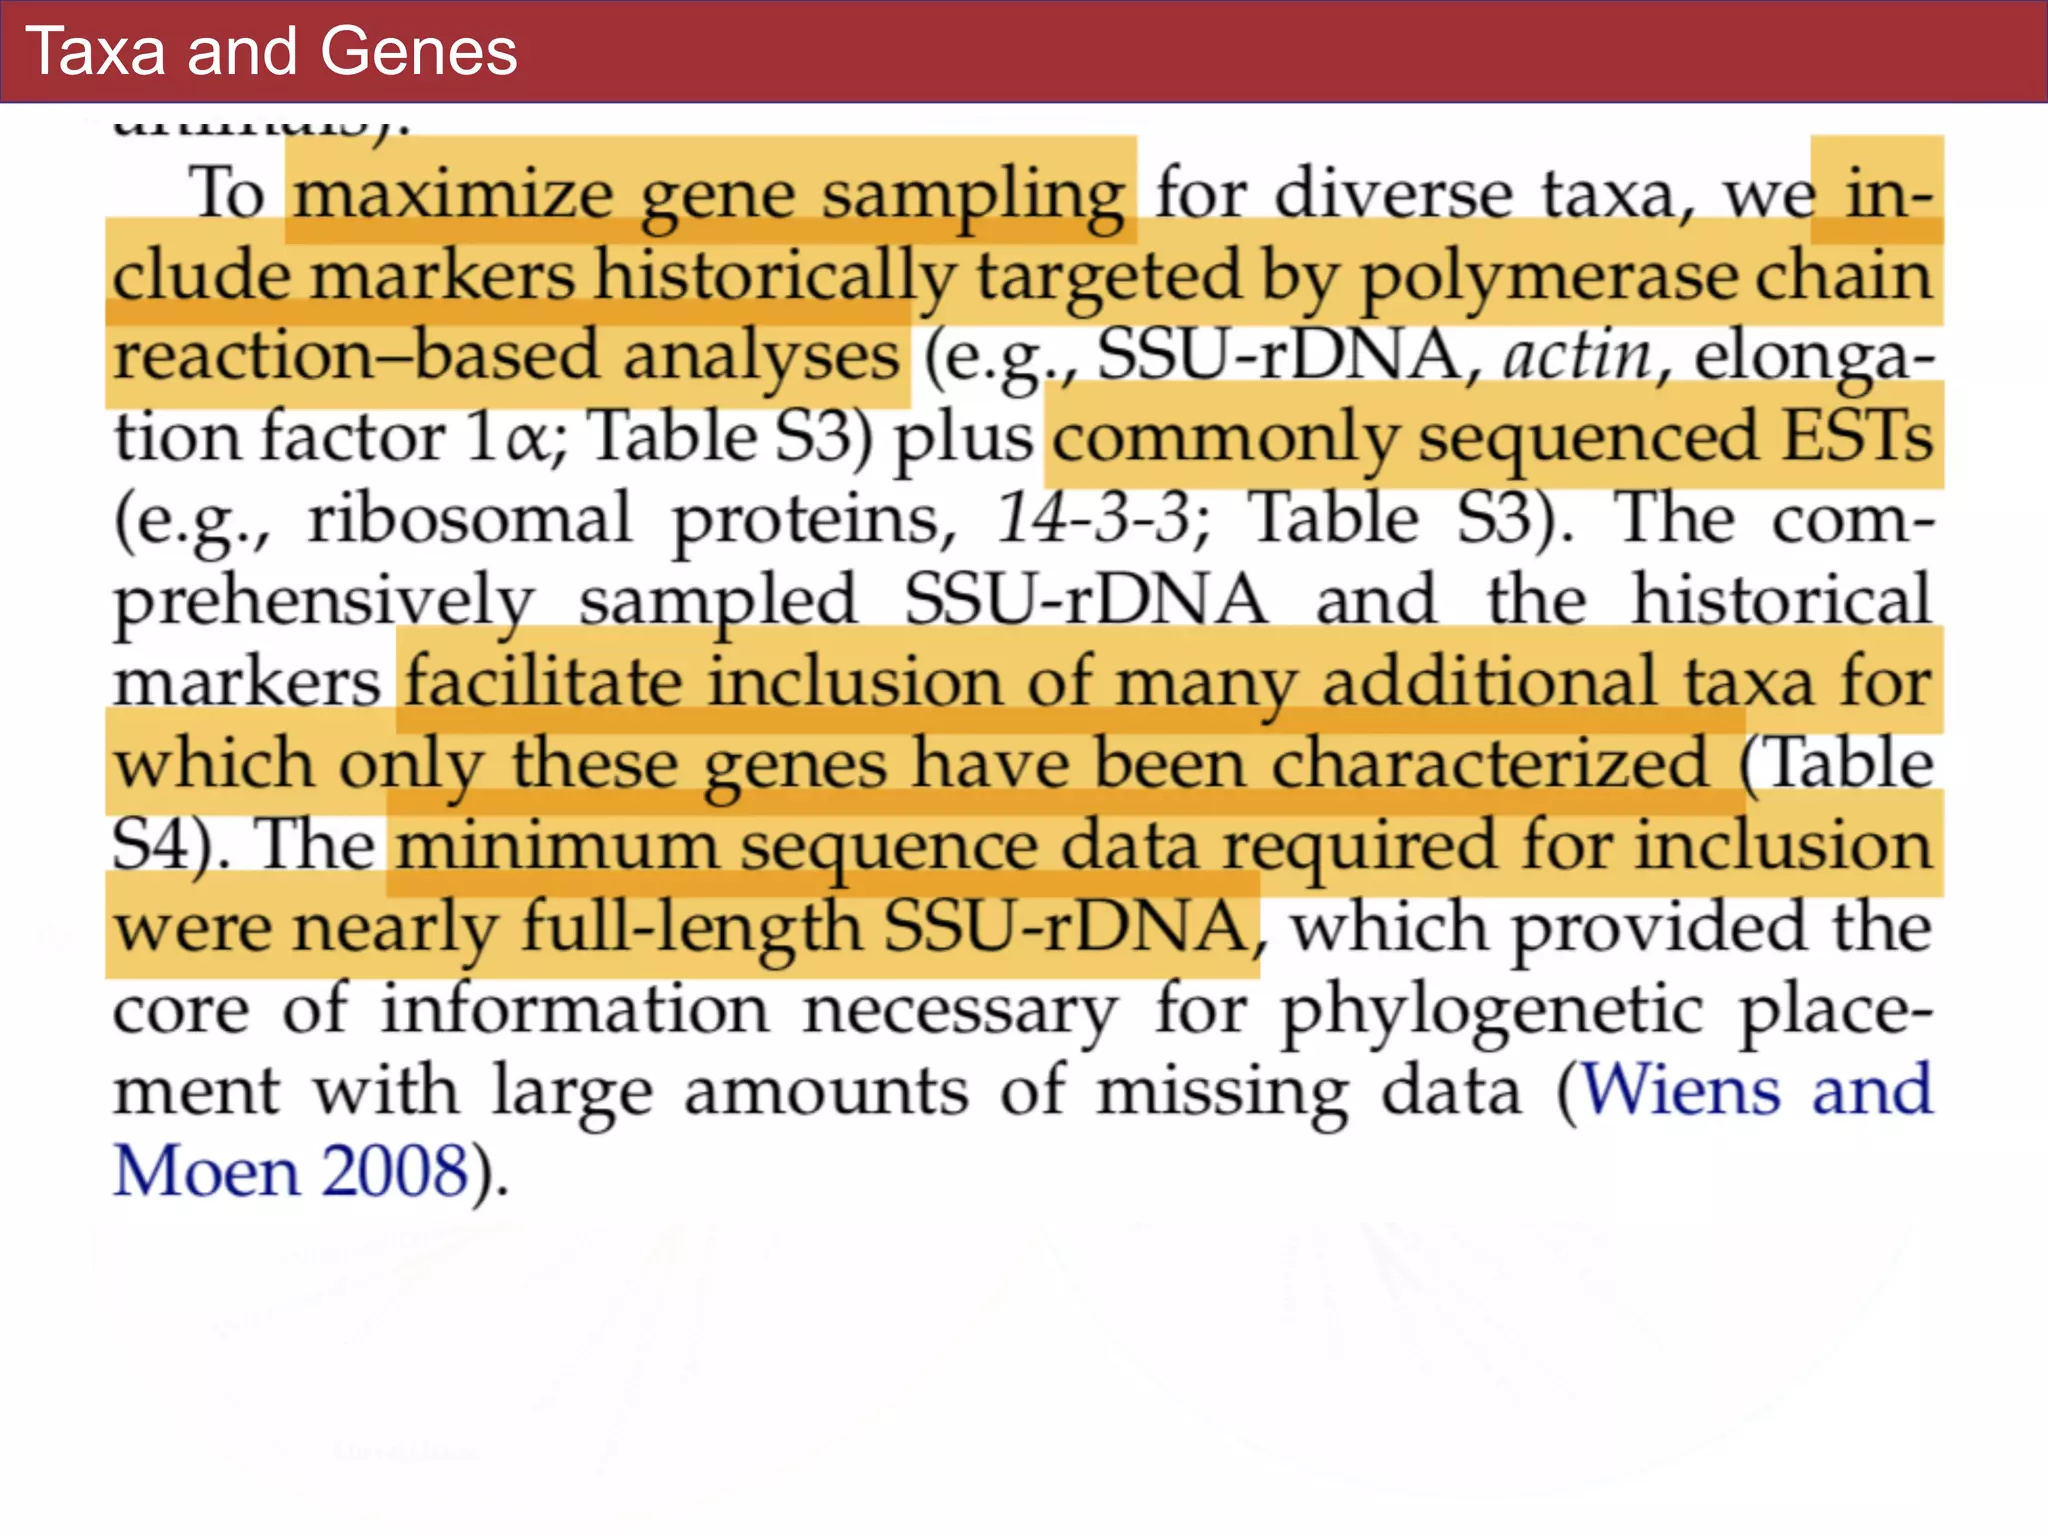
taxonomic sampling (up to 451 taxa representing 72 major lineages) combined with a
moderate number of genes yield a well-resolved eukaryotic tree of life. The consistency
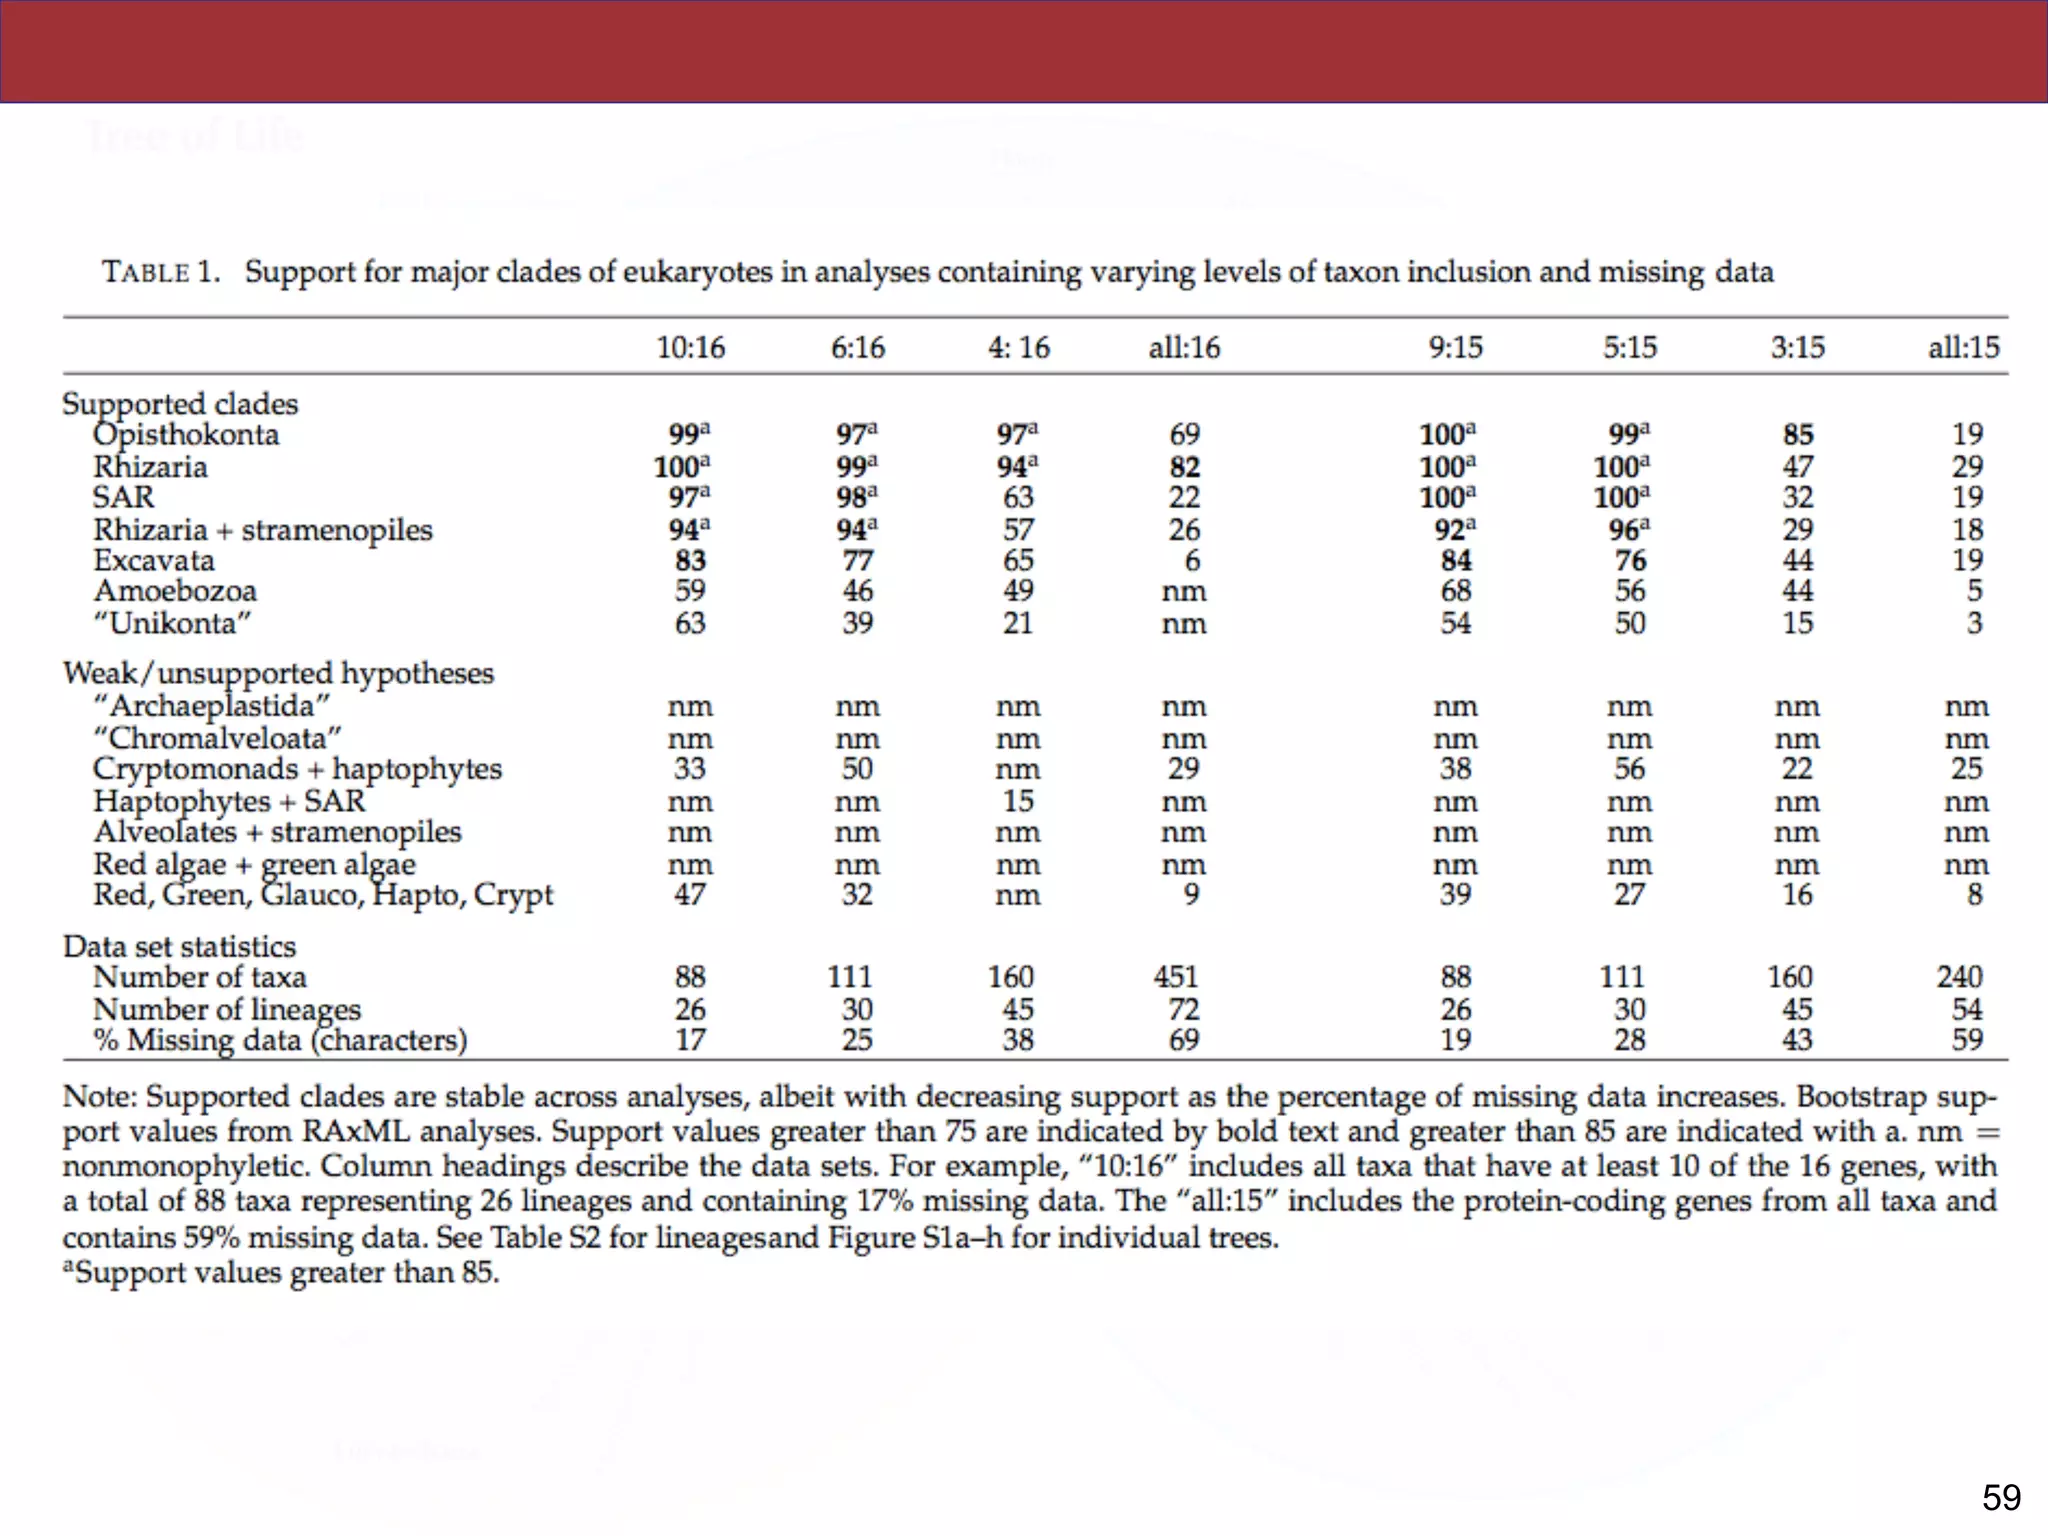
across analyses with varying numbers of taxa (88–451) and levels of missing data (17–69%)
supports the accuracy of the resulting topologies. The resulting stable topology emerges
without the removal of rapidly evolving genes or taxa, a practice common to phylogenomic
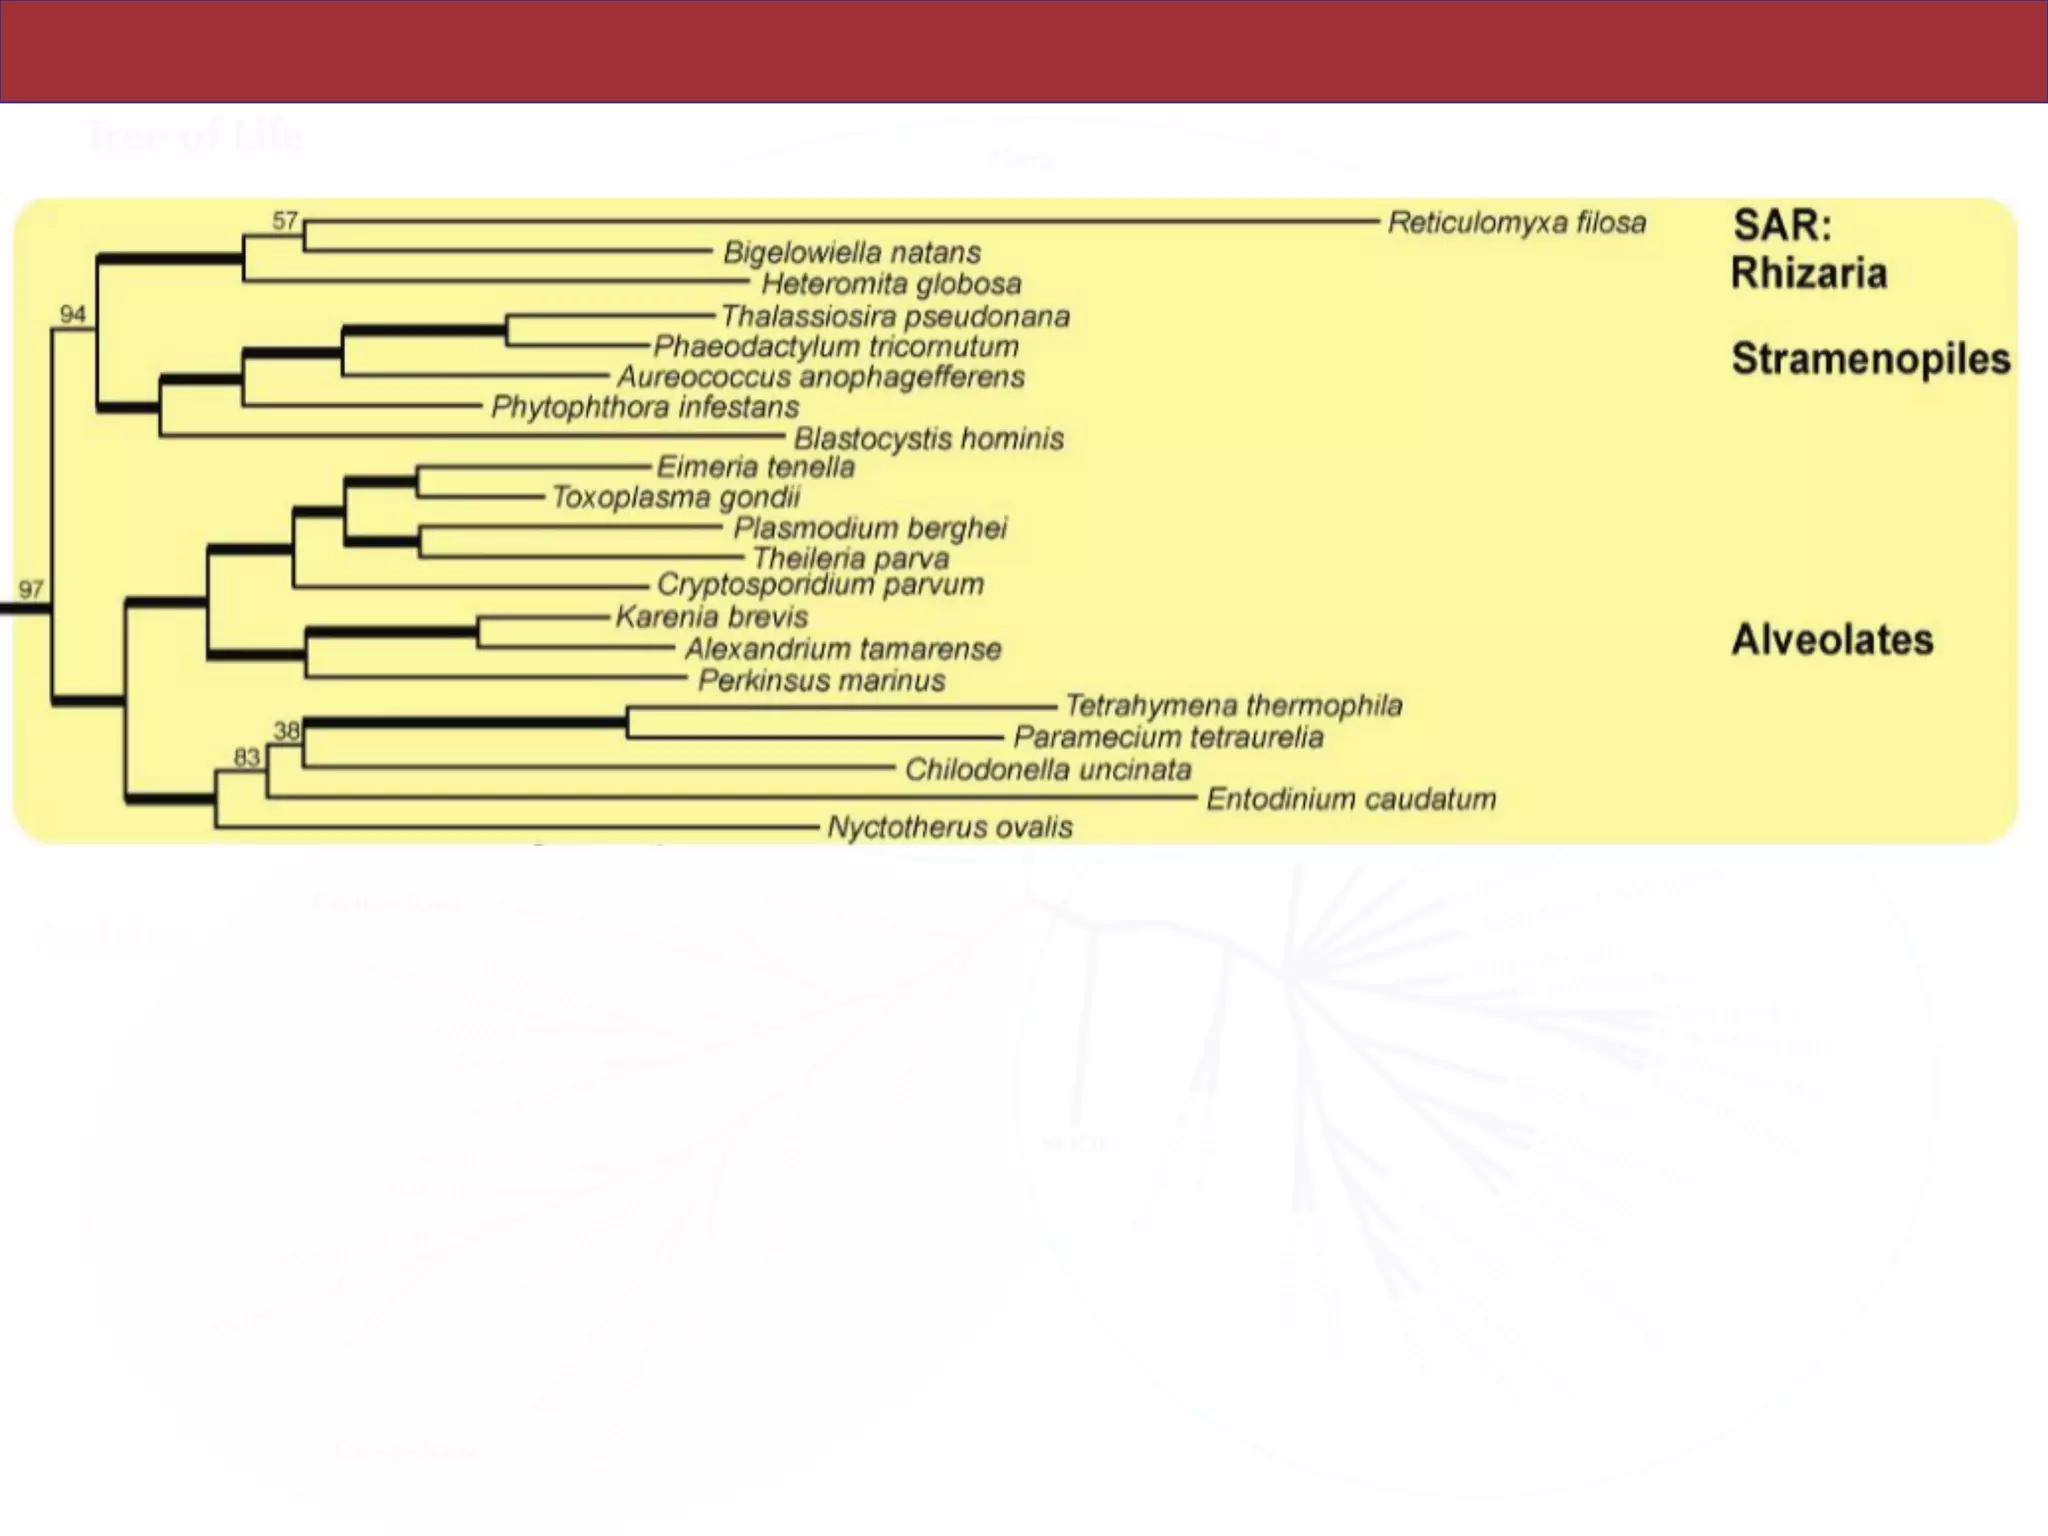
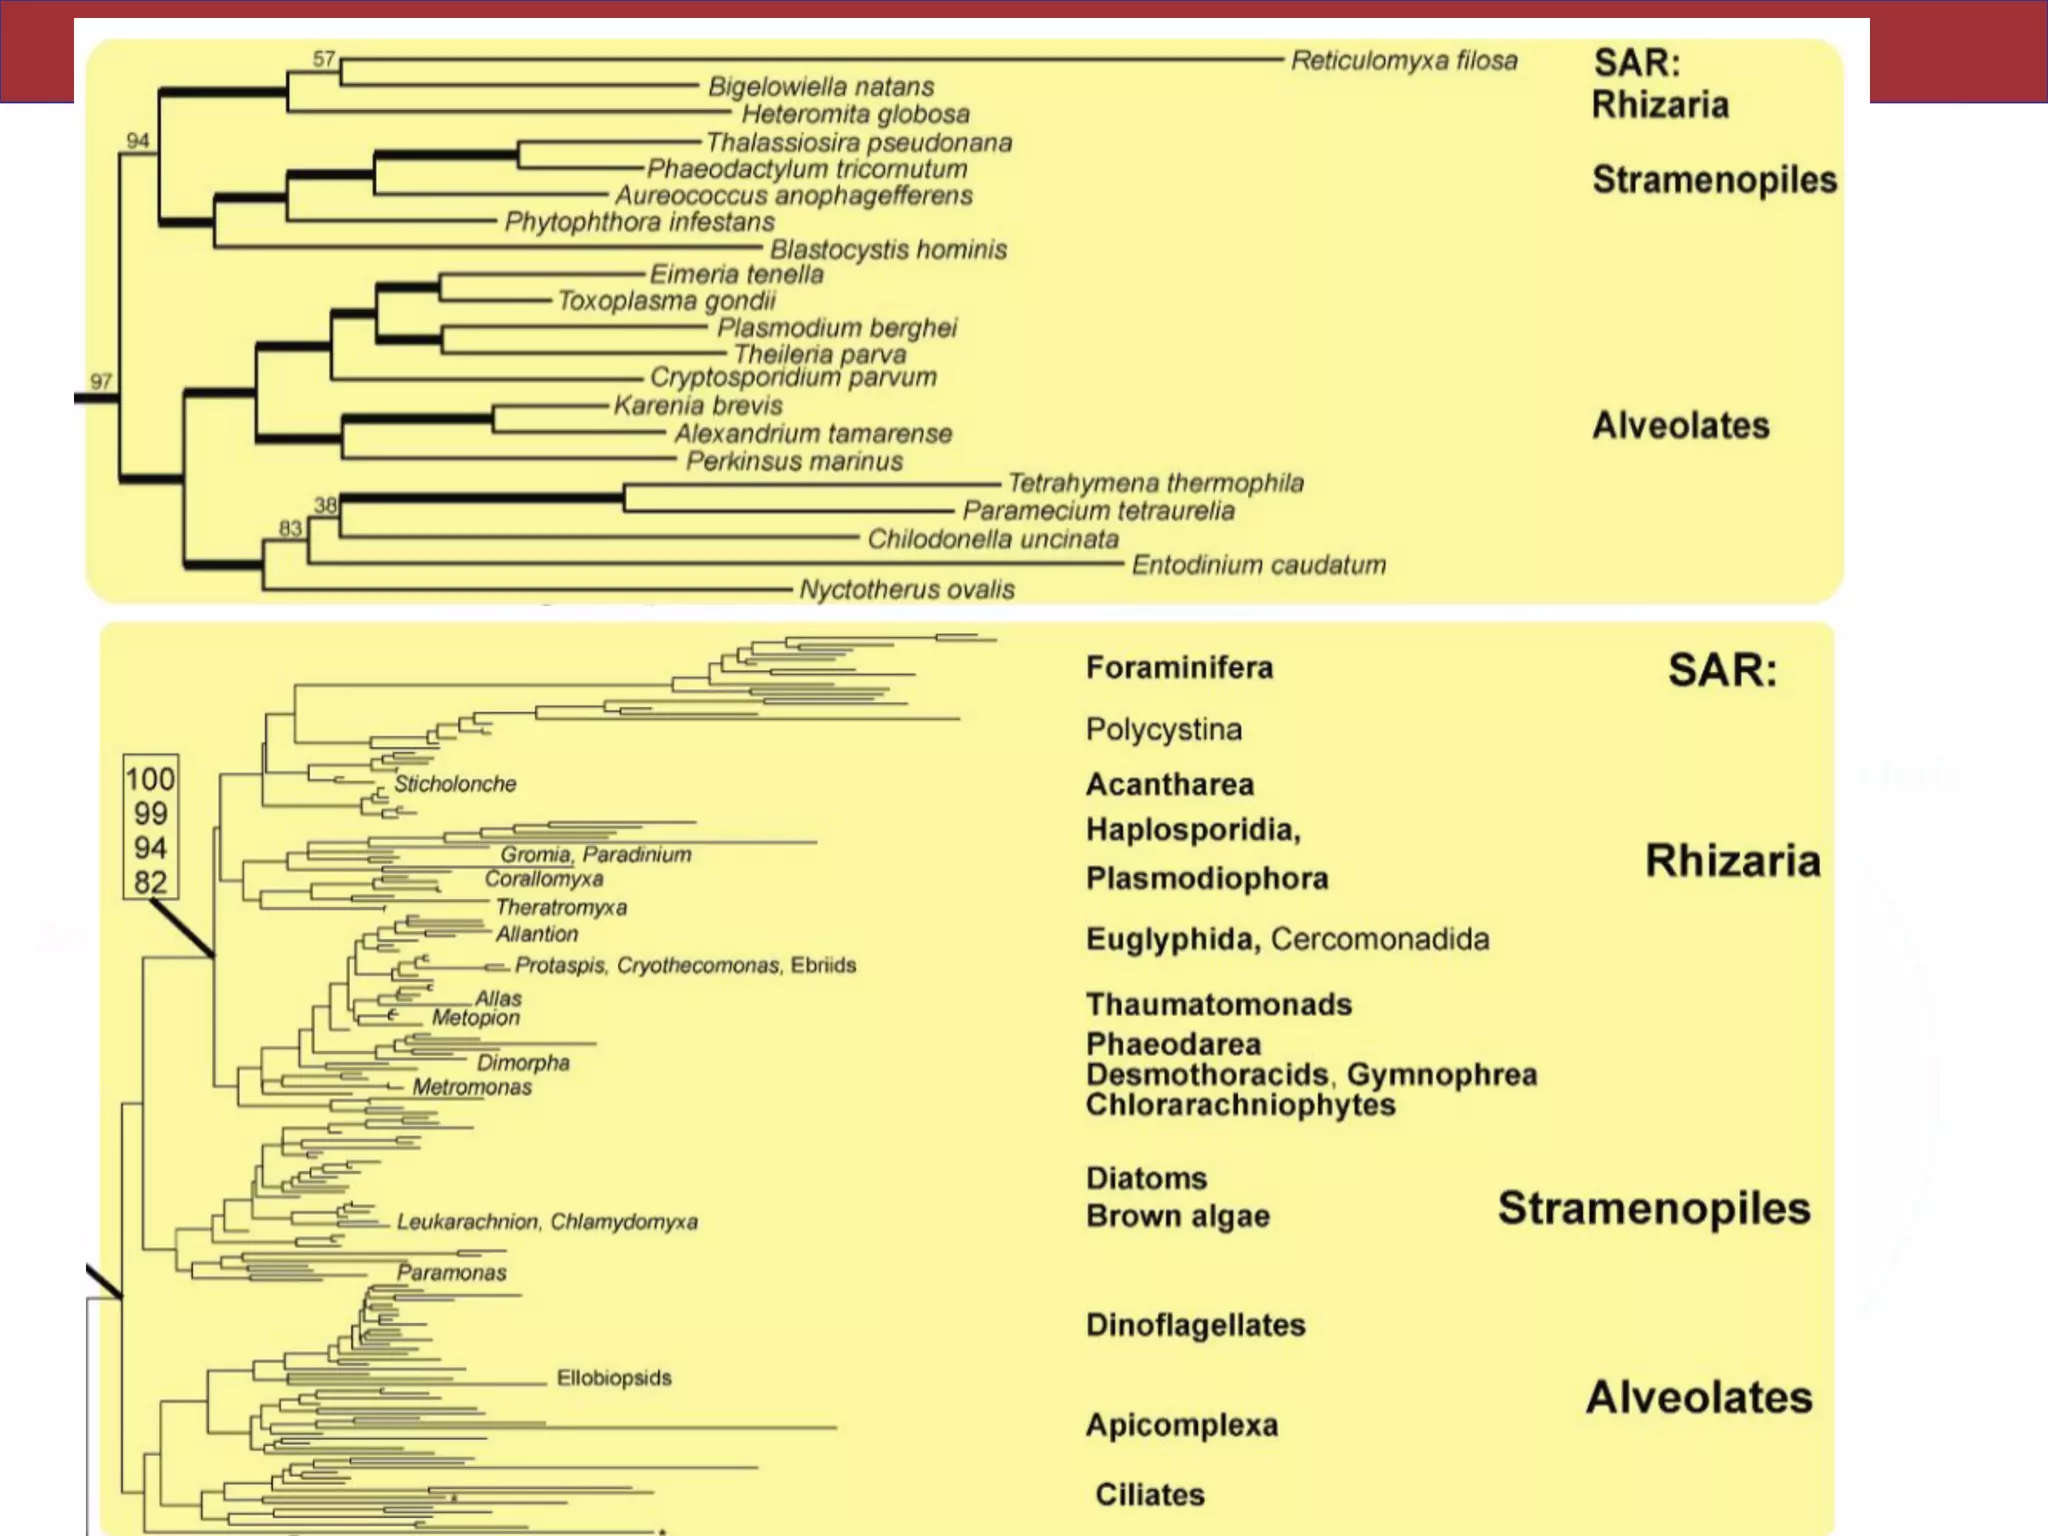
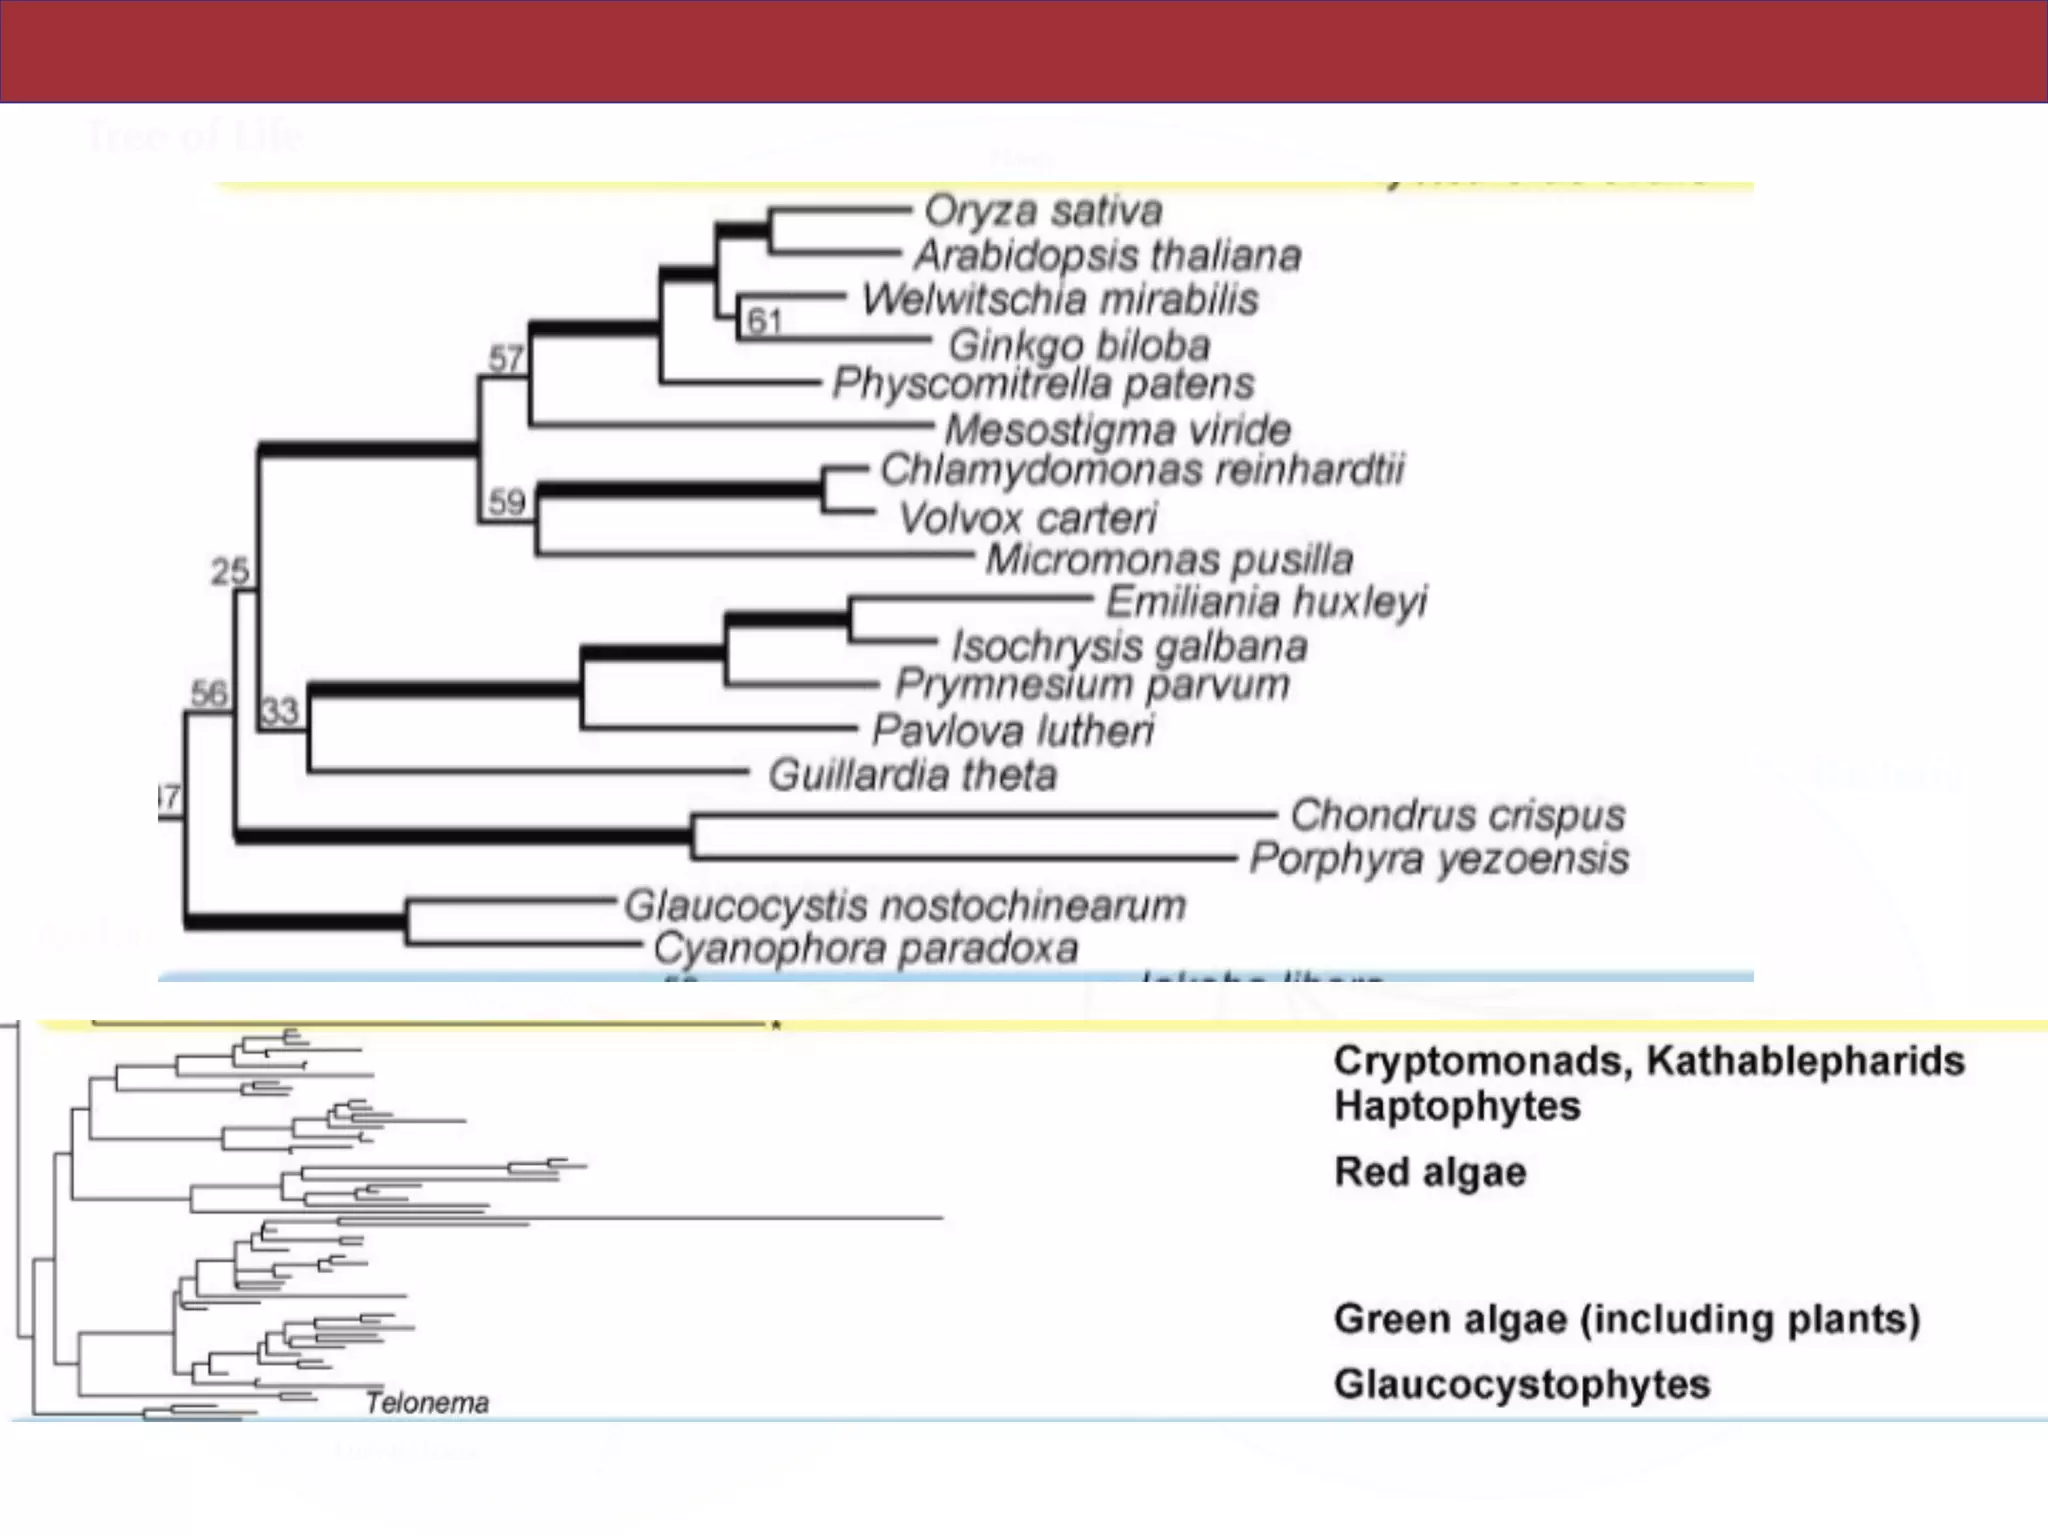
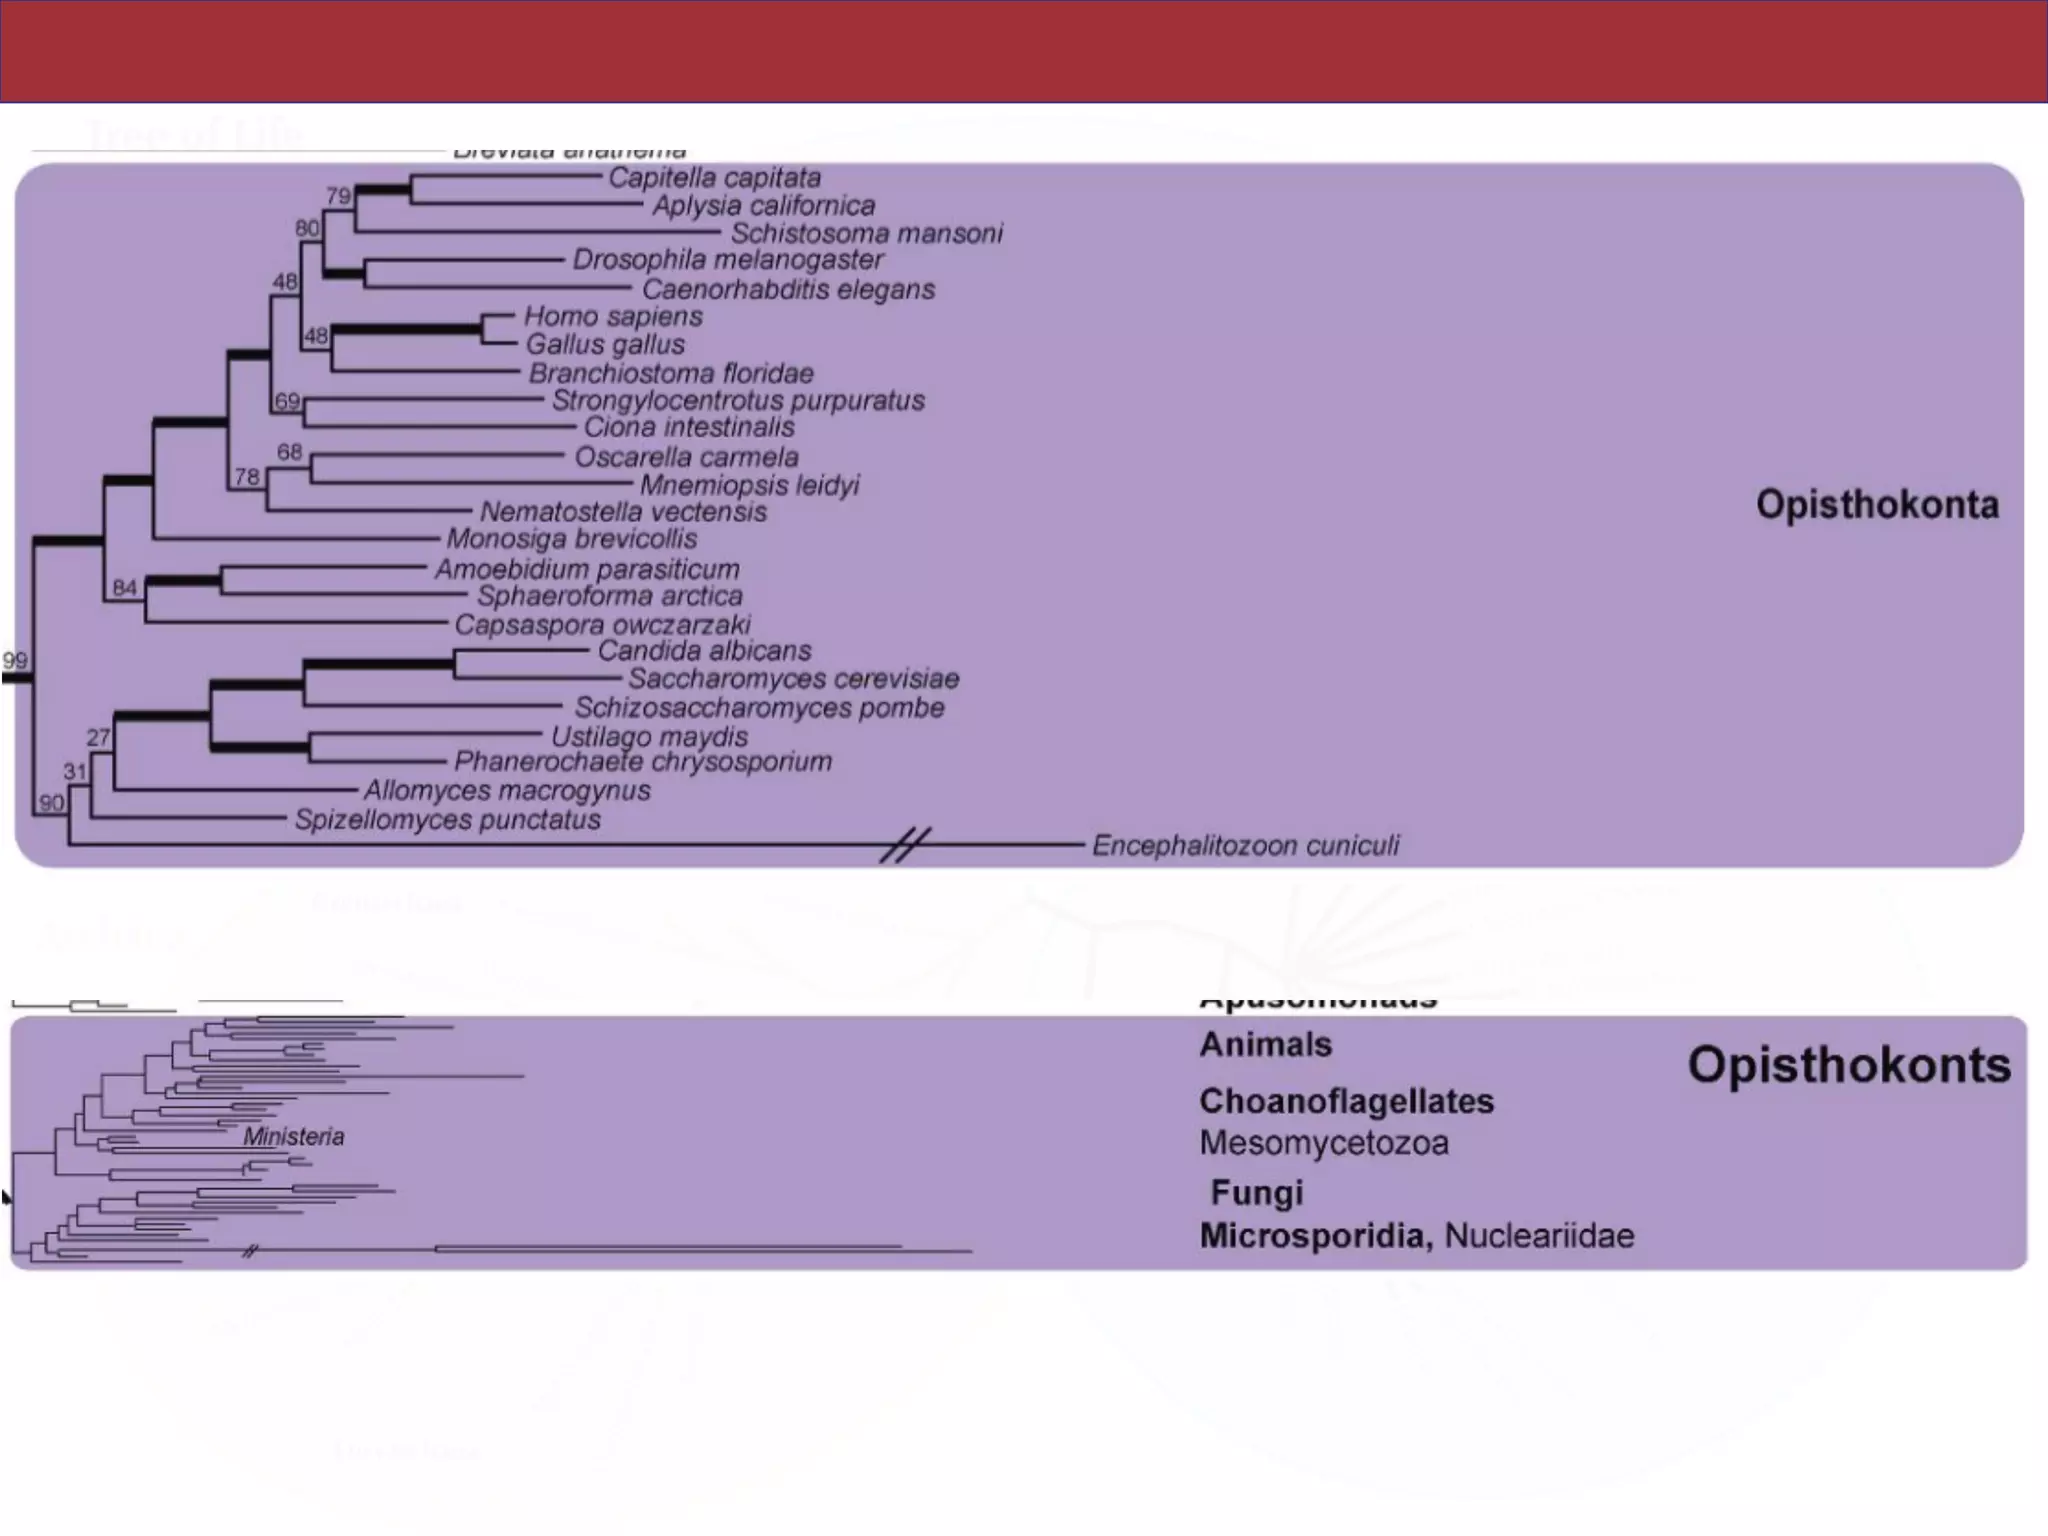
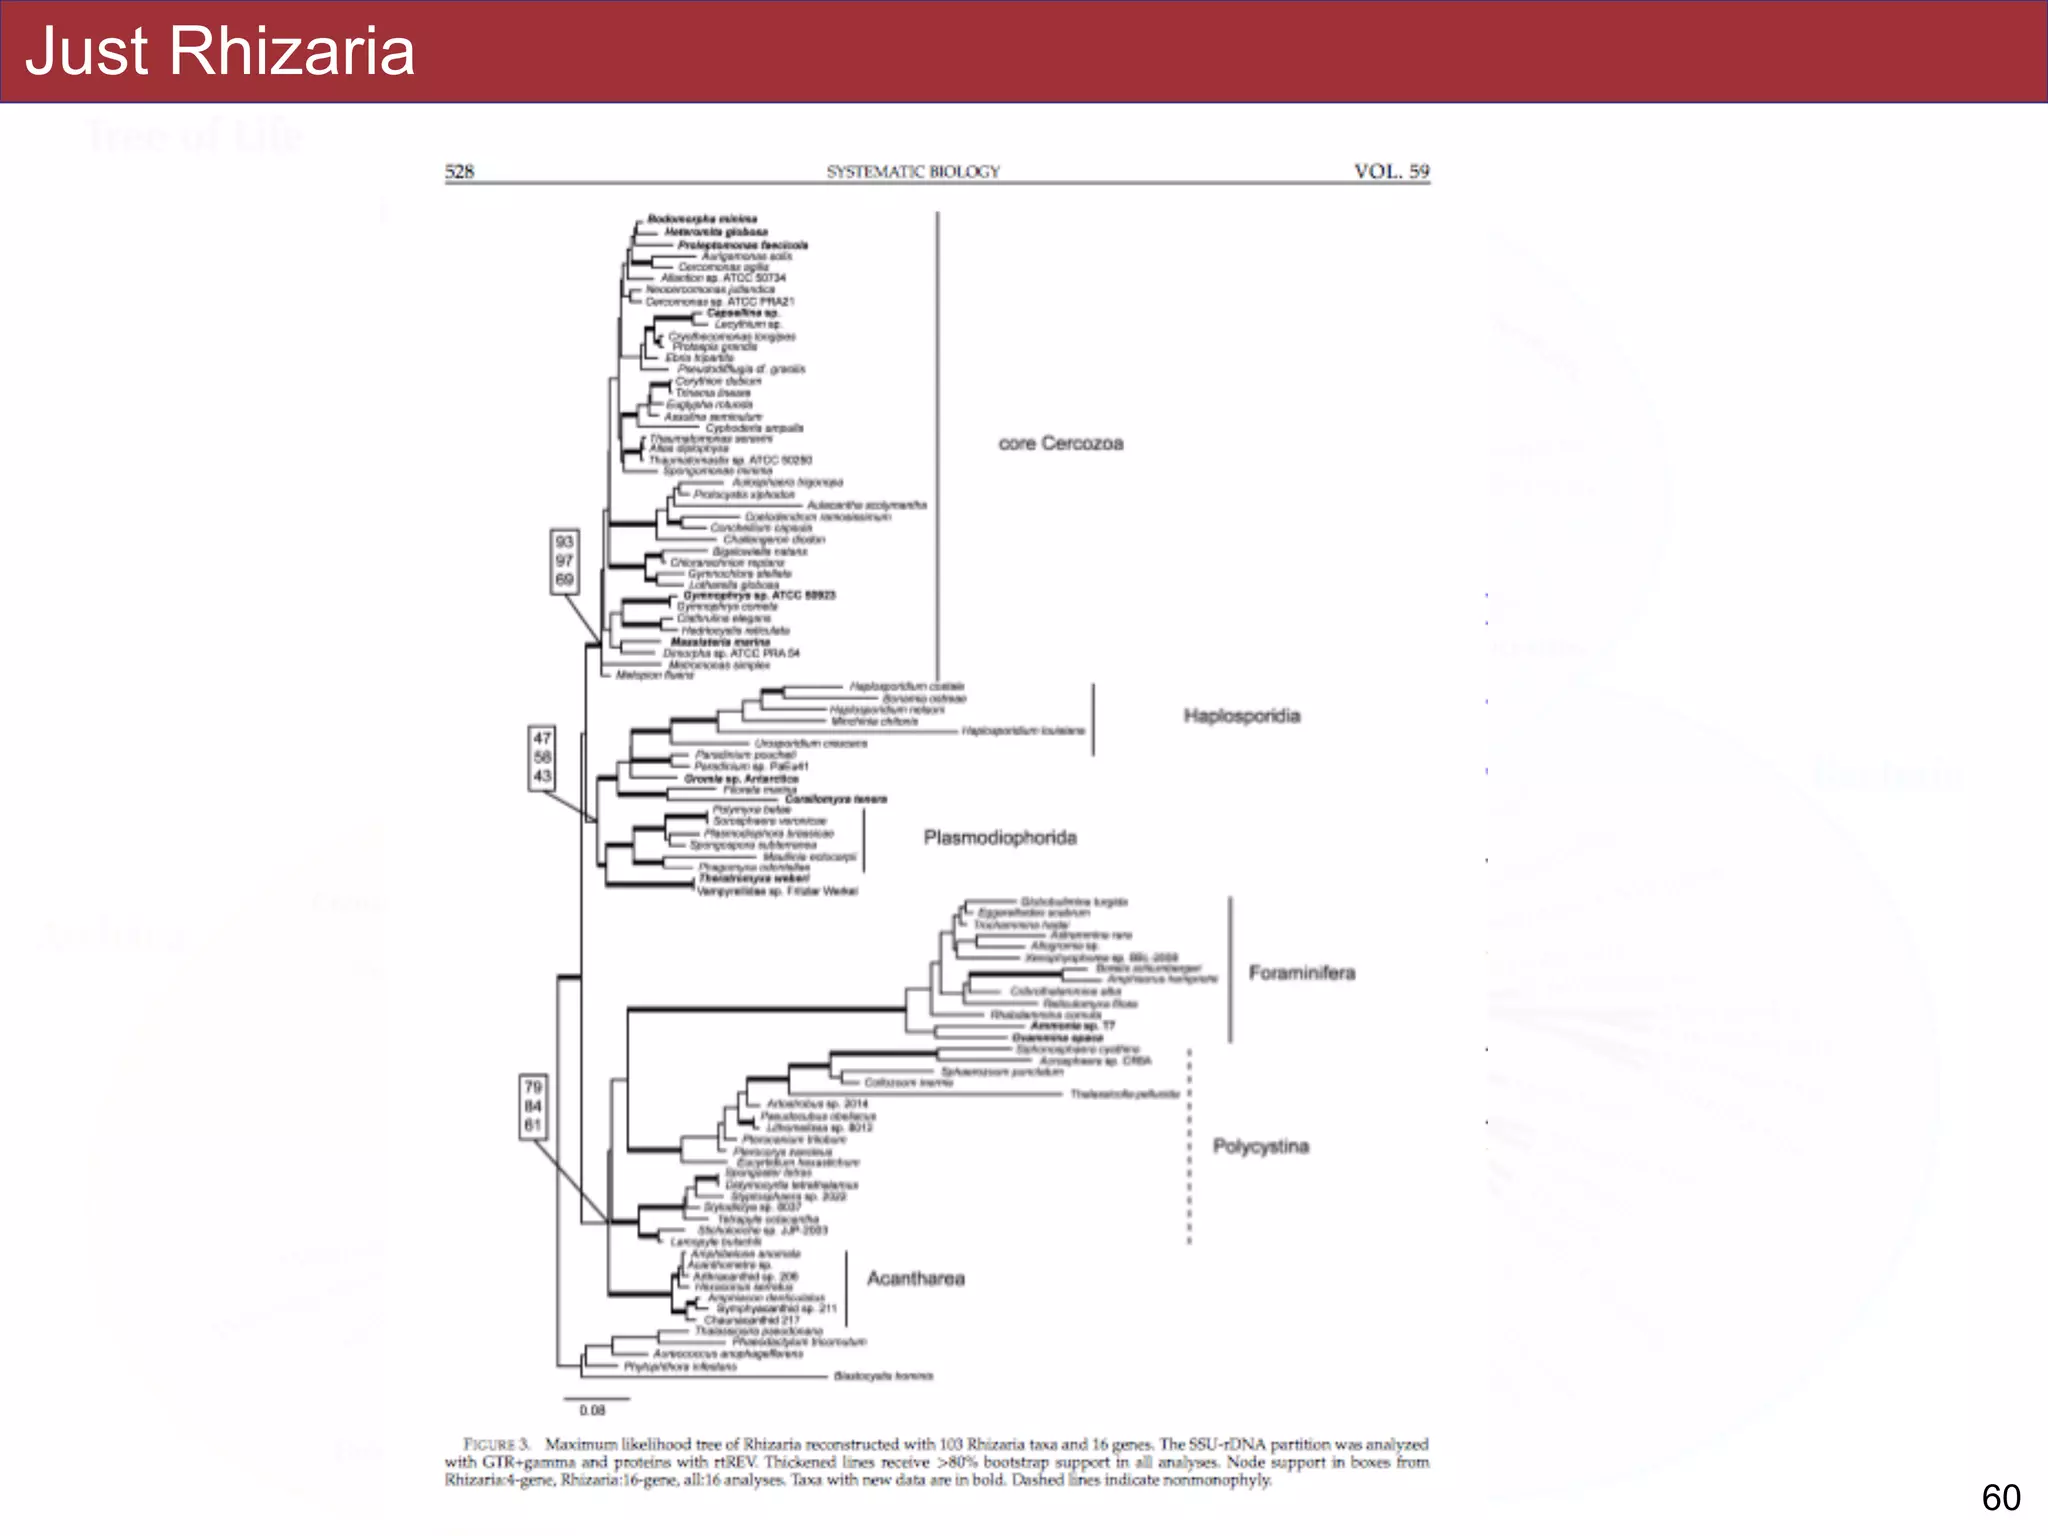
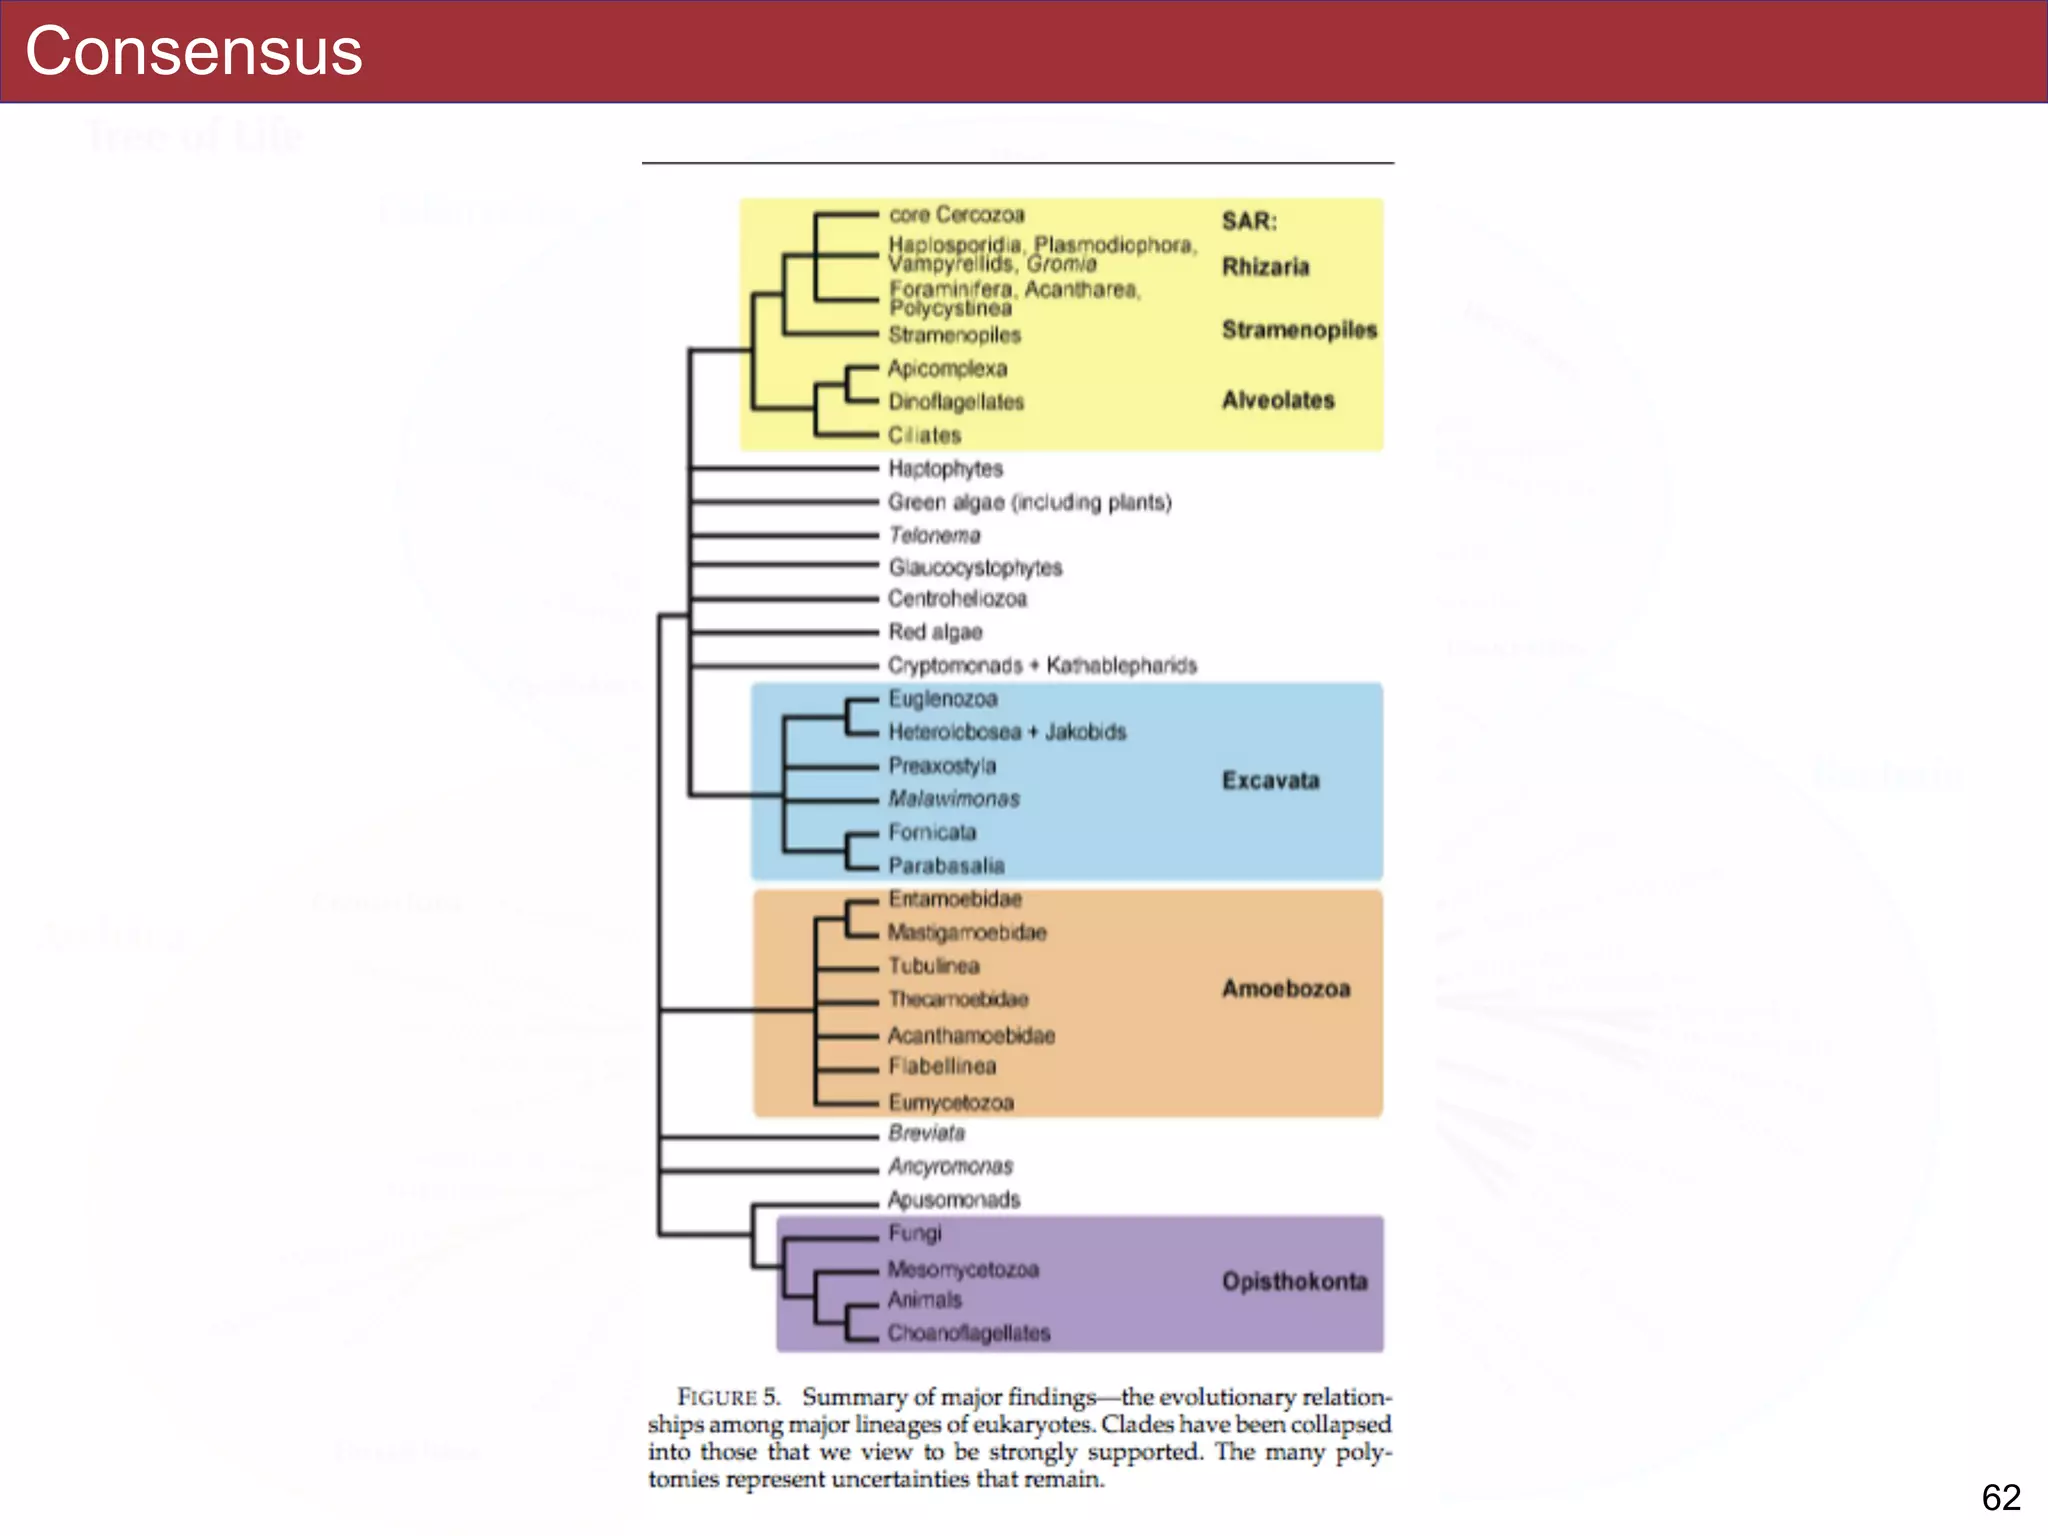
analyses. Several major groups are stable and strongly supported in these analyses (e.g.,
SAR, Rhizaria, Excavata), whereas the proposed supergroup “Chromalveolata” is rejected.
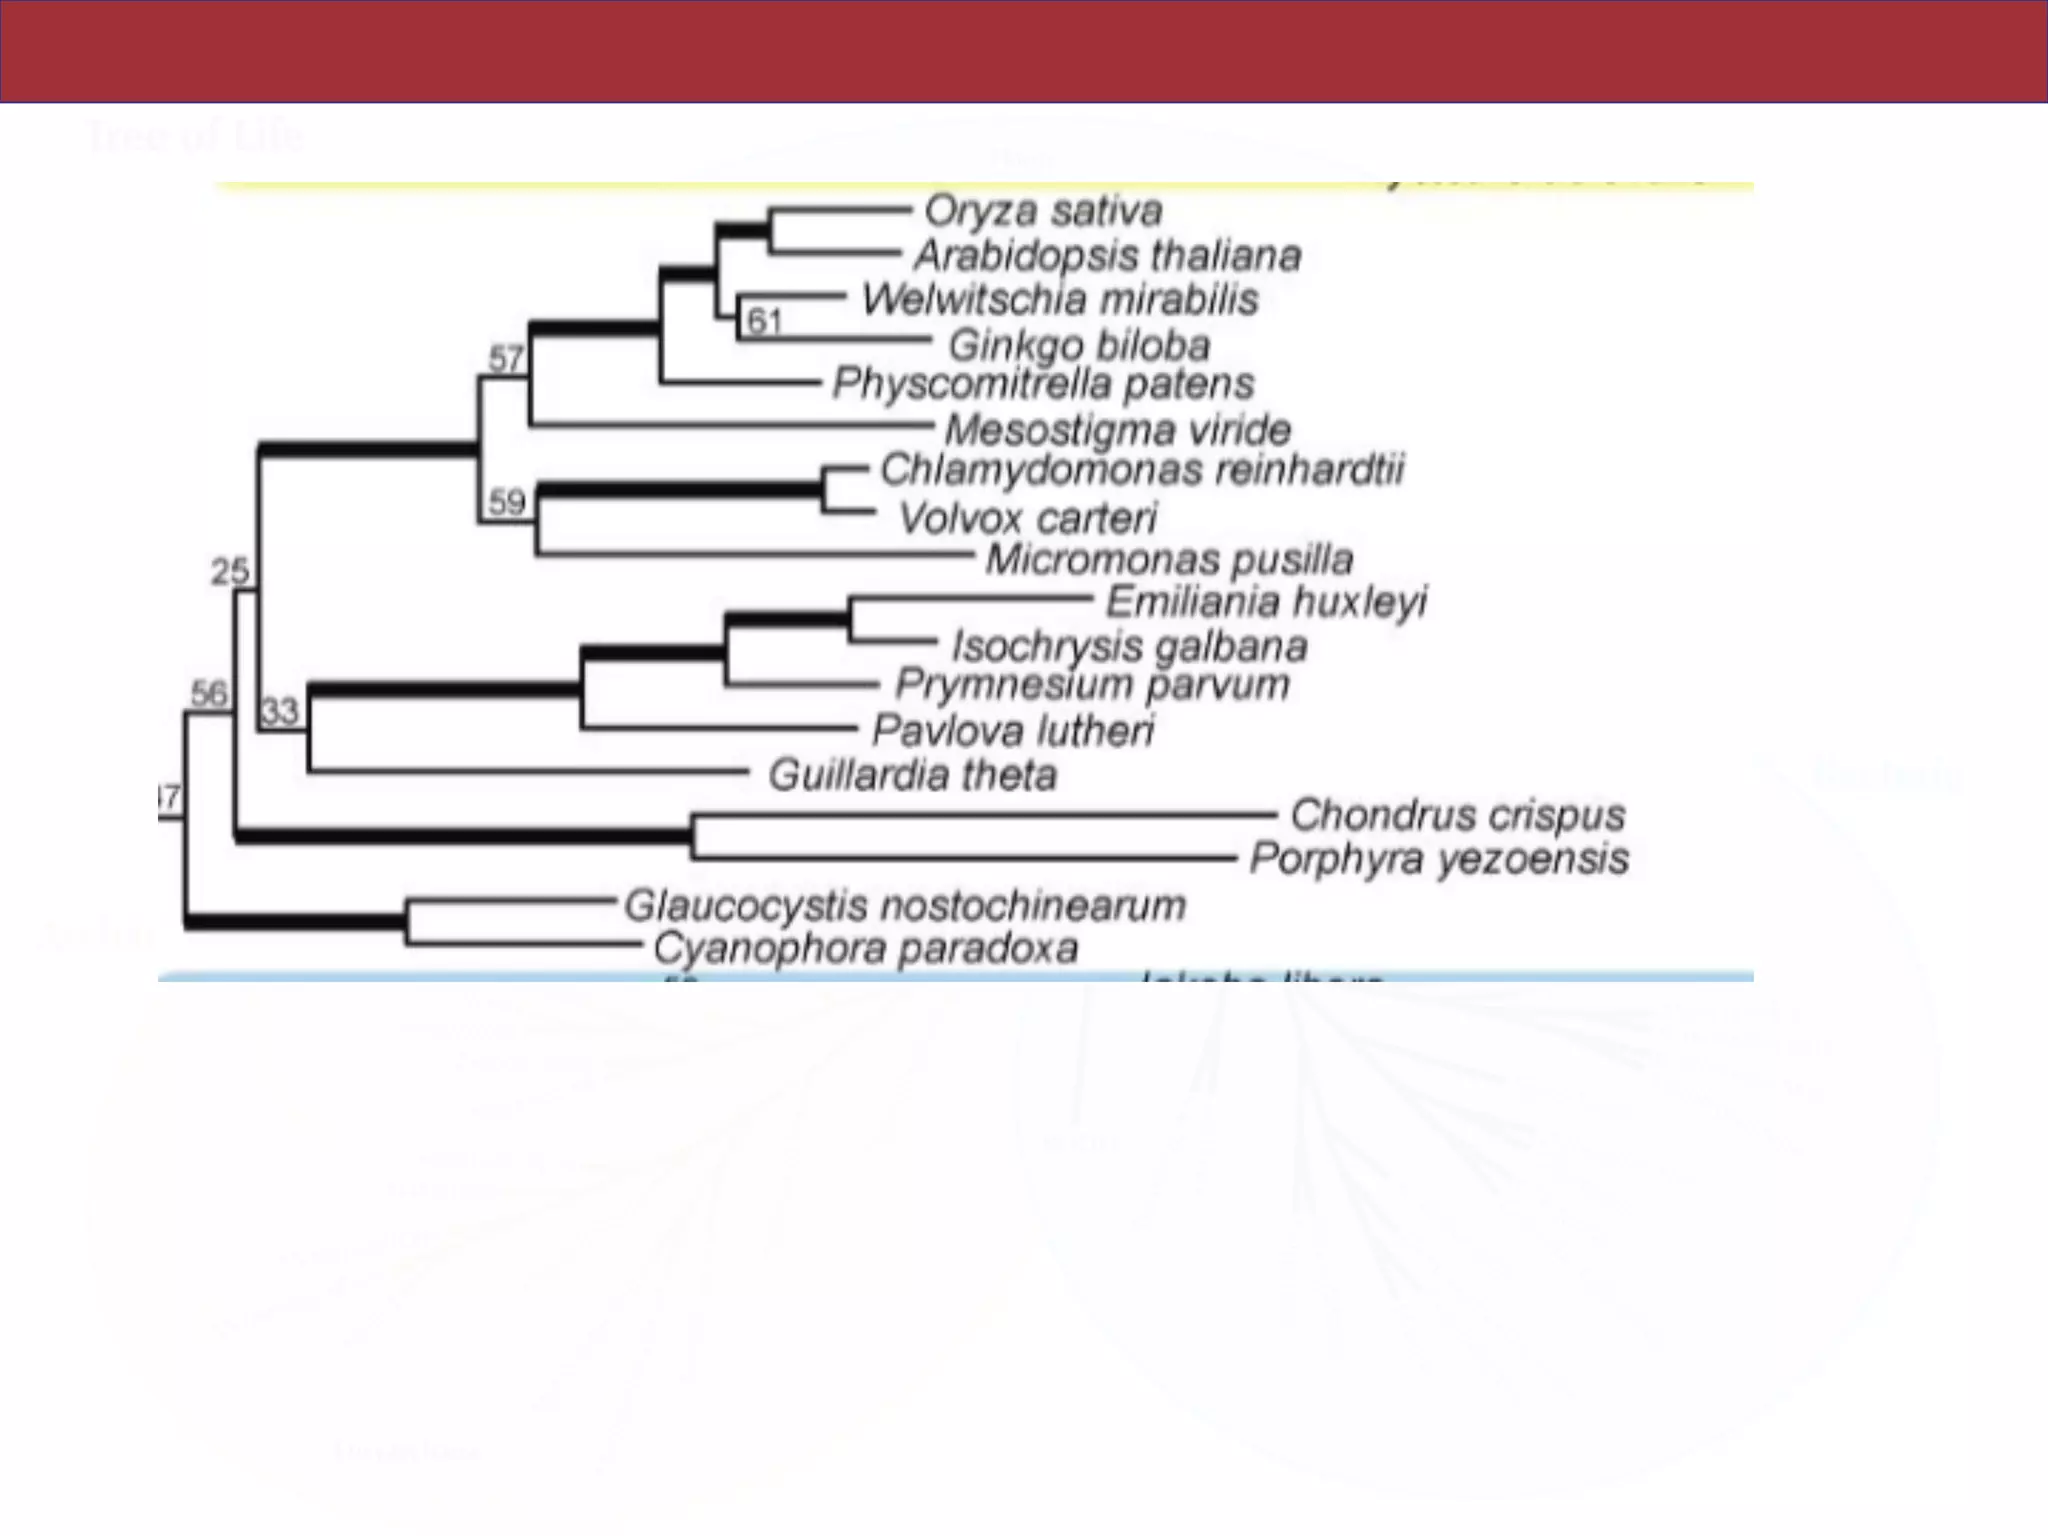
Furthermore, ex- tensive instability among photosynthetic lineages suggests the presence of
systematic biases including endosymbiotic gene transfer from symbiont (nucleus or plastid)
to host. Our analyses demonstrate that stable topologies of ancient evolutionary
relationships can be achieved with broad taxonomic sampling and a moderate number of
genes. Finally, taxon-rich analyses such as presented here provide a method for testing the
accuracy of relationships that receive high bootstrap support (BS) in phylogenomic analyses
and enable placement of the multitude of lineages that lack genome scale data. [Excavata;
microbial eukaryotes; Rhizaria; supergroups; systematic error; taxon sampling.]
!11](https://image.slidesharecdn.com/eve161w18l5-180131042516/75/EVE161-Microbial-Phylogenomics-Class-6-Tree-of-Life-Example-11-2048.jpg)
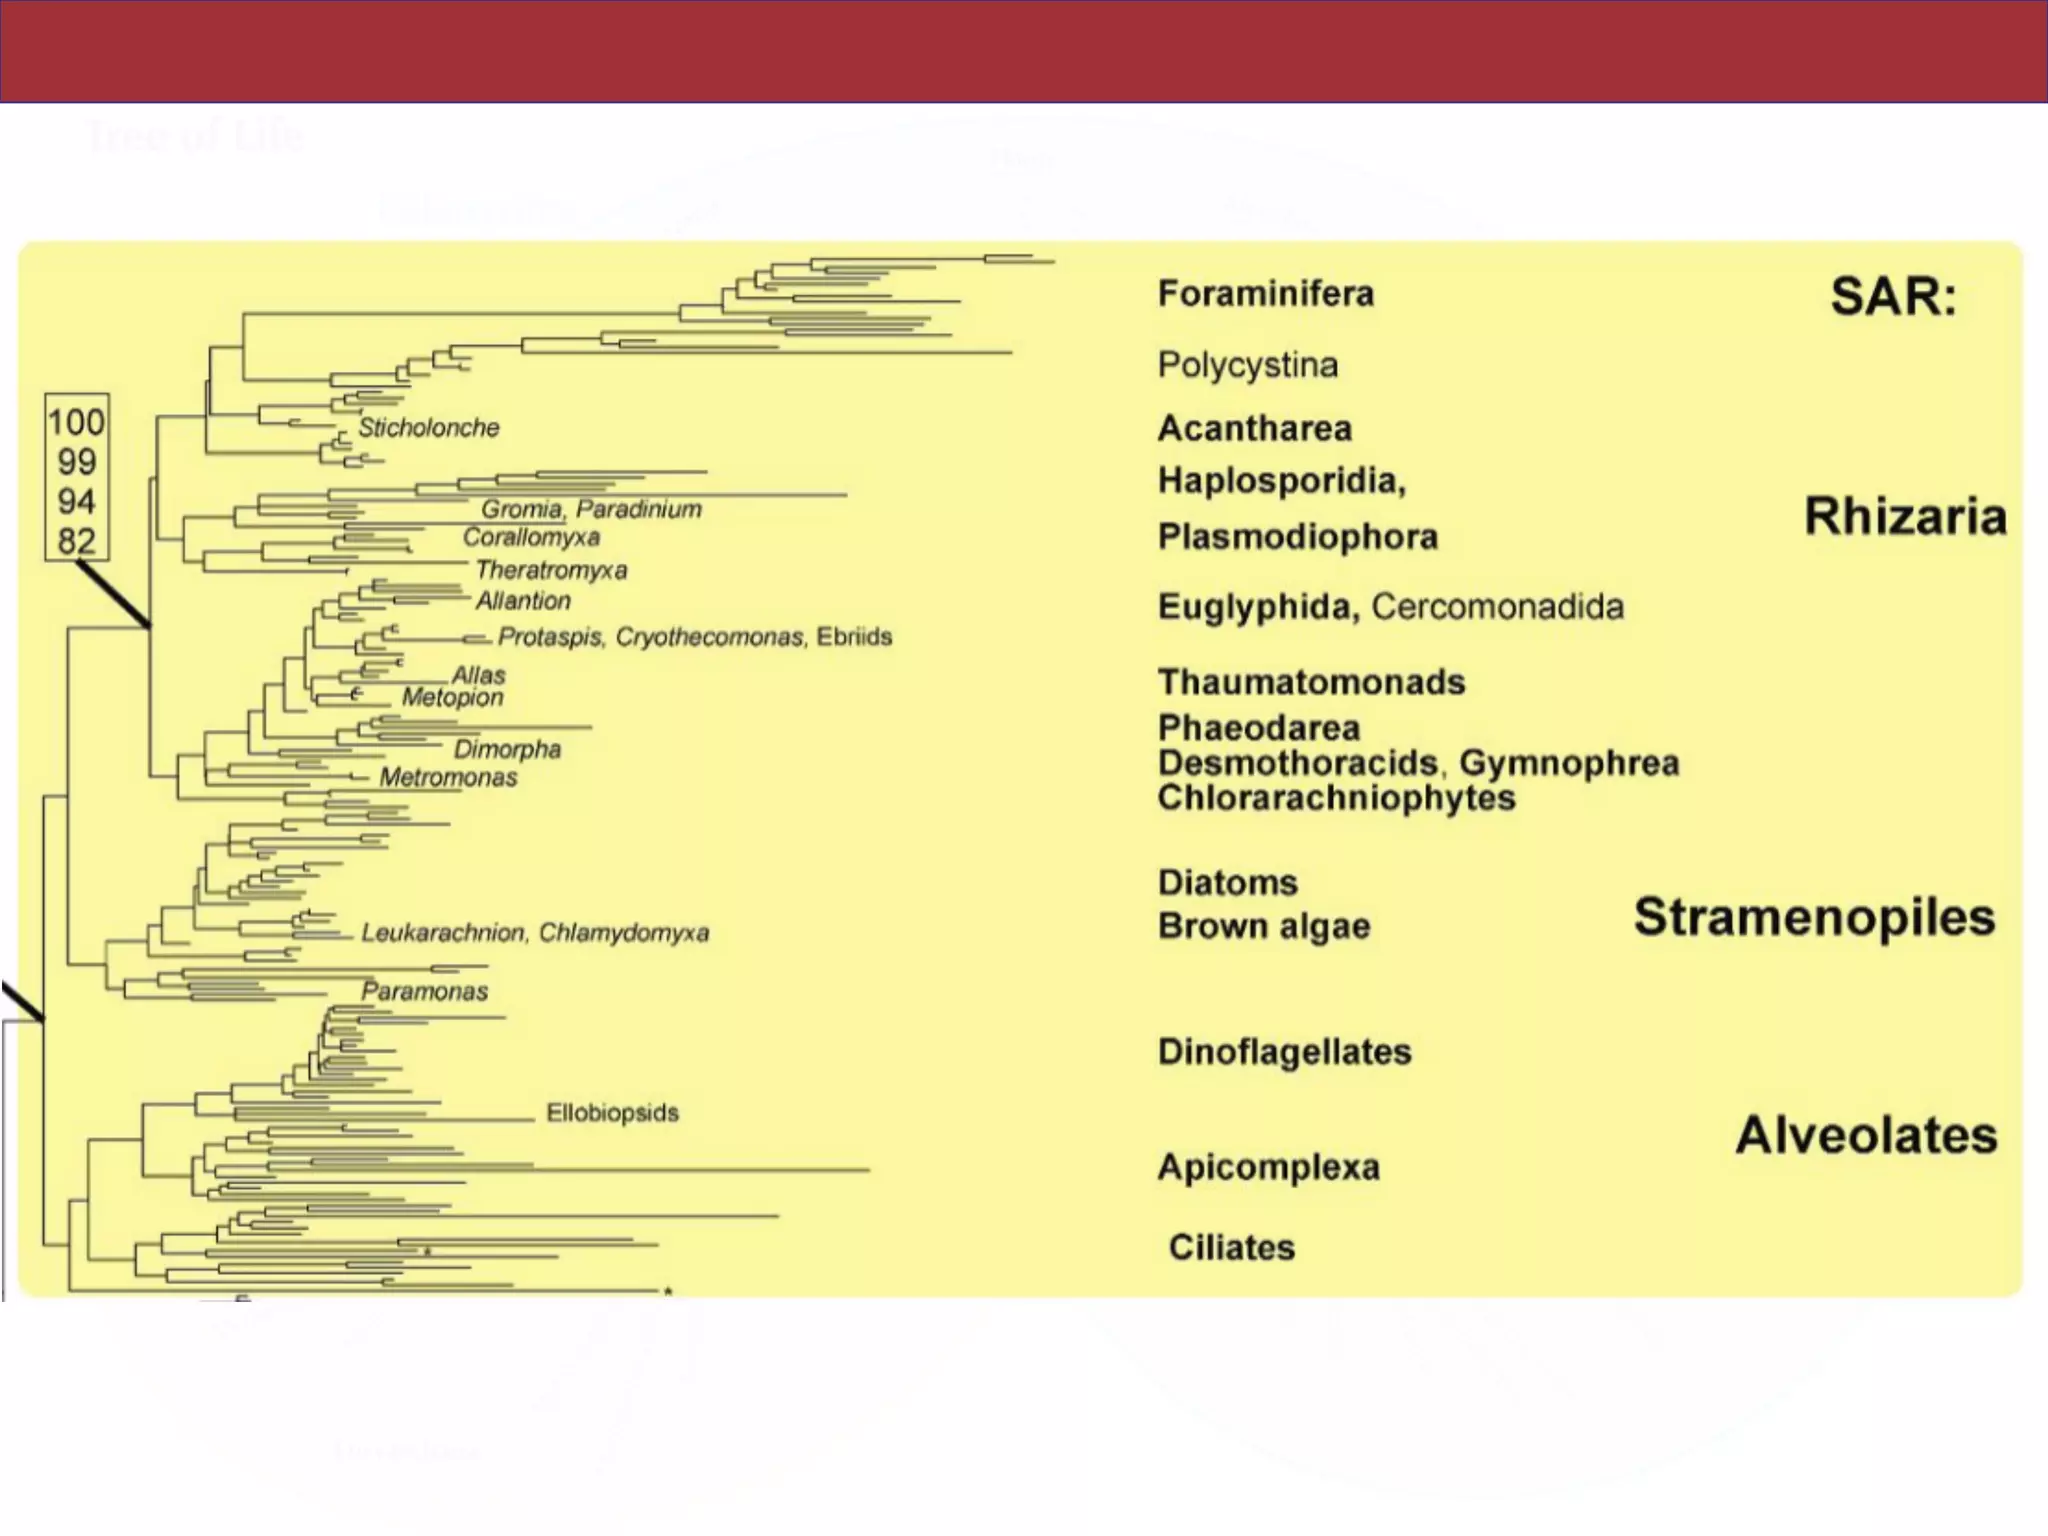
![Abstract
An accurate reconstruction of the eukaryotic tree of life is essential to identify the
innovations underlying the diversity of microbial and macroscopic (e.g., plants and animals)
eukaryotes. Previous work has divided eukaryotic diversity into a small number of high-level
“supergroups,” many of which receive strong support in phylogenomic analyses. However,
the abundance of data in phylogenomic analyses can lead to highly supported but incorrect
relationships due to systematic phylogenetic error. Furthermore, the paucity of major
eukaryotic lineages (19 or fewer) included in these genomic studies may exaggerate
systematic error and reduce power to evaluate hypotheses. Here, we use a taxon-rich
strategy to assess eukaryotic relationships. We show that analyses emphasizing broad
taxonomic sampling (up to 451 taxa representing 72 major lineages) combined with a
moderate number of genes yield a well-resolved eukaryotic tree of life. The consistency
across analyses with varying numbers of taxa (88–451) and levels of missing data (17–69%)
supports the accuracy of the resulting topologies. The resulting stable topology emerges
without the removal of rapidly evolving genes or taxa, a practice common to phylogenomic
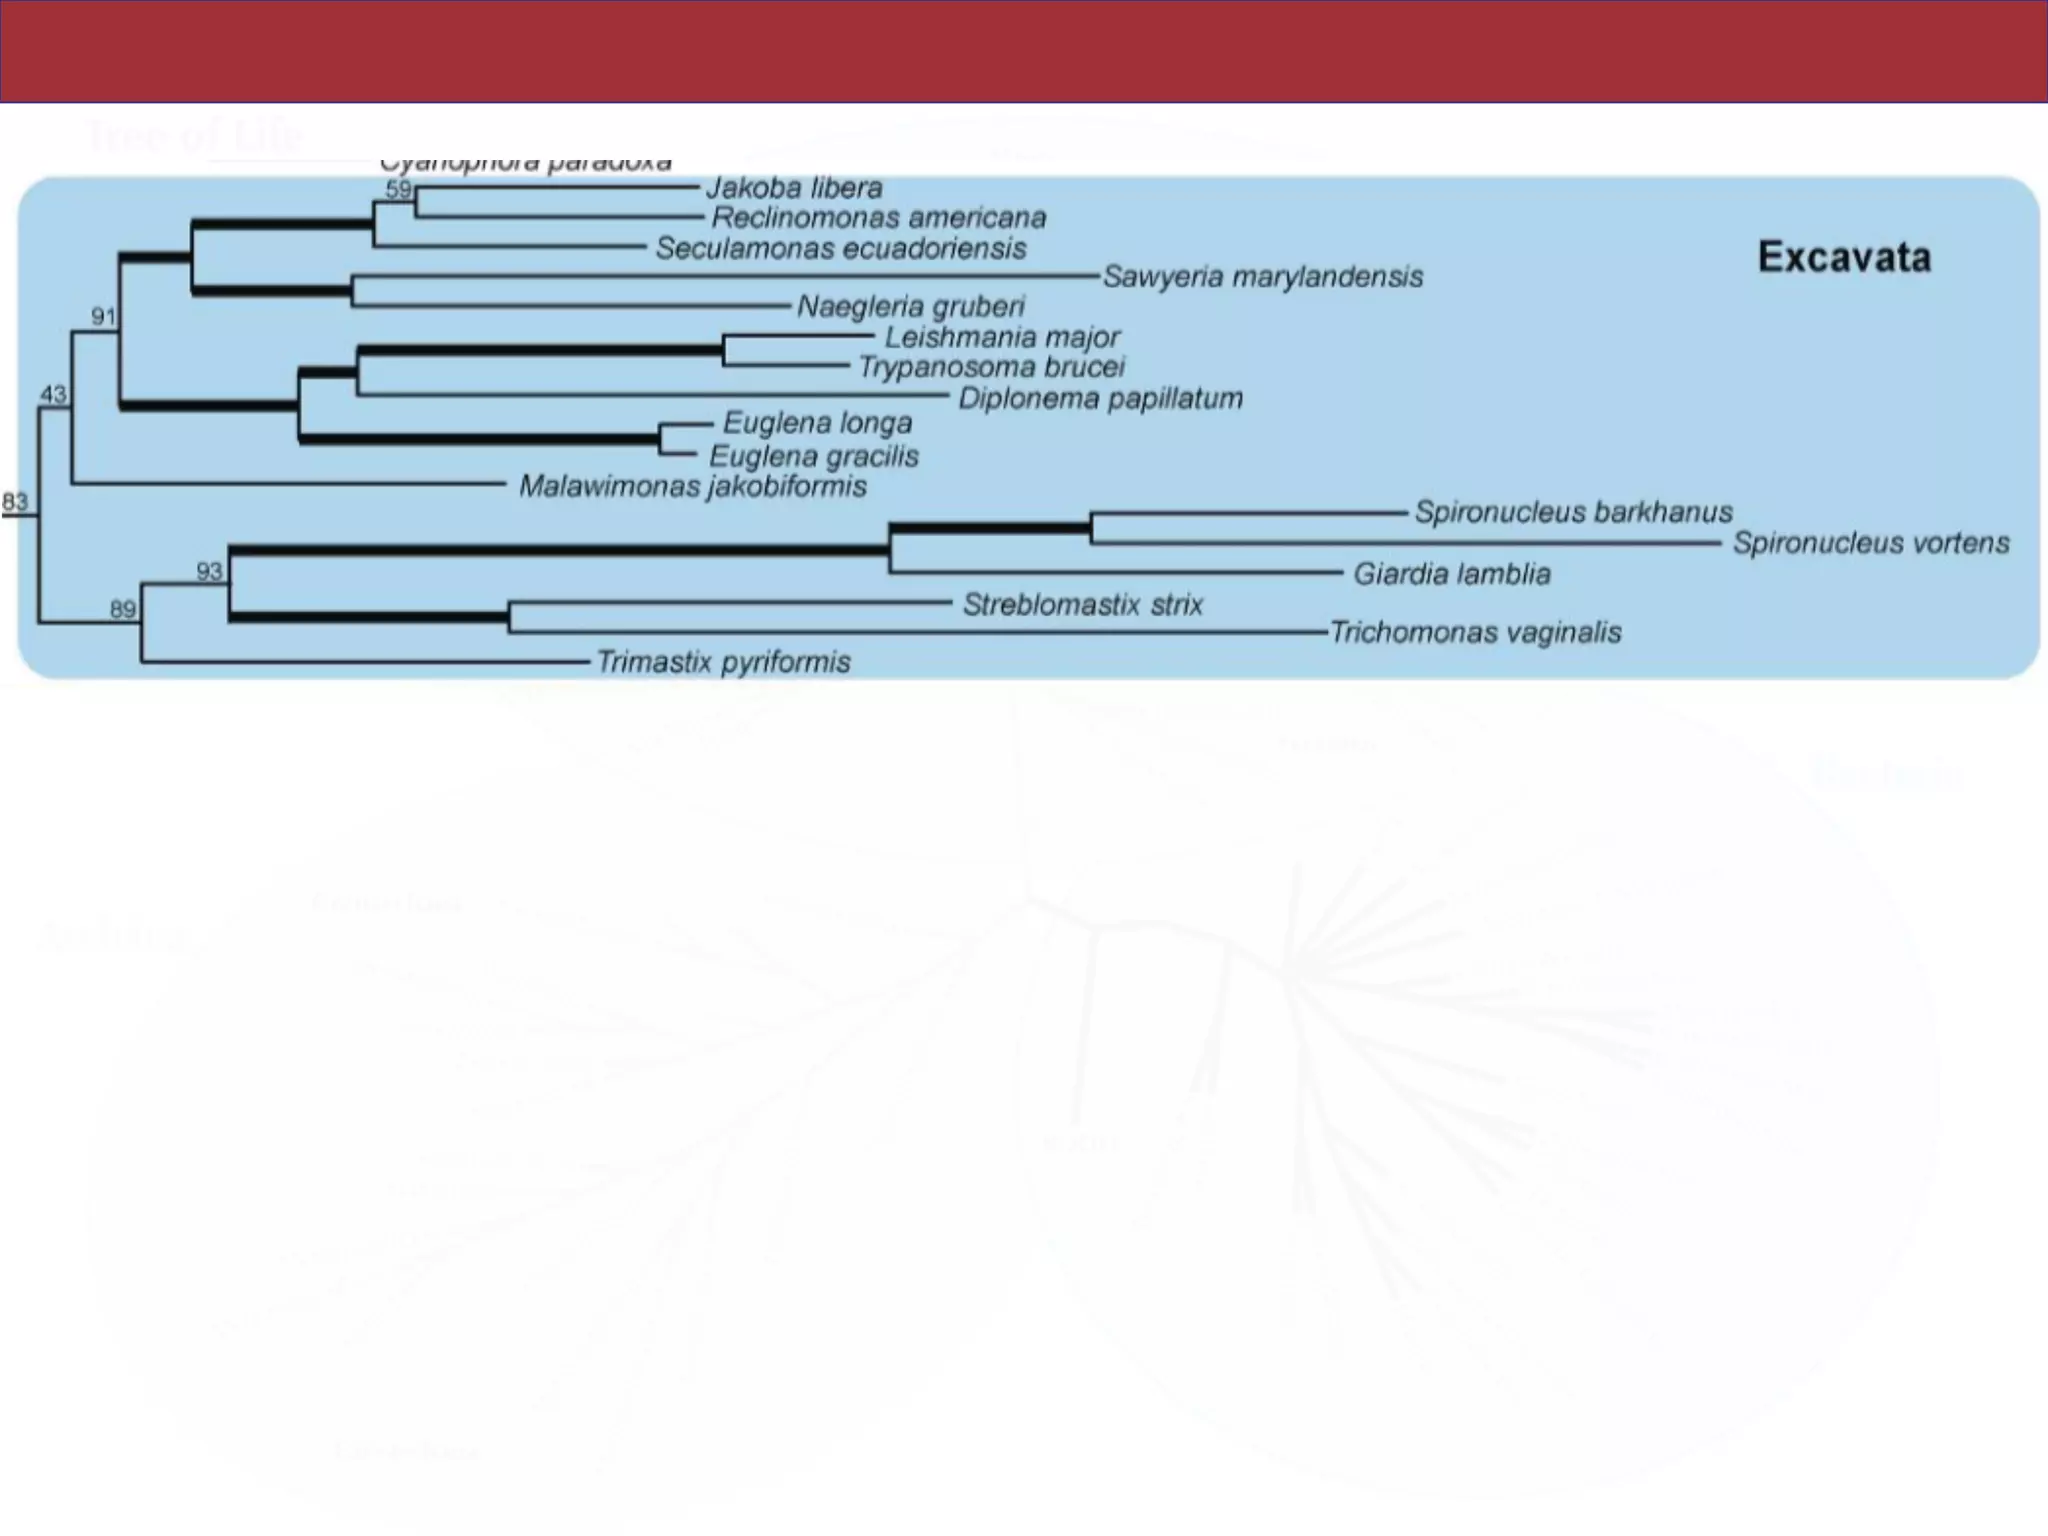
analyses. Several major groups are stable and strongly supported in these analyses (e.g.,
SAR, Rhizaria, Excavata), whereas the proposed supergroup “Chromalveolata” is rejected.
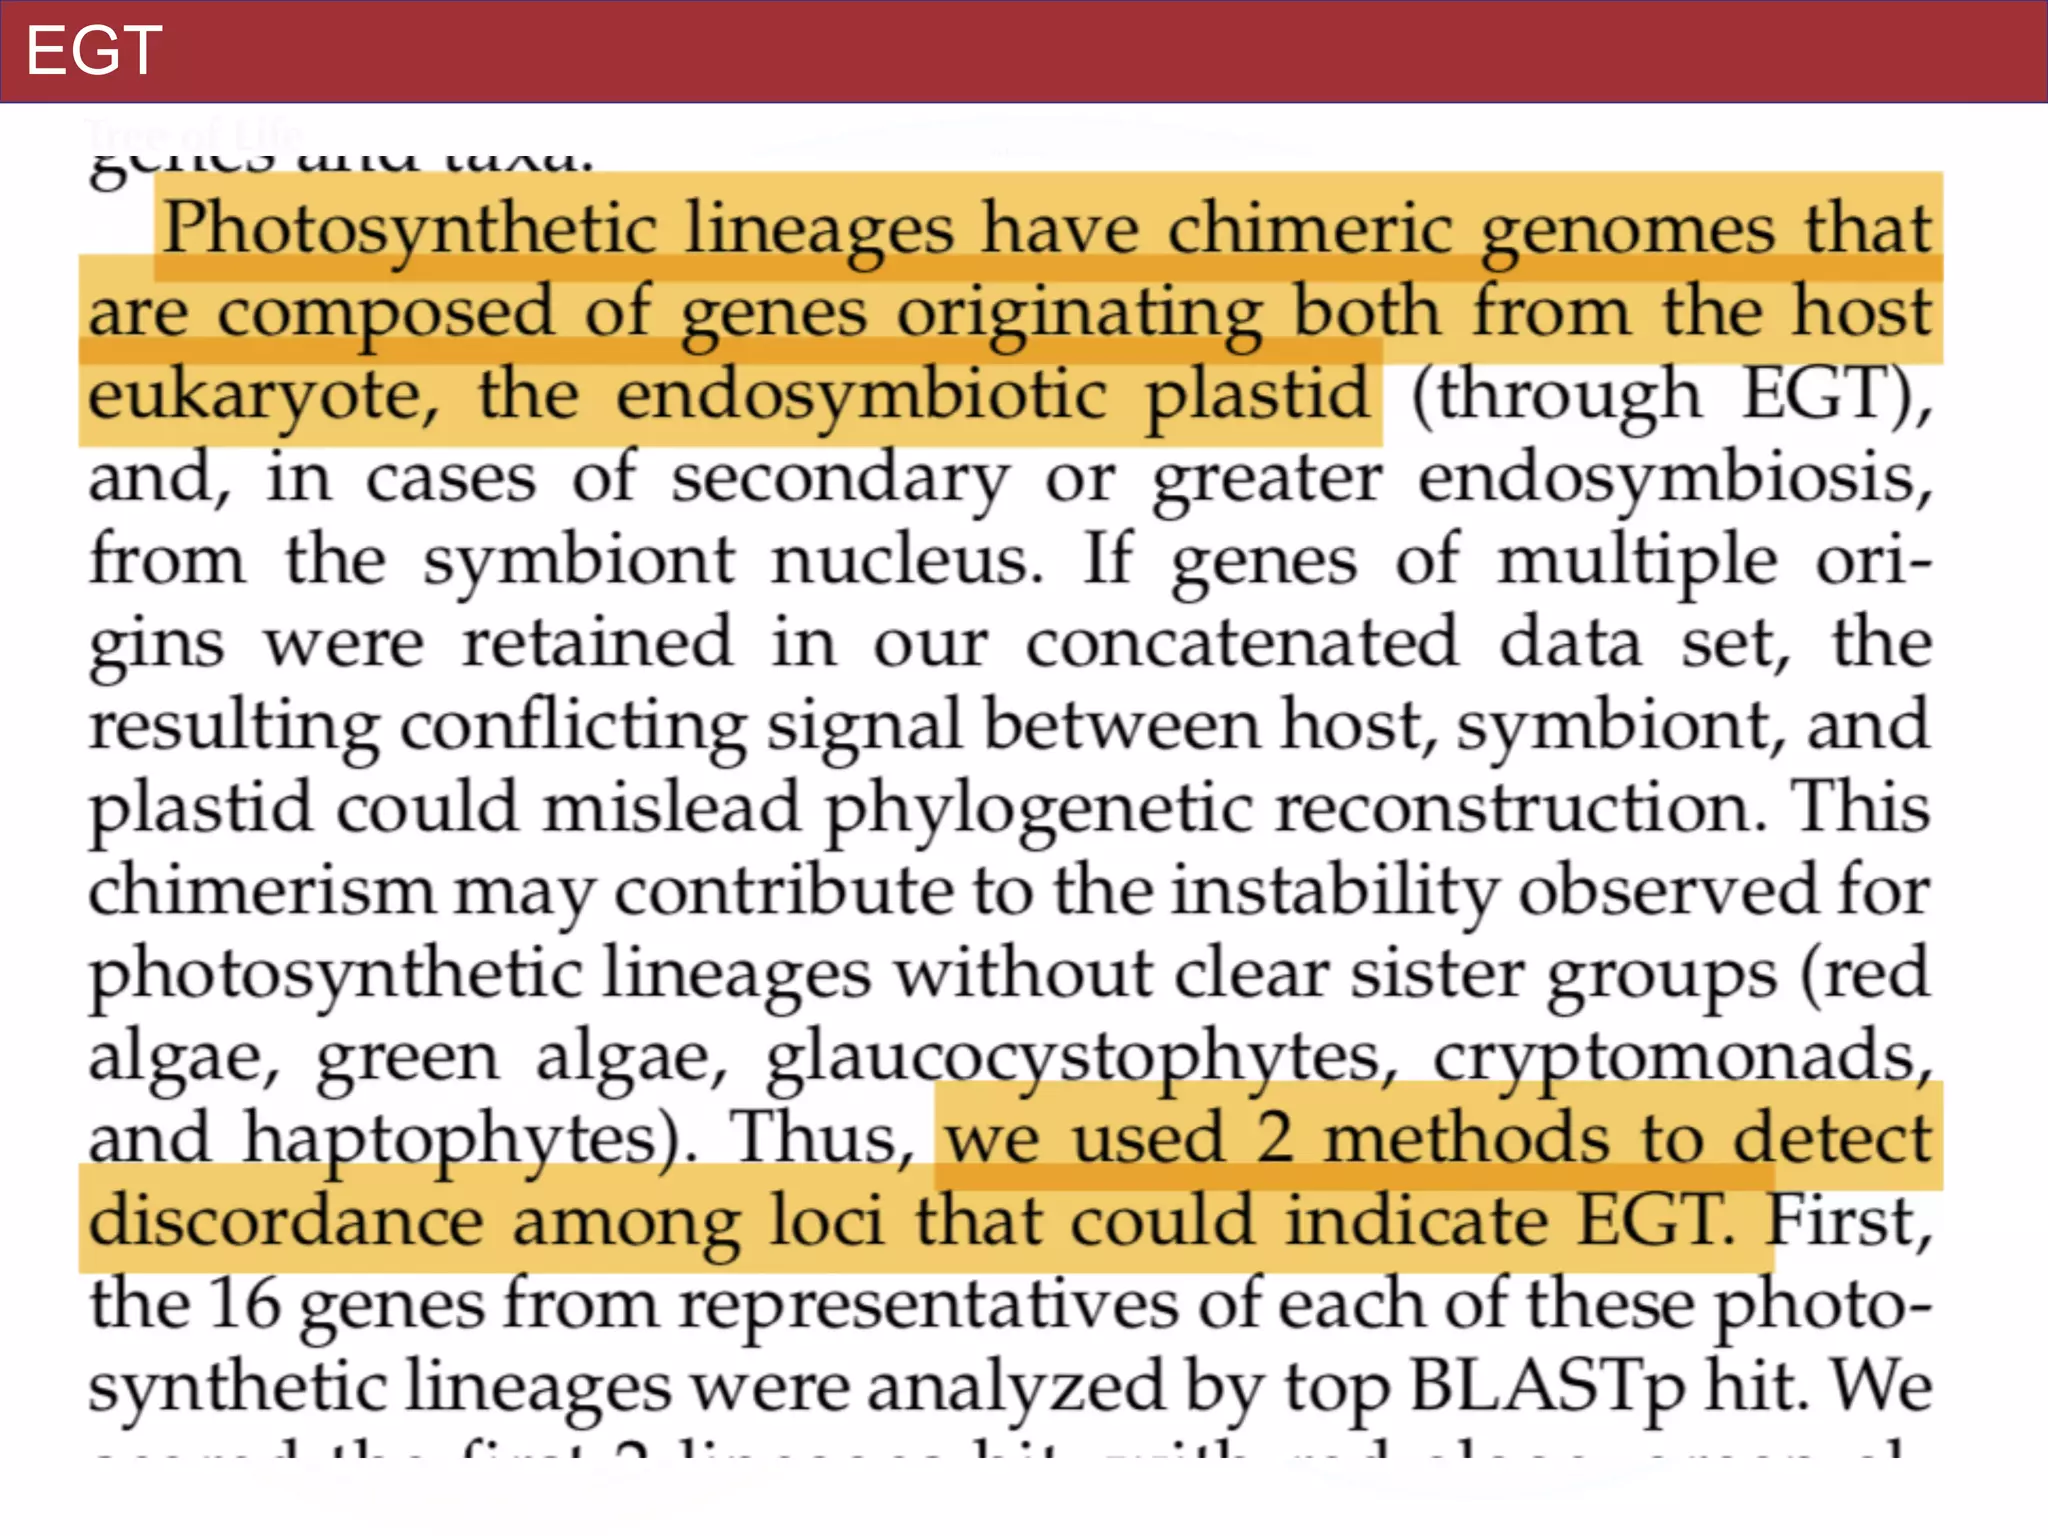
Furthermore, ex- tensive instability among photosynthetic lineages suggests the presence of
systematic biases including endosymbiotic gene transfer from symbiont (nucleus or plastid)
to host. Our analyses demonstrate that stable topologies of ancient evolutionary
relationships can be achieved with broad taxonomic sampling and a moderate number of
genes. Finally, taxon-rich analyses such as presented here provide a method for testing the
accuracy of relationships that receive high bootstrap support (BS) in phylogenomic analyses
and enable placement of the multitude of lineages that lack genome scale data. [Excavata;
microbial eukaryotes; Rhizaria; supergroups; systematic error; taxon sampling.]
!12](https://image.slidesharecdn.com/eve161w18l5-180131042516/75/EVE161-Microbial-Phylogenomics-Class-6-Tree-of-Life-Example-12-2048.jpg)
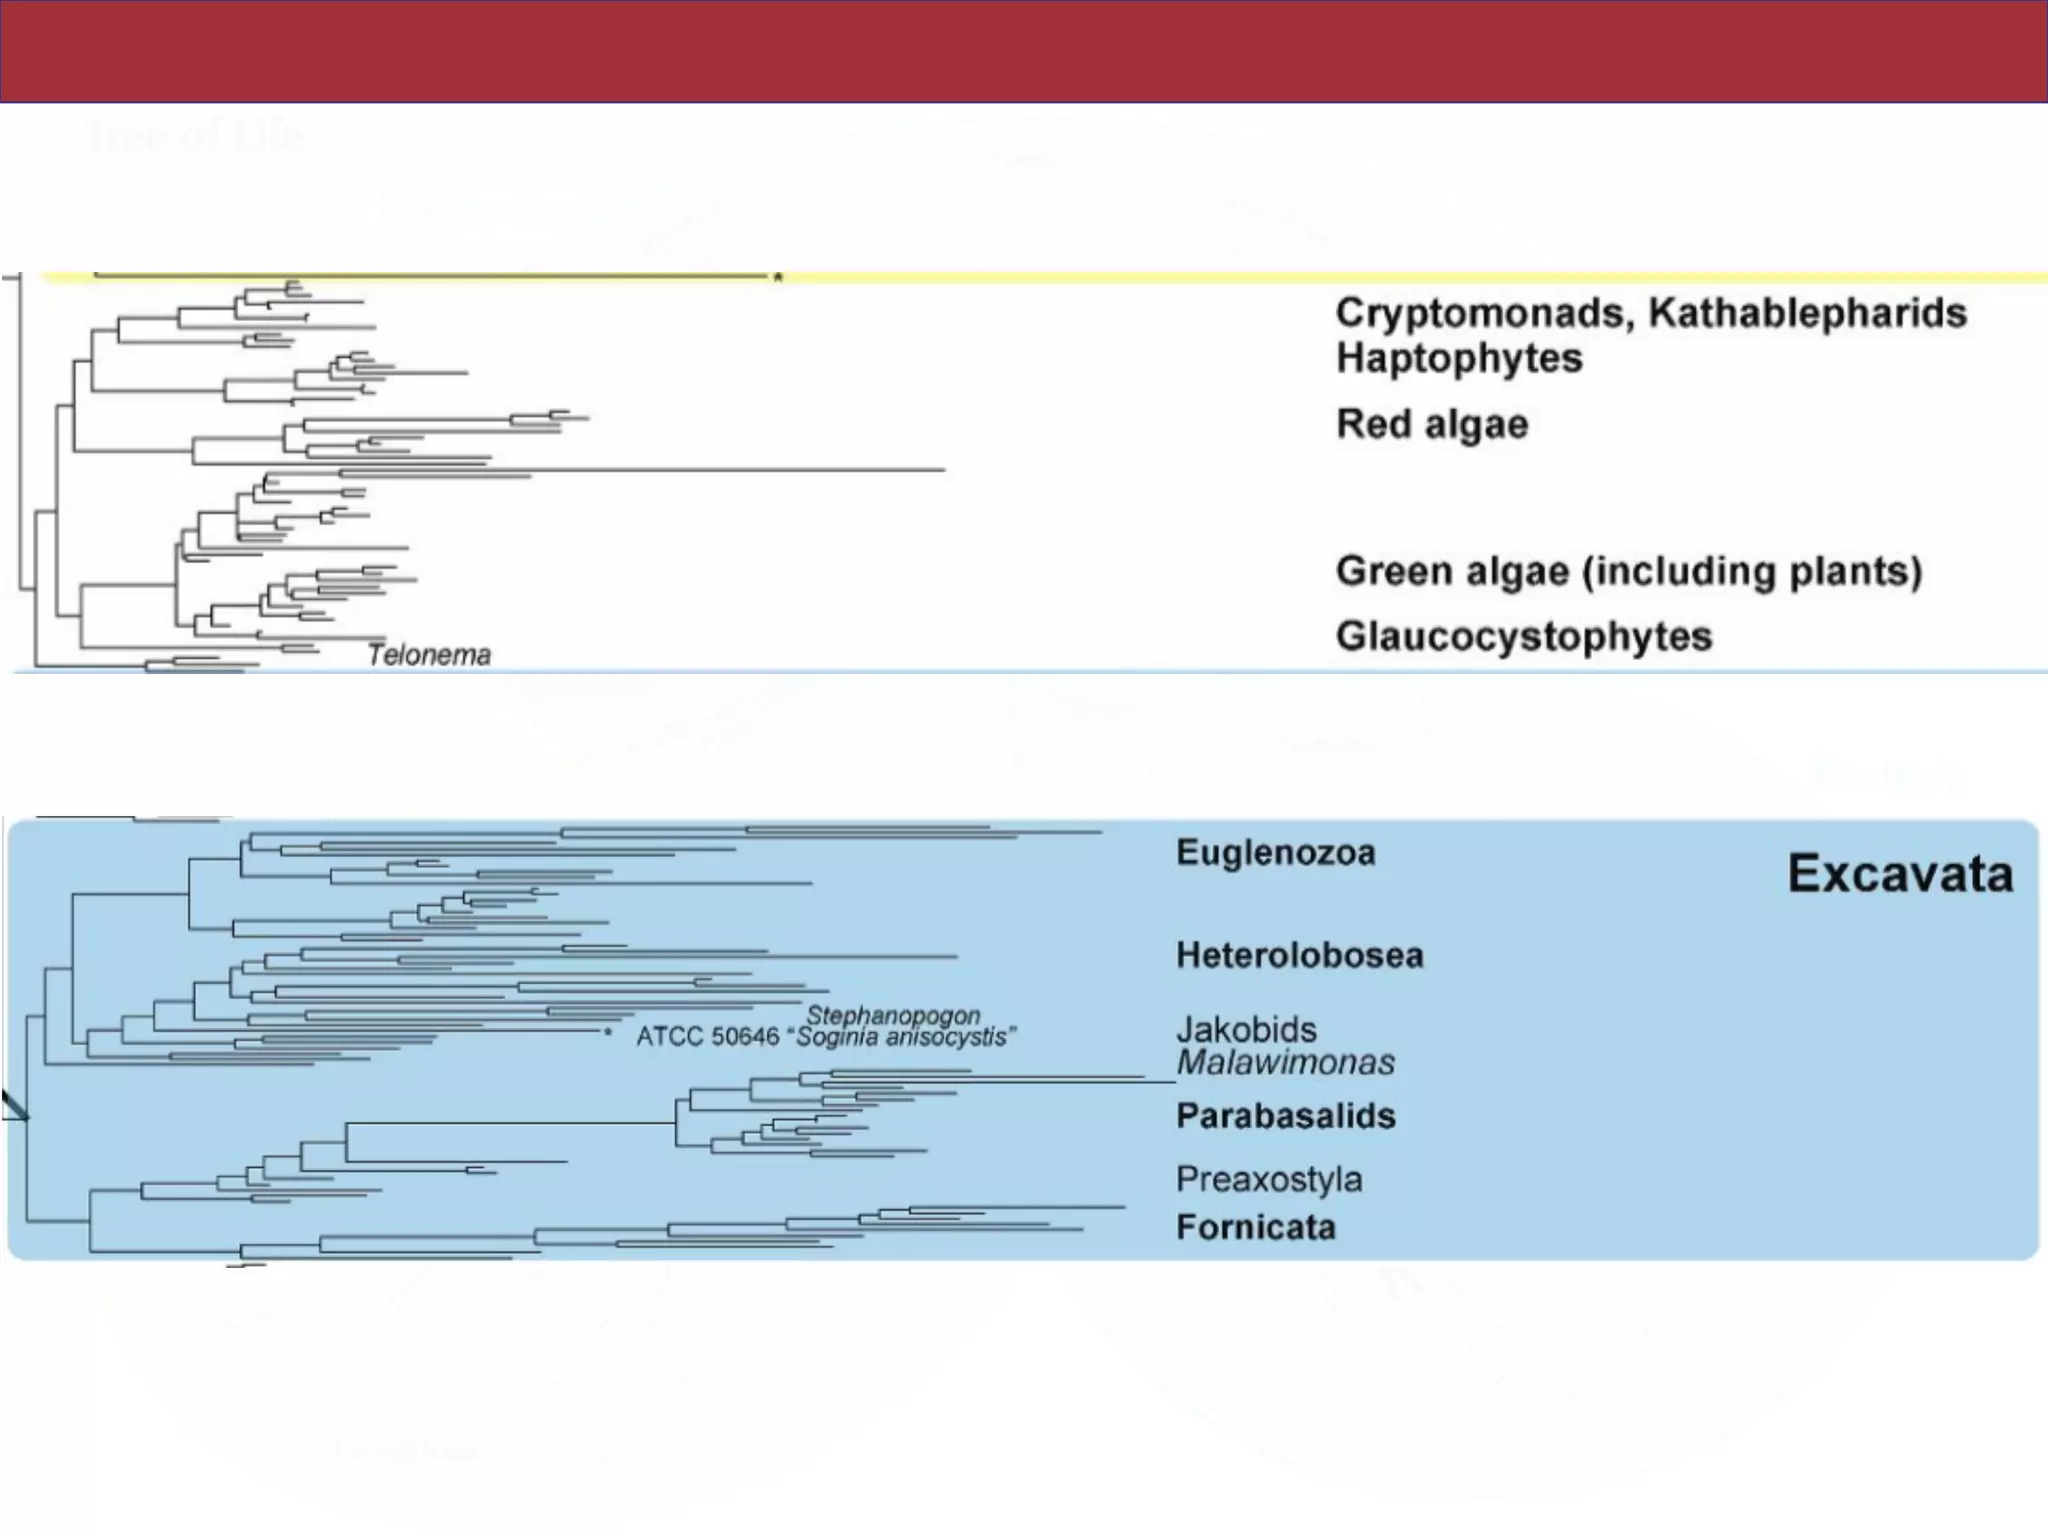
![Abstract
An accurate reconstruction of the eukaryotic tree of life is essential to identify the
innovations underlying the diversity of microbial and macroscopic (e.g., plants and animals)
eukaryotes. Previous work has divided eukaryotic diversity into a small number of high-level
“supergroups,” many of which receive strong support in phylogenomic analyses. However,
the abundance of data in phylogenomic analyses can lead to highly supported but incorrect
relationships due to systematic phylogenetic error. Furthermore, the paucity of major
eukaryotic lineages (19 or fewer) included in these genomic studies may exaggerate
systematic error and reduce power to evaluate hypotheses. Here, we use a taxon-rich
strategy to assess eukaryotic relationships. We show that analyses emphasizing broad
taxonomic sampling (up to 451 taxa representing 72 major lineages) combined with a
moderate number of genes yield a well-resolved eukaryotic tree of life. The consistency
across analyses with varying numbers of taxa (88–451) and levels of missing data (17–69%)
supports the accuracy of the resulting topologies. The resulting stable topology emerges
without the removal of rapidly evolving genes or taxa, a practice common to phylogenomic
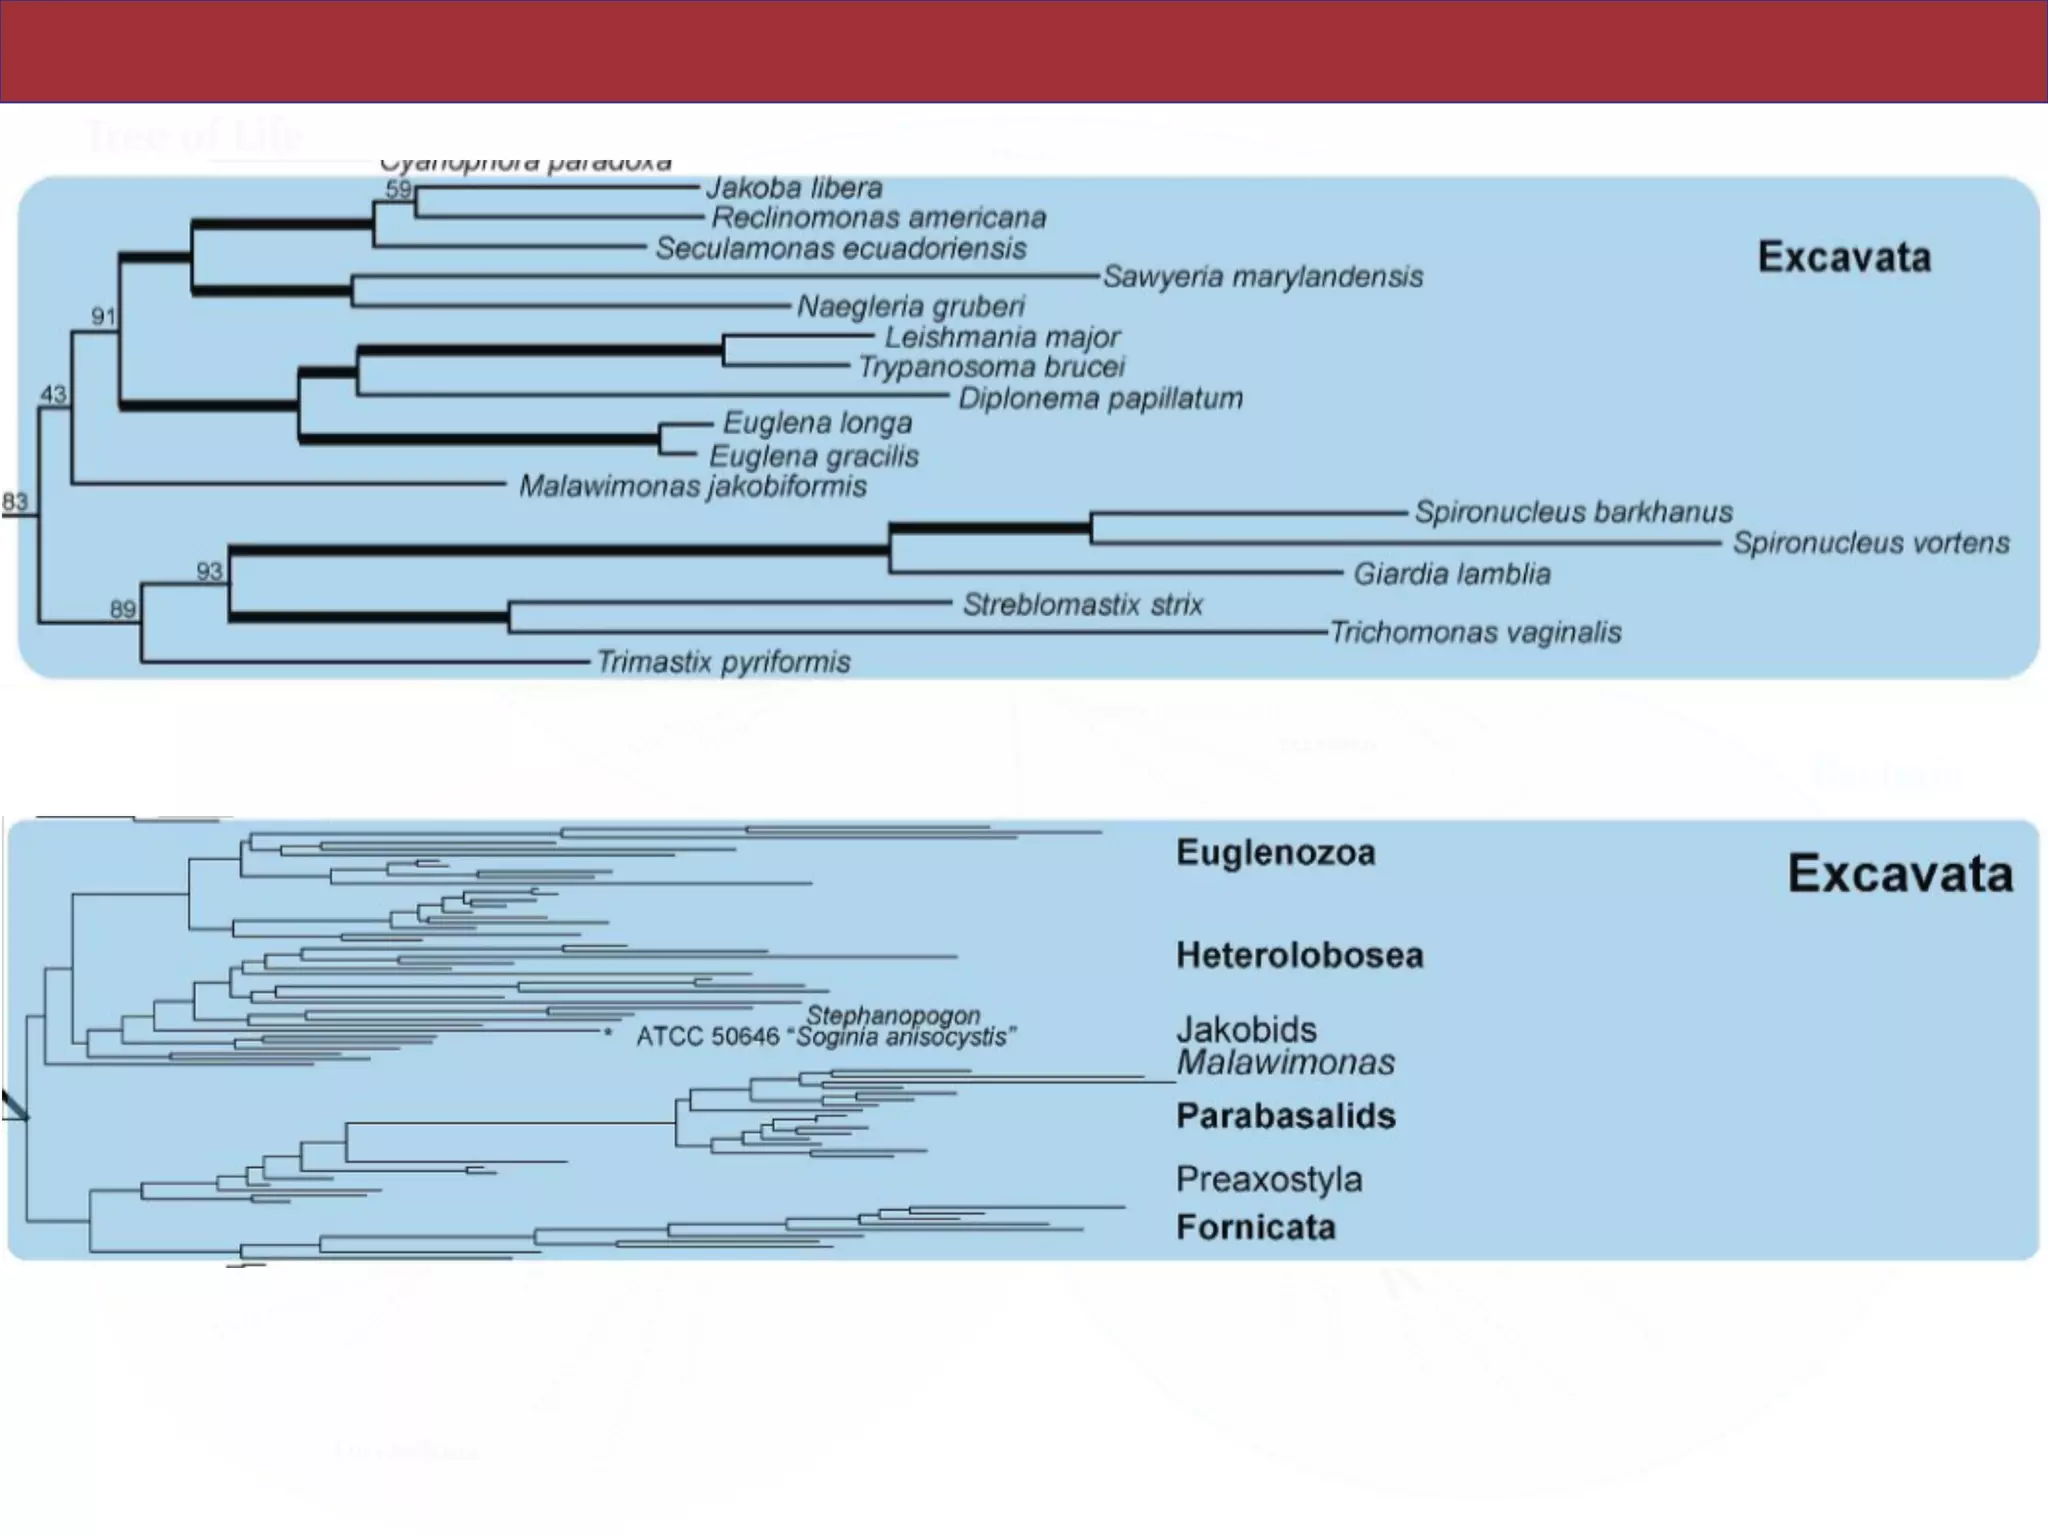
analyses. Several major groups are stable and strongly supported in these analyses (e.g.,
SAR, Rhizaria, Excavata), whereas the proposed supergroup “Chromalveolata” is rejected.
Furthermore, ex- tensive instability among photosynthetic lineages suggests the presence of
systematic biases including endosymbiotic gene transfer from symbiont (nucleus or plastid)
to host. Our analyses demonstrate that stable topologies of ancient evolutionary
relationships can be achieved with broad taxonomic sampling and a moderate number of
genes. Finally, taxon-rich analyses such as presented here provide a method for testing the
accuracy of relationships that receive high bootstrap support (BS) in phylogenomic analyses
and enable placement of the multitude of lineages that lack genome scale data. [Excavata;
microbial eukaryotes; Rhizaria; supergroups; systematic error; taxon sampling.]
!13](https://image.slidesharecdn.com/eve161w18l5-180131042516/75/EVE161-Microbial-Phylogenomics-Class-6-Tree-of-Life-Example-13-2048.jpg)
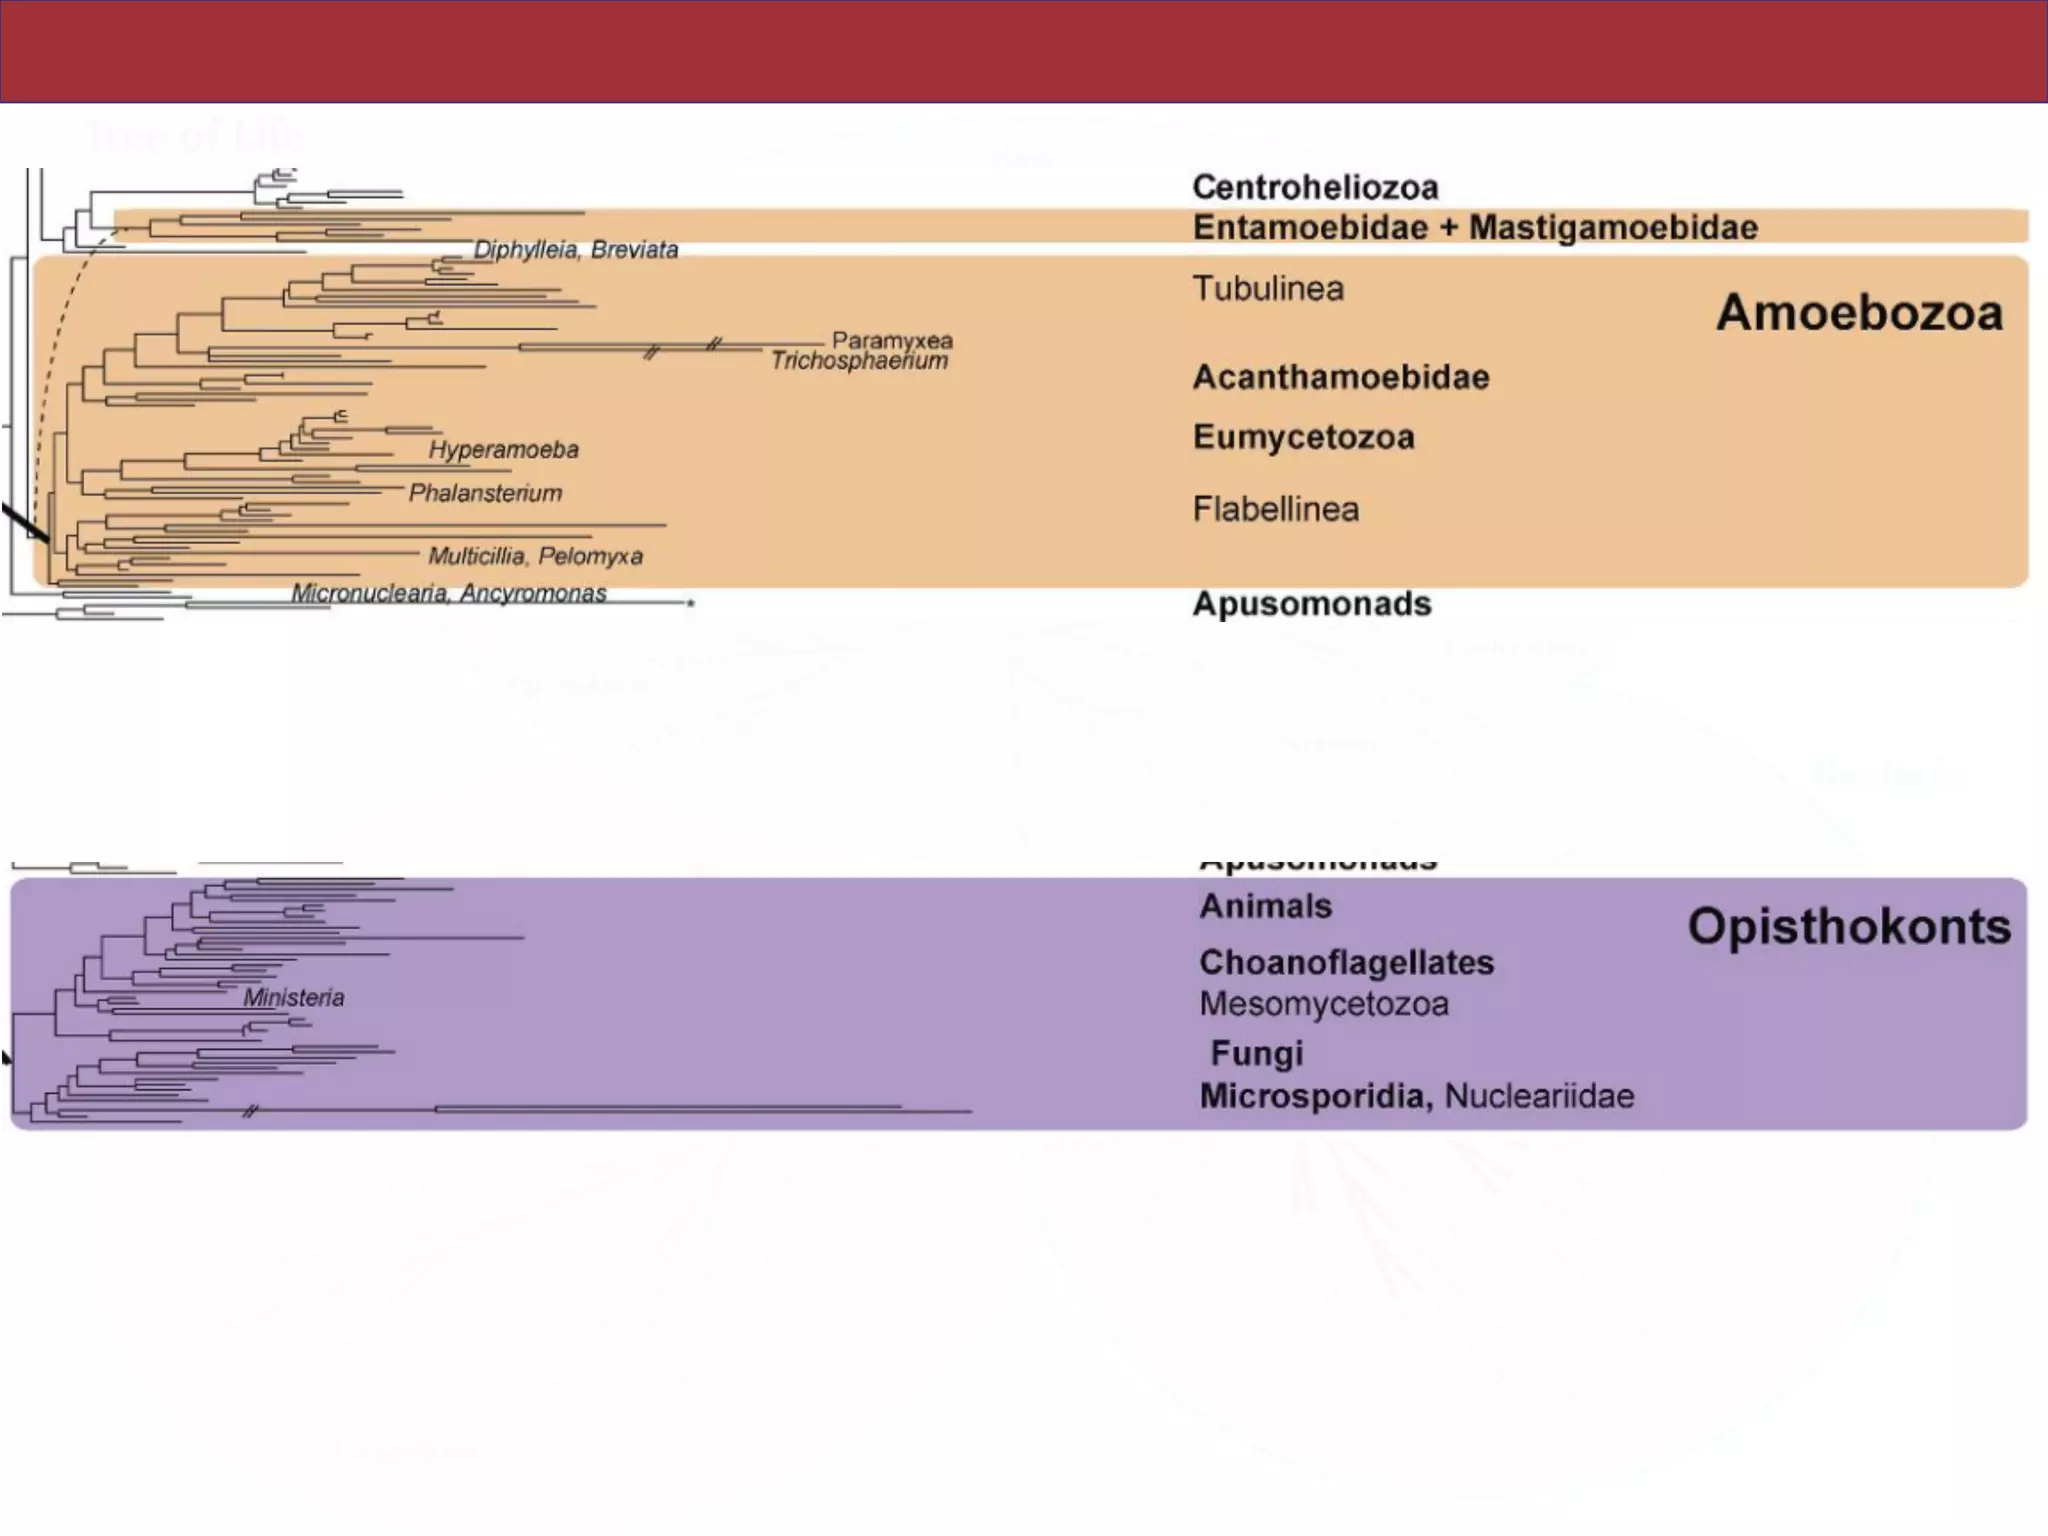
![Abstract
An accurate reconstruction of the eukaryotic tree of life is essential to identify the
innovations underlying the diversity of microbial and macroscopic (e.g., plants and animals)
eukaryotes. Previous work has divided eukaryotic diversity into a small number of high-level
“supergroups,” many of which receive strong support in phylogenomic analyses. However,
the abundance of data in phylogenomic analyses can lead to highly supported but incorrect
relationships due to systematic phylogenetic error. Furthermore, the paucity of major
eukaryotic lineages (19 or fewer) included in these genomic studies may exaggerate
systematic error and reduce power to evaluate hypotheses. Here, we use a taxon-rich
strategy to assess eukaryotic relationships. We show that analyses emphasizing broad
taxonomic sampling (up to 451 taxa representing 72 major lineages) combined with a
moderate number of genes yield a well-resolved eukaryotic tree of life. The consistency
across analyses with varying numbers of taxa (88–451) and levels of missing data (17–69%)
supports the accuracy of the resulting topologies. The resulting stable topology emerges
without the removal of rapidly evolving genes or taxa, a practice common to phylogenomic
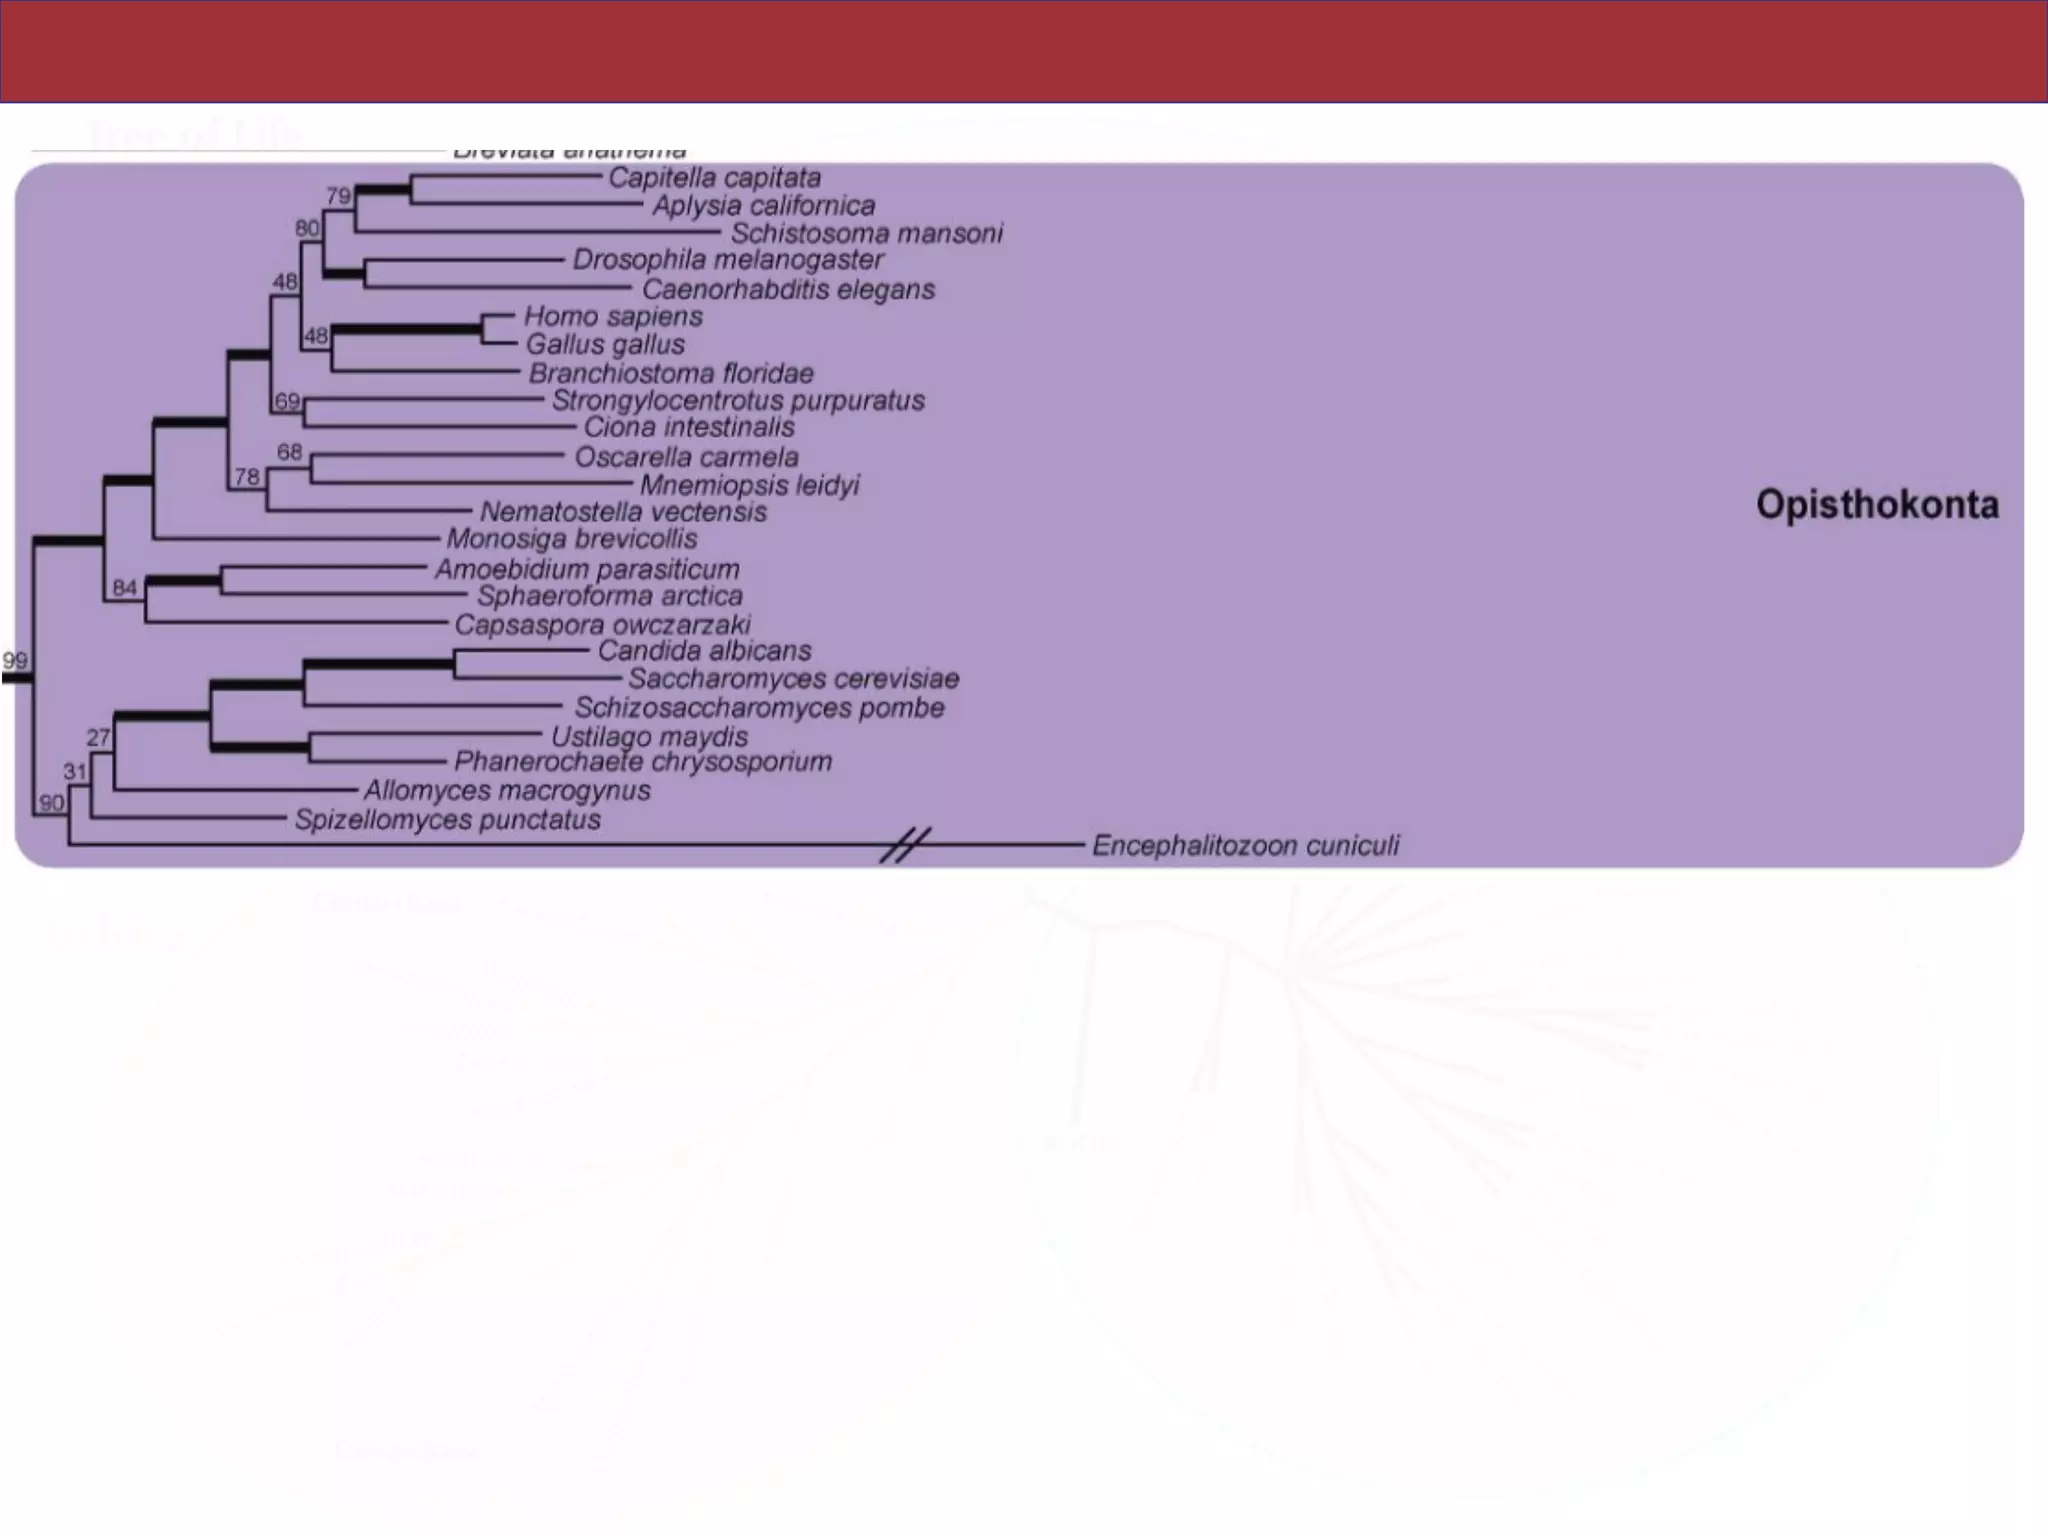
analyses. Several major groups are stable and strongly supported in these analyses (e.g.,
SAR, Rhizaria, Excavata), whereas the proposed supergroup “Chromalveolata” is rejected.
Furthermore, ex- tensive instability among photosynthetic lineages suggests the presence of
systematic biases including endosymbiotic gene transfer from symbiont (nucleus or plastid)
to host. Our analyses demonstrate that stable topologies of ancient evolutionary
relationships can be achieved with broad taxonomic sampling and a moderate number of
genes. Finally, taxon-rich analyses such as presented here provide a method for testing the
accuracy of relationships that receive high bootstrap support (BS) in phylogenomic analyses
and enable placement of the multitude of lineages that lack genome scale data. [Excavata;
microbial eukaryotes; Rhizaria; supergroups; systematic error; taxon sampling.]
!14](https://image.slidesharecdn.com/eve161w18l5-180131042516/75/EVE161-Microbial-Phylogenomics-Class-6-Tree-of-Life-Example-14-2048.jpg)


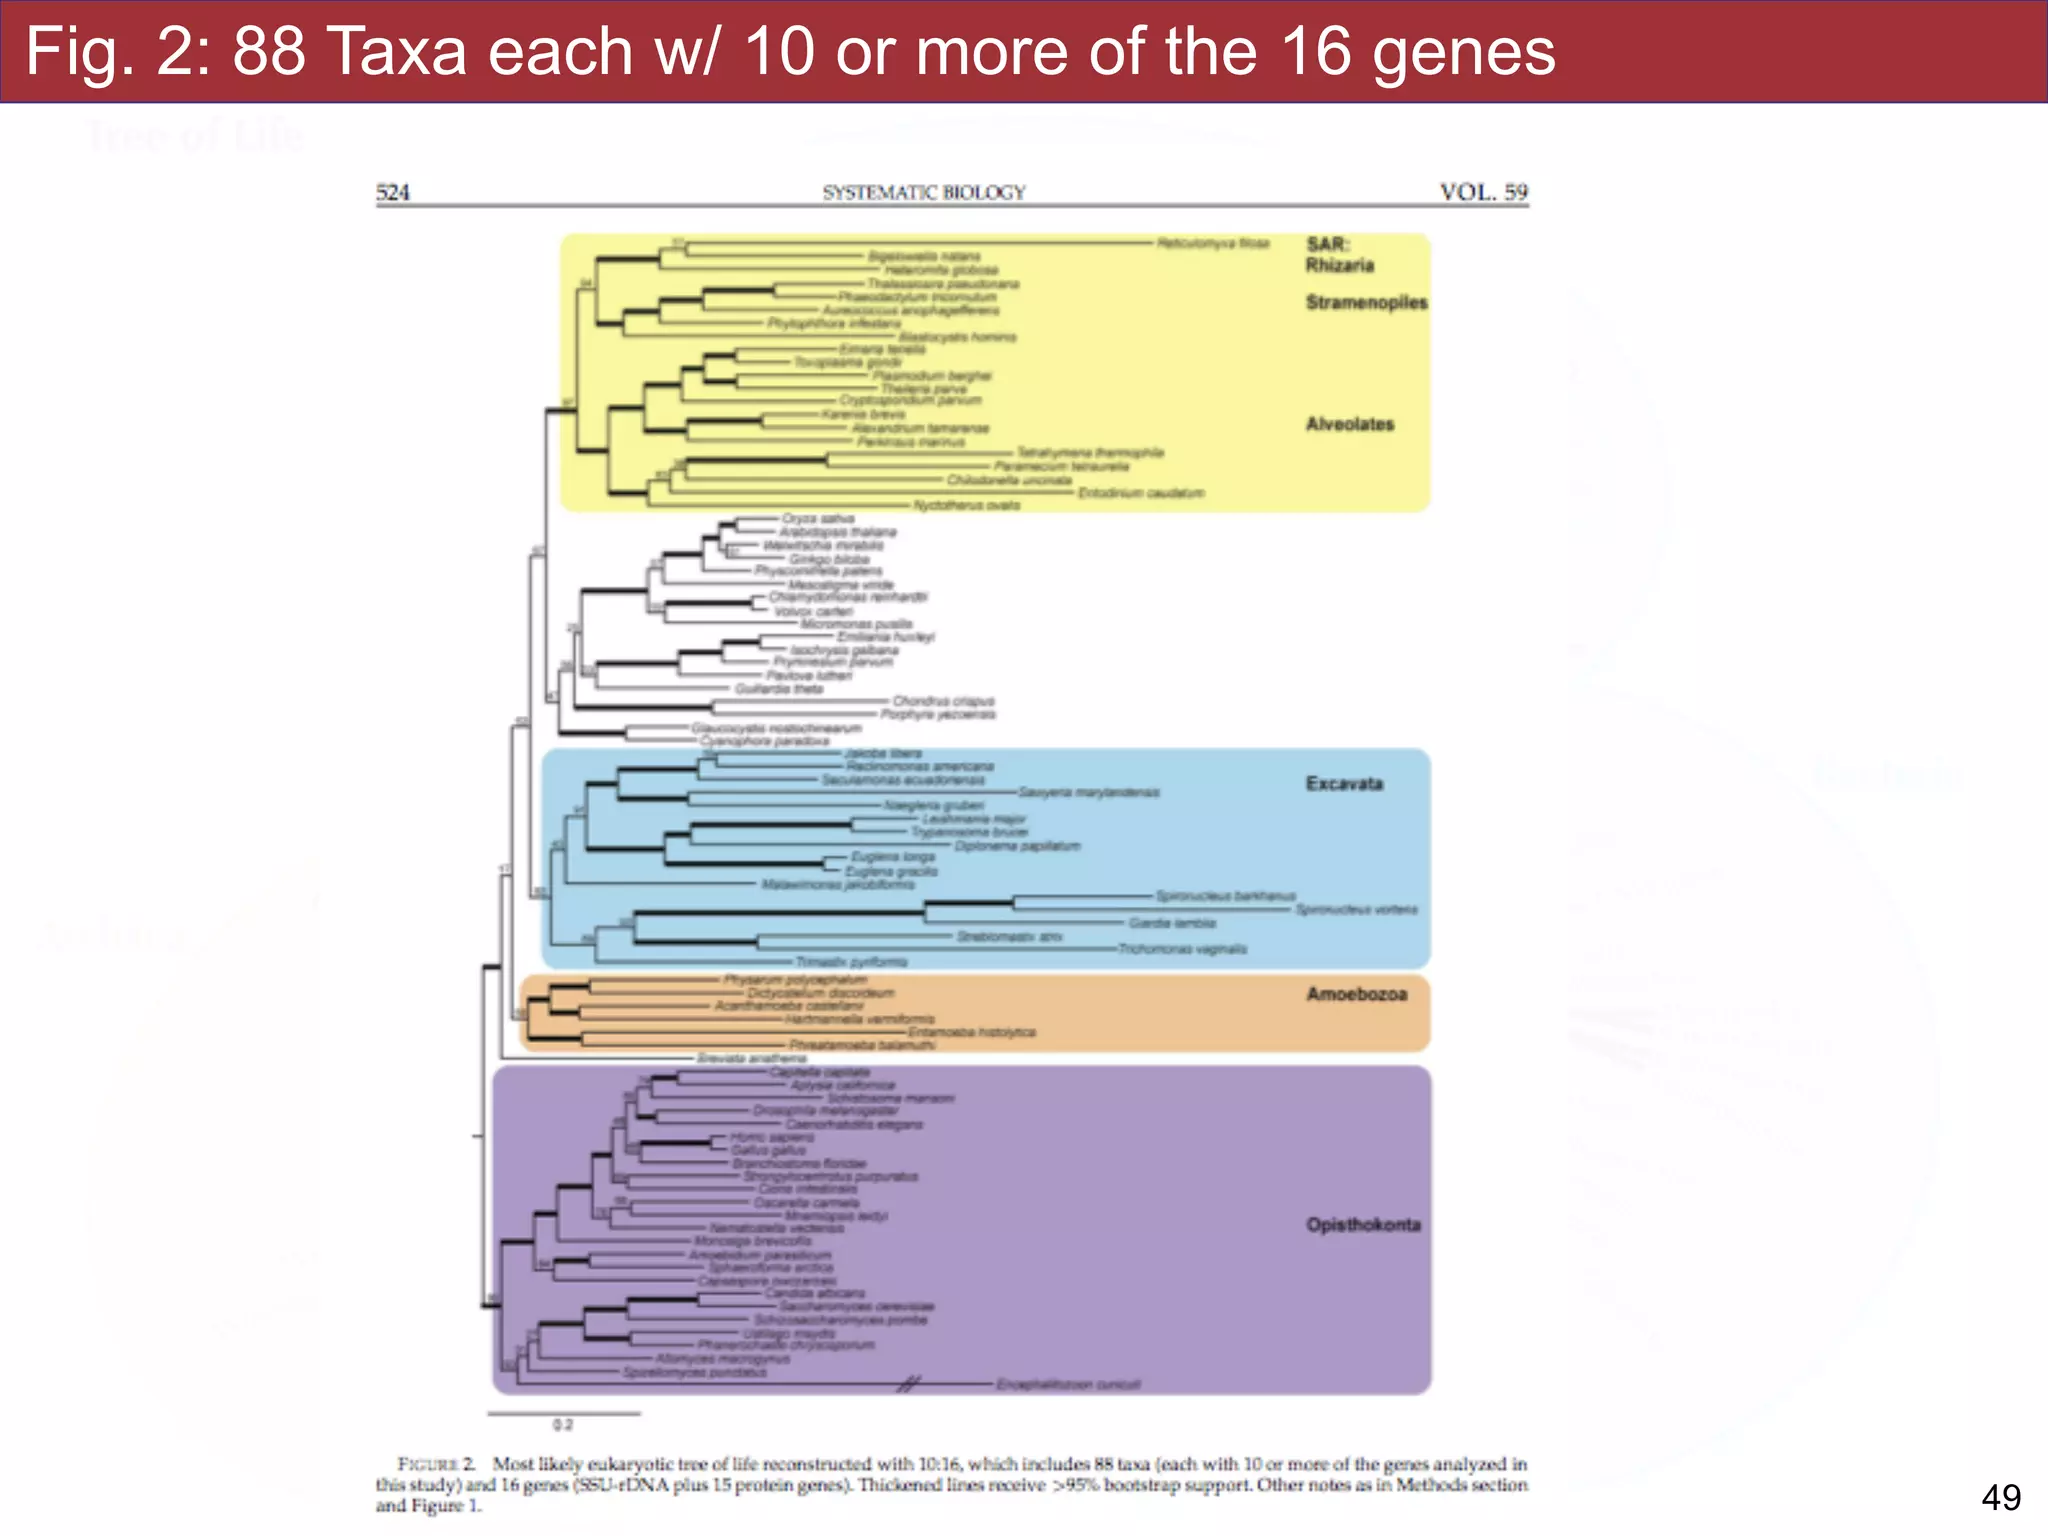


The document outlines a class on microbial phylogenomics, focusing on the reconstruction of the eukaryotic tree of life using a taxon-rich strategy. It emphasizes the importance of broad taxonomic sampling and multigene analyses to produce stable topologies while cautioning against systematic errors in phylogenomic studies. Key findings include the rejection of the 'chromalveolata' supergroup and the identification of major stable groups such as SAR, Rhizaria, and Excavata.


