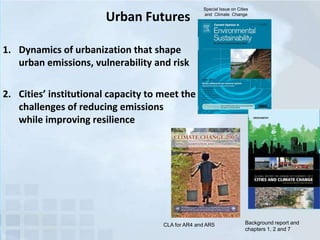
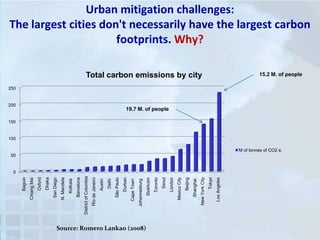
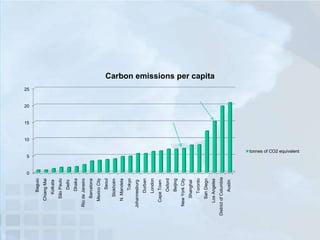
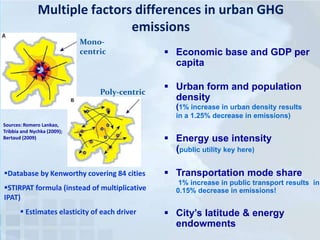
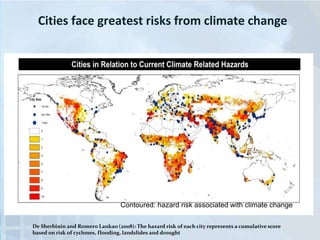
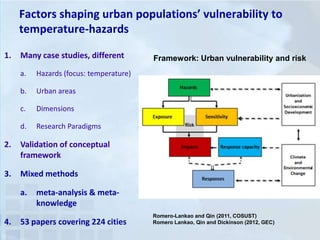
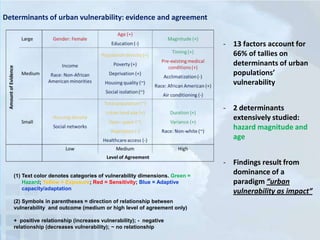
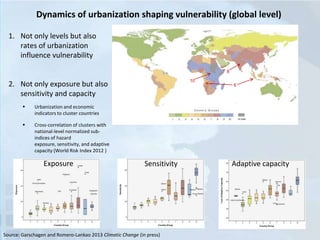
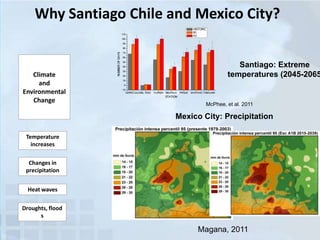
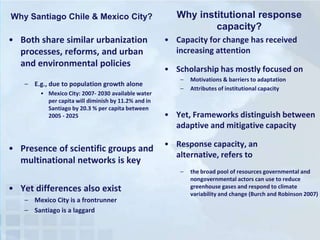
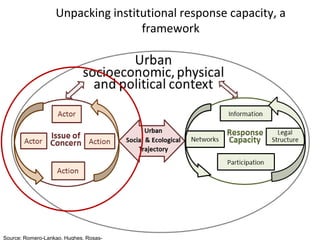
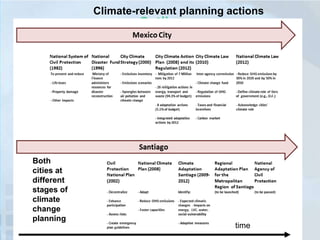
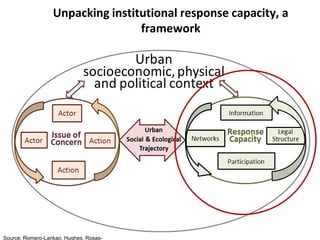
This document discusses enhancing cities' roles in transitioning to sustainability and resilience. It examines the dynamics of urbanization that influence urban emissions, vulnerability and risk. It also looks at cities' institutional capacity to reduce emissions while improving resilience. The document analyzes total and per capita carbon emissions for various cities, finding the largest cities don't always have the largest footprints due to factors like urban form, population density, transportation modes and energy use intensity. It also discusses how cities face different risks from climate change impacts. Finally, the document examines institutional response capacity for climate change in Mexico City and Santiago, Chile, finding they have different administrative structures, use of information, participation mechanisms, opportunities and constraints.
The Codex of Business Writing Software for Real-World Solutions 2.pptx
Lankao csu october 2013
1. How to enhance cities' role in
transitioning to sustainability and
resilience?
Urban Futures NCAR
Paty Romero-Lankao,
Sara Hughes, Dan Runfola, Josh Sperling
2. Urban Futures
Special Issue on Cities
and Climate Change
1. Dynamics of urbanization that shape
urban emissions, vulnerability and risk
2. Cities’ institutional capacity to meet the
challenges of reducing emissions
while improving resilience
CLA for AR4 and AR5
Background report and
chapters 1, 2 and 7
3. Urban mitigation challenges:
The largest cities don't necessarily have the largest carbon
footprints. Why?
Total carbon emissions by city
15.2 M. of people
250
200
19.7 M. of people
150
100
M of tonnes of CO2 e.
50
Source: Romero Lankao (2008)
Los Angeles
Tokyo
New York City
Shanghai
Beijing
Mexico City
London
Seoul
Toronto
Stokholm
Johannesburg
Cape Town
Durban
São Paulo
Delhi
Austin
Rio de Janeiro
District of Columbia
Barcelona
Kolkata
N. Mandela
San Diego
Dhaka
Oxford
Chiang Mai
Baguio
0
4. Austin
District of Columbia
Los Angeles
San Diego
Toronto
Shanghai
New York City
Beijing
Oxford
Cape Town
London
Durban
Johannesburg
Tokyo
N. Mandela
Stokholm
Seoul
Mexico City
Barcelona
Rio de Janeiro
Dhaka
Delhi
São Paulo
Kolkata
Chiang Mai
Baguio
Carbon emissions per capita
25
20
15
10
5
tonnes of CO2 equivalent
0
5. Multiple factors differences in urban GHG
emissions
Monocentric
Poly-centric
Economic base and GDP per
capita
Urban form and population
density
(1% increase in urban density results
in a 1.25% decrease in emissions)
Sources: Romero Lankao,
Tribbia and Nychka (2009);
Bertaud (2009)
Database by Kenworthy covering 84 cities
STIRPAT formula (instead of multiplicative
IPAT)
Estimates elasticity of each driver
Energy use intensity
(public utility key here)
Transportation mode share
1% increase in public transport results in
0.15% decrease in emissions!
City’s latitude & energy
endowments
6. Cities face greatest risks from climate change
Contoured: hazard risk associated with climate change
De Sherbinin and Romero Lankao (2008): The hazard risk of each city represents a cumulative score
based on risk of cyclones, flooding, landslides and drought
7. Factors shaping urban populations’ vulnerability to
temperature-hazards
1.
Many case studies, different
a.
Hazards (focus: temperature)
b.
Urban areas
c.
Dimensions
d.
Framework: Urban vulnerability and risk
Research Paradigms
2.
Validation of conceptual
framework
3.
Mixed methods
a.
4.
meta-analysis & metaknowledge
53 papers covering 224 cities
Romero-Lankao and Qin (2011, COSUST)
Romero Lankao, Qin and Dickinson (2012, GEC)
8. Determinants of urban vulnerability: evidence and agreement
- 13 factors account for
66% of tallies on
determinants of urban
populations’
vulnerability
- 2 determinants
extensively studied:
hazard magnitude and
age
(1) Text color denotes categories of vulnerability dimensions. Green =
Hazard; Yellow = Exposure; Red = Sensitivity; Blue = Adaptive
capacity/adaptation
(2) Symbols in parentheses = direction of relationship between
vulnerability and outcome (medium or high level of agreement only)
+ positive relationship (increases vulnerability); - negative
relationship (decreases vulnerability); ~ no relationship
- Findings result from
dominance of a
paradigm “urban
vulnerability as impact”
9. Dynamics of urbanization shaping vulnerability (global level)
1. Not only levels but also
rates of urbanization
influence vulnerability
8
Country groups
10
2. Not only exposure but also
sensitivity and capacity
Urbanization and economic
indicators to cluster countries
6
Cross-correlation of clusters with
national-level normalized subindices of hazard
exposure, sensitivity, and adaptive
capacity (World Risk Index 2012 )
Exposure
Sensitivity
Source: Garschagen and Romero-Lankao 2013 Climatic Change (in press)
Adaptive capacity
10. Institutional Capacity for Climate
Change Responses in Cities
Patricia Romero-Lankao, Sara Hughes (USA)
Angélica Rosas-Huerta (México), Roxana
Borquez (Chile), Daniel Gnatz,
(USA)
11. Why Santiago Chile and Mexico City?
Climate
and
Environmental
Change
Santiago: Extreme
temperatures (2045-2065
McPhee, et al. 2011
Mexico City: Precipitation
Temperature
increases
Changes in
precipitation
Heat waves
Droughts, flood
s
Magana, 2011
12. Why Santiago Chile & Mexico City?
• Both share similar urbanization
processes, reforms, and urban
and environmental policies
– E.g., due to population growth alone
• Mexico City: 2007- 2030 available water
per capita will diminish by 11.2% and in
Santiago by 20.3 % per capita between
2005 - 2025
• Presence of scientific groups and
multinational networks is key
Why institutional response
capacity?
• Capacity for change has received
increasing attention
• Scholarship has mostly focused on
–
–
• Yet, Frameworks distinguish between
adaptive and mitigative capacity
• Response capacity, an
alternative, refers to
–
• Yet differences also exist
– Mexico City is a frontrunner
– Santiago is a laggard
Motivations & barriers to adaptation
Attributes of institutional capacity
the broad pool of resources governmental and
nongovernmental actors can use to reduce
greenhouse gases and respond to climate
variability and change (Burch and Robinson 2007)
13. Methods: Qualitative analysis
1. Interviews with Government
(City, State, National), Academics, and NGOs/Community
organizers
a)
b)
18 in Mexico City
22 in Santiago
2. Common coding scheme in Nvivo, network analysis
software (UCINet)
3. Supplemented with government reports and academic
studies
17. Administrative Structures and Networks
• Mexico City
• Santiago
• Local (16
delegations), State (35
municipalities), and
Federal authority
• Term limits and political
tension
• Climate plan only for FD
Environmental authorities
• Local (52
communes), and
Federal authority
• Term limits and singleparty rule
-
Don’t interact as frequently with health & energy
Don’t interact at all with housing, urban
development, transportation)
18. Santiago
Cities working networks;
the size of nodes is proportional
to the number of respondents
reporting to work with that actor.
Mexico City exhibits a relatively
more integrated network.
Mexico City
Centralized yet fragmented
administrative structure
Government
NGO
Academic
Private
Supranati
onal
National
State
Local
19. Use of Information
Mexico City
Santiago
• Virtual Climate Change
Center
• Early stages of generation
• Top-down due to
perceived lack of local
capacity
• Want information on
climate scenarios
• Top-down due to
perceived lack of local
capacity
• Want information on
local impacts and
adaptation responses
20. Participation
Mexico City
Santiago
• Authoritarian political
culture (70 years PRI gov.)
• Authoritarian political
culture (Pinochet
dictatorship, techno
neoliberalism)
• Mechanisms in place tend to be technocratic
and paternalistic
• Consultations, pamphlets and guidelines
• Perceptions on this are mixed
• Yet participation in civil protection and
disaster management is more common
21. Opportunities
• Leadership (and political ambition)
• For Mexico City institutionalization of climate into planning
• Presence of
– Influential scientific groups
– Non-governmental and international organizations
– Participation of local authorities in transnational networks
• Longer-term tradition of disaster management (although
reactive)
22. Constraints
• Centralized yet fragmented administrative
structure inhibits effective coordination
• Technocratic and top-down approach to
information sharing inhibits learning and
informed policy making at the city level
• Limited existing mechanisms for participation in
decision making transfer to climate change
planning
• Economic policies and efficiency dominate