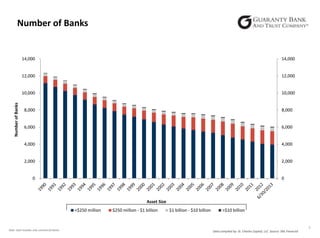
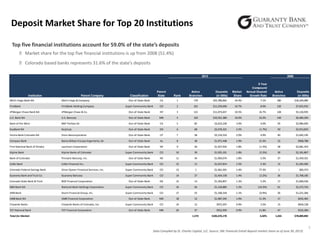
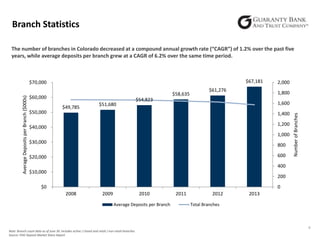
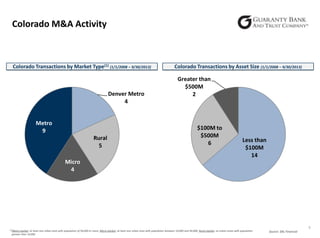
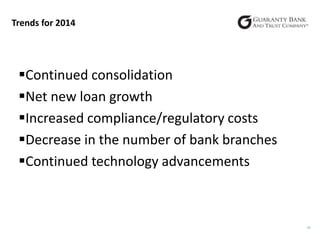
“In general, the environment for banking in
the next five to ten years is likely to remain
favorable.”
Source: “Future of Banking in America”, FDIC Banking Review, Volume 16, No, 1

1
“In general, the environment for banking in
the next five to ten years is likely to remain
favorable.”
Source: “Future of Banking in America”, FDIC Banking Review, Volume 16, No, 1

2004

2
Number of Banks

14,000

12,000

12,000

10,000

10,000

8,000

8,000

6,000

6,000

4,000

4,000

2,000

Number of Banks

14,000

2,000

0

0

Asset Size
<$250 million

Note: Date includes only commercial banks

$250 million - $1 billion

$1 billion - $10 billion

>$10 billion

3
Data compiled by: St. Charles Capital, LLC Source: SNL Financial
2013 Colorado Deposit Market Share
Super
Community
Banks
20.1%

Out-of-State
Banks
68.4%

Community
Banks
5.2%

Small
Community
Banks
6.4%

Community Banks

2013
Total
Deposits

2008
Total
Deposits

5 - Year
Deposit
CAGR

2013
Number
of Branches

2013
Deposits
per Branch

Out-of-State Banks

$72,260,486

$52,142,050

6.74%

1,027

$70,361

Super Community Banks

$21,197,674

$17,207,080

4.26%

272

$77,933

Community Banks

$5,506,562

$4,064,056

6.26%

98

$56,189

Small Community Banks

$6,711,448

$5,476,706

4.15%

176

$38,133

6.02%

1,573

$67,181

Total

$105,676,170

$78,889,892

(1)

4
(1) Total includes closures, liquidations and other transactions
Note: 2008 segmentation was determined based upon 2013 financial data

Data compiled by: St. Charles Capital, LLC Source: SNL Financial
Deposit Market Share for Top 20 Institutions
Top five financial institutions account for 59.0% of the state’s deposits
  Market share for the top five financial institutions is up from 2008 (51.4%)
  Colorado based banks represents 31.6% of the state’s deposits
2013

Institution

Parent Company

2008

Parent
State

Rank

Active
Branches

Out-of-State Bank

CA

1

170

$25,780,962

24.4%

7.1%

186

$18,324,085

Super Community Bank

CO

2

101

$11,259,690

10.7%

8.0%

120

$7,655,933

Classification

Deposits
(in 000s)

Market
Share

5 Year
Compound
Annual Deposit
Growth Rate

Active
Branches

Deposits
(in 000s)

Wells Fargo Bank NA

Wells Fargo & Company

FirstBank

FirstBank Holding Company

JPMorgan Chase Bank NA

JPMorgan Chase & Co.

Out-of-State Bank

NY

3

121

$11,073,657

10.5%

16.7%

128

$5,126,935

U.S. Bank NA

U.S. Bancorp

Out-of-State Bank

MN

4

162

$10,561,380

10.0%

10.2%

149

$6,484,294

Bank of the West

BNP Paribas SA

Out-of-State Bank

CA

5

82

$3,633,230

3.4%

4.0%

93

$2,984,695

KeyBank NA

KeyCorp

Out-of-State Bank

OH

6

68

$2,676,321

2.5%

(1.7%)

50

$2,913,833

Vectra Bank Colorado NA

Zions Bancorporation

Out-of-State Bank

UT

7

38

$2,154,510

2.0%

4.9%

40

$1,692,145

Compass Bank

Banco Bilbao Vizcaya Argentaria, SA

Out-of-State Bank

AL

8

38

$1,971,448

1.9%

15.3%

33

$968,788

First National Bank of Omaha

Lauritzen Corporation

Alpine Bank

Alpine Banks of Colorado

Bank of Colorado

Pinnacle Bancorp, Inc.

CoBiz Bank

CoBiz Financial Inc.

Colorado Federal Savings Bank

Silver Queen Financial Services, Inc.

Guaranty Bank and Trust Co.

Guaranty Bancorp

Colorado State Bank & Trust

BOK Financial Corporation

NBH Bank NA

National Bank Holdings Corporation

ANB Bank

Sturm Financial Group, Inc.

UMB Bank NA

UMB Financial Corporation

Citywide Banks

Citywide Banks of Colorado, Inc.

TCF National Bank

TCF Financial Corporation

Total for Market:

Out-of-State Bank

NE

9

26

$1,927,932

1.8%

(1.5%)

28

$2,081,353

Super Community Bank

CO

10

39

$1,925,101

1.8%

(2.5%)

39

$2,181,867

Out-of-State Bank

NE

11

34

$1,903,074

1.8%

5.5%

37

$1,459,321

Super Community Bank

CO

12

11

$1,637,814

1.5%

5.3%

13

$1,265,585

Super Community Bank

CO

13

1

$1,461,501

1.4%

77.3%

1

$83,373

Super Community Bank

CO

14

27

$1,454,158

1.4%

(3.2%)

36

$1,708,185

Out-of-State Bank

OK

15

13

$1,363,857

1.3%

5.2%

17

$1,060,526

Super Community Bank

CO

16

56

$1,318,885

1.2%

(10.3%)

61

$2,272,743

Super Community Bank

CO

17

25

$1,168,318

1.1%

(0.9%)

26

$1,221,266

Out-of-State Bank

MO

18

12

$1,087,345

1.0%

11.3%

17

$635,365

Super Community Bank

CO

19

12

$972,207

0.9%

3.5%

15

$818,128

Out-of-State Bank

MN

20

37

$912,959

0.9%

11.8%

47

$522,284

1,573

$105,676,170

6.02%

1,655

$78,889,892

Data Compiled by St. Charles Capital, LLC Source: SNL Financial (retail deposit market share as of June 30, 2013)

5
Profitability
Return on Average Assets
Super Community Banks
Community Banks
Small Community Banks
All U.S. Commercial Banks Average

YTD 9/30/13
0.99%
0.67%
0.58%
1.07%

2012
0.96%
0.46%
0.53%

2011
1.20%
0.01%
0.31%

2010
0.65%
(0.05%)
0.03%

1.02%

0.91%

0.65%

2012
8.76%
4.61%
4.90%

2011
12.10%
0.05%
2.95%

2010
8.79%
(0.55%)
0.31%

9.06%

8.11%

5.94%

2012
3.77%
3.68%
3.85%

2011
4.07%
3.87%
3.98%

2010
5.26%
3.82%
3.93%

3.36%

3.52%

3.63%

2012
63.2%
82.4%
79.1%

2011
57.6%
81.1%
70.4%

2010
58.8%
77.3%
71.2%

61.4%

60.7%

56.7%

Return on Average Equity
Super Community Banks
Community Banks
Small Community Banks
All U.S. Commercial Banks Average

YTD 9/30/13
9.27%
6.76%
5.41%
9.51%

Net Interest Margin
Super Community Banks
Community Banks
Small Community Banks
All U.S. Commercial Banks Average

YTD 9/30/13
3.53%
3.57%
3.70%
3.20%

Efficiency Ratio
Super Community Banks
Community Banks
Small Community Banks
All U.S. Commercial Banks Average

YTD 9/30/13
63.2%
77.6%
78.1%
60.1%

6
Data Compiled by: St. Charles Capital, LLC Source: SNL Financial
Profitability by Segment
Loan Composition
As of 9/30/2013

Super Community Banks
Community Banks
Small Community Banks
All U.S. Commercial Banks Average

Loa
5 Year Loan
Compound
Annual Growth
Rate
13.59%
1.24%
(0.77%)
0.64%

Construction &
Land Commercial Real
Development/
Estate/
Total Loans
Total Loans
7.40%
29.32%
10.43%
36.65%
7.30%
29.81%
2.68%

13.92%

Real Estate/
Total Loans
85.90%
75.33%
78.32%
49.17%

Commercial &
Industrial/
Total Loans
9.82%
15.48%
10.14%
18.24%

Asset Quality
As of 9/30/2013

Super Community Banks
Community Banks
Small Community Banks
All U.S. Commercial Banks Average

Non-Performing Non-Performing
Loans/
Assets/
Total Loans
Total Assets
1.28%
1.12%
2.44%
2.82%
2.05%
2.47%
2.85%

1.72%

Loan Reserves/
Loan Reserves/ Non-Performing
Total Loans
Loans
1.43%
111.29%
1.81%
74.36%
1.80%
87.72%
1.86%

65.17%

YTD NCOs/
Ave. Loans
0.16%
0.40%
0.23%
0.80%

Deposit Composition
As of 9/30/2013

Super Community Banks
Community Banks
Small Community Banks
All U.S. Commercial Banks Average

Depo
5 Year Deposit
Compound
Annual Growth
Rate
23.38%
7.33%
4.76%
5.62%

Non-Interest
Bearing
Deposits/Total
Deposits
28.22%
22.00%
20.72%
25.38%

Time
Deposits/Total
Deposits
17.34%
27.02%
33.61%
13.92%

Brokered
Deposits/Total Cost of Interest
Deposits Bearing Deposits
1.11%
0.33%
4.86%
0.46%
1.25%
0.54%
6.39%

0.40%
7

Data Compiled by: St. Charles Capital, LLC Source: SNL Financial
Branch Statistics
The number of branches in Colorado decreased at a compound annual growth rate (“CAGR”) of 1.2% over the past five
years, while average deposits per branch grew at a CAGR of 6.2% over the same time period.

$67,181
$58,635

$60,000
$50,000

$49,785

$51,680

$61,276

2,000

1,800

$54,823

1,600

1,400
1,200

$40,000

1,000
$30,000

800
600

$20,000

Number of Branches

Average Deposits per Branch ($000s)

$70,000

400
$10,000

200

$0

0
2008

2009

2010
Average Deposits per Branch

2011

2012

2013

Total Branches

8
Note: Branch count data as of June 30. Includes active / closed and retail / non-retail branches
Source: FDIC Deposit Market Share Report
Colorado M&A Activity

Colorado Transactions by Market Type(1) (1/1/2008 – 9/30/2013)

Denver Metro
4
Metro
9
Rural
5

Colorado Transactions by Asset Size (1/1/2008 – 9/30/2013)

Greater than
$500M
2

$100M to
$500M
6

Less than
$100M
14

Micro
4

(1)Metro

market: at least one urban area with population of 50,000 or more; Micro market: at least one urban area with population between 10,000 and 50,000; Rural market: no urban areas with population
greater than 10,000

9
Source: SNL Financial
Trends for 2014

Continued consolidation
Net new loan growth
Increased compliance/regulatory costs
Decrease in the number of bank branches
Continued technology advancements

10

Colorado Banking Trends

  • 1.
    “In general, theenvironment for banking in the next five to ten years is likely to remain favorable.” Source: “Future of Banking in America”, FDIC Banking Review, Volume 16, No, 1 1
  • 2.
    “In general, theenvironment for banking in the next five to ten years is likely to remain favorable.” Source: “Future of Banking in America”, FDIC Banking Review, Volume 16, No, 1 2004 2
  • 3.
    Number of Banks 14,000 12,000 12,000 10,000 10,000 8,000 8,000 6,000 6,000 4,000 4,000 2,000 Numberof Banks 14,000 2,000 0 0 Asset Size <$250 million Note: Date includes only commercial banks $250 million - $1 billion $1 billion - $10 billion >$10 billion 3 Data compiled by: St. Charles Capital, LLC Source: SNL Financial
  • 4.
    2013 Colorado DepositMarket Share Super Community Banks 20.1% Out-of-State Banks 68.4% Community Banks 5.2% Small Community Banks 6.4% Community Banks 2013 Total Deposits 2008 Total Deposits 5 - Year Deposit CAGR 2013 Number of Branches 2013 Deposits per Branch Out-of-State Banks $72,260,486 $52,142,050 6.74% 1,027 $70,361 Super Community Banks $21,197,674 $17,207,080 4.26% 272 $77,933 Community Banks $5,506,562 $4,064,056 6.26% 98 $56,189 Small Community Banks $6,711,448 $5,476,706 4.15% 176 $38,133 6.02% 1,573 $67,181 Total $105,676,170 $78,889,892 (1) 4 (1) Total includes closures, liquidations and other transactions Note: 2008 segmentation was determined based upon 2013 financial data Data compiled by: St. Charles Capital, LLC Source: SNL Financial
  • 5.
    Deposit Market Sharefor Top 20 Institutions Top five financial institutions account for 59.0% of the state’s deposits   Market share for the top five financial institutions is up from 2008 (51.4%)   Colorado based banks represents 31.6% of the state’s deposits 2013 Institution Parent Company 2008 Parent State Rank Active Branches Out-of-State Bank CA 1 170 $25,780,962 24.4% 7.1% 186 $18,324,085 Super Community Bank CO 2 101 $11,259,690 10.7% 8.0% 120 $7,655,933 Classification Deposits (in 000s) Market Share 5 Year Compound Annual Deposit Growth Rate Active Branches Deposits (in 000s) Wells Fargo Bank NA Wells Fargo & Company FirstBank FirstBank Holding Company JPMorgan Chase Bank NA JPMorgan Chase & Co. Out-of-State Bank NY 3 121 $11,073,657 10.5% 16.7% 128 $5,126,935 U.S. Bank NA U.S. Bancorp Out-of-State Bank MN 4 162 $10,561,380 10.0% 10.2% 149 $6,484,294 Bank of the West BNP Paribas SA Out-of-State Bank CA 5 82 $3,633,230 3.4% 4.0% 93 $2,984,695 KeyBank NA KeyCorp Out-of-State Bank OH 6 68 $2,676,321 2.5% (1.7%) 50 $2,913,833 Vectra Bank Colorado NA Zions Bancorporation Out-of-State Bank UT 7 38 $2,154,510 2.0% 4.9% 40 $1,692,145 Compass Bank Banco Bilbao Vizcaya Argentaria, SA Out-of-State Bank AL 8 38 $1,971,448 1.9% 15.3% 33 $968,788 First National Bank of Omaha Lauritzen Corporation Alpine Bank Alpine Banks of Colorado Bank of Colorado Pinnacle Bancorp, Inc. CoBiz Bank CoBiz Financial Inc. Colorado Federal Savings Bank Silver Queen Financial Services, Inc. Guaranty Bank and Trust Co. Guaranty Bancorp Colorado State Bank & Trust BOK Financial Corporation NBH Bank NA National Bank Holdings Corporation ANB Bank Sturm Financial Group, Inc. UMB Bank NA UMB Financial Corporation Citywide Banks Citywide Banks of Colorado, Inc. TCF National Bank TCF Financial Corporation Total for Market: Out-of-State Bank NE 9 26 $1,927,932 1.8% (1.5%) 28 $2,081,353 Super Community Bank CO 10 39 $1,925,101 1.8% (2.5%) 39 $2,181,867 Out-of-State Bank NE 11 34 $1,903,074 1.8% 5.5% 37 $1,459,321 Super Community Bank CO 12 11 $1,637,814 1.5% 5.3% 13 $1,265,585 Super Community Bank CO 13 1 $1,461,501 1.4% 77.3% 1 $83,373 Super Community Bank CO 14 27 $1,454,158 1.4% (3.2%) 36 $1,708,185 Out-of-State Bank OK 15 13 $1,363,857 1.3% 5.2% 17 $1,060,526 Super Community Bank CO 16 56 $1,318,885 1.2% (10.3%) 61 $2,272,743 Super Community Bank CO 17 25 $1,168,318 1.1% (0.9%) 26 $1,221,266 Out-of-State Bank MO 18 12 $1,087,345 1.0% 11.3% 17 $635,365 Super Community Bank CO 19 12 $972,207 0.9% 3.5% 15 $818,128 Out-of-State Bank MN 20 37 $912,959 0.9% 11.8% 47 $522,284 1,573 $105,676,170 6.02% 1,655 $78,889,892 Data Compiled by St. Charles Capital, LLC Source: SNL Financial (retail deposit market share as of June 30, 2013) 5
  • 6.
    Profitability Return on AverageAssets Super Community Banks Community Banks Small Community Banks All U.S. Commercial Banks Average YTD 9/30/13 0.99% 0.67% 0.58% 1.07% 2012 0.96% 0.46% 0.53% 2011 1.20% 0.01% 0.31% 2010 0.65% (0.05%) 0.03% 1.02% 0.91% 0.65% 2012 8.76% 4.61% 4.90% 2011 12.10% 0.05% 2.95% 2010 8.79% (0.55%) 0.31% 9.06% 8.11% 5.94% 2012 3.77% 3.68% 3.85% 2011 4.07% 3.87% 3.98% 2010 5.26% 3.82% 3.93% 3.36% 3.52% 3.63% 2012 63.2% 82.4% 79.1% 2011 57.6% 81.1% 70.4% 2010 58.8% 77.3% 71.2% 61.4% 60.7% 56.7% Return on Average Equity Super Community Banks Community Banks Small Community Banks All U.S. Commercial Banks Average YTD 9/30/13 9.27% 6.76% 5.41% 9.51% Net Interest Margin Super Community Banks Community Banks Small Community Banks All U.S. Commercial Banks Average YTD 9/30/13 3.53% 3.57% 3.70% 3.20% Efficiency Ratio Super Community Banks Community Banks Small Community Banks All U.S. Commercial Banks Average YTD 9/30/13 63.2% 77.6% 78.1% 60.1% 6 Data Compiled by: St. Charles Capital, LLC Source: SNL Financial
  • 7.
    Profitability by Segment LoanComposition As of 9/30/2013 Super Community Banks Community Banks Small Community Banks All U.S. Commercial Banks Average Loa 5 Year Loan Compound Annual Growth Rate 13.59% 1.24% (0.77%) 0.64% Construction & Land Commercial Real Development/ Estate/ Total Loans Total Loans 7.40% 29.32% 10.43% 36.65% 7.30% 29.81% 2.68% 13.92% Real Estate/ Total Loans 85.90% 75.33% 78.32% 49.17% Commercial & Industrial/ Total Loans 9.82% 15.48% 10.14% 18.24% Asset Quality As of 9/30/2013 Super Community Banks Community Banks Small Community Banks All U.S. Commercial Banks Average Non-Performing Non-Performing Loans/ Assets/ Total Loans Total Assets 1.28% 1.12% 2.44% 2.82% 2.05% 2.47% 2.85% 1.72% Loan Reserves/ Loan Reserves/ Non-Performing Total Loans Loans 1.43% 111.29% 1.81% 74.36% 1.80% 87.72% 1.86% 65.17% YTD NCOs/ Ave. Loans 0.16% 0.40% 0.23% 0.80% Deposit Composition As of 9/30/2013 Super Community Banks Community Banks Small Community Banks All U.S. Commercial Banks Average Depo 5 Year Deposit Compound Annual Growth Rate 23.38% 7.33% 4.76% 5.62% Non-Interest Bearing Deposits/Total Deposits 28.22% 22.00% 20.72% 25.38% Time Deposits/Total Deposits 17.34% 27.02% 33.61% 13.92% Brokered Deposits/Total Cost of Interest Deposits Bearing Deposits 1.11% 0.33% 4.86% 0.46% 1.25% 0.54% 6.39% 0.40% 7 Data Compiled by: St. Charles Capital, LLC Source: SNL Financial
  • 8.
    Branch Statistics The numberof branches in Colorado decreased at a compound annual growth rate (“CAGR”) of 1.2% over the past five years, while average deposits per branch grew at a CAGR of 6.2% over the same time period. $67,181 $58,635 $60,000 $50,000 $49,785 $51,680 $61,276 2,000 1,800 $54,823 1,600 1,400 1,200 $40,000 1,000 $30,000 800 600 $20,000 Number of Branches Average Deposits per Branch ($000s) $70,000 400 $10,000 200 $0 0 2008 2009 2010 Average Deposits per Branch 2011 2012 2013 Total Branches 8 Note: Branch count data as of June 30. Includes active / closed and retail / non-retail branches Source: FDIC Deposit Market Share Report
  • 9.
    Colorado M&A Activity ColoradoTransactions by Market Type(1) (1/1/2008 – 9/30/2013) Denver Metro 4 Metro 9 Rural 5 Colorado Transactions by Asset Size (1/1/2008 – 9/30/2013) Greater than $500M 2 $100M to $500M 6 Less than $100M 14 Micro 4 (1)Metro market: at least one urban area with population of 50,000 or more; Micro market: at least one urban area with population between 10,000 and 50,000; Rural market: no urban areas with population greater than 10,000 9 Source: SNL Financial
  • 10.
    Trends for 2014 Continuedconsolidation Net new loan growth Increased compliance/regulatory costs Decrease in the number of bank branches Continued technology advancements 10