SlideShare a Scribd company logo
Activities for
Class XII
24/04/18
The basic principles of learning mathematics are :
(a) learning should be related to each child individually
(b) the need for mathematics should develop from an
intimate acquaintance with the environment (c) the child
should be active and interested, (d) concrete material and
wide variety of illustrations are needed to aid the learning
process (e) understanding should be encouraged at each
stage of acquiring a particular skill (f) content should be
broadly based with adequate appreciation of the links
between the various branches of mathematics, (g) correct
mathematical usage should be encouraged at all stages.
– Ronwill
24/04/18
METHOD OF CONSTRUCTION
Take a piece of plywood and paste a white paper on it. Fix the wires randomly
on the plywood with the help of nails such that some of them are parallel,
some are perpendicular to each other and some are inclined as shown in
Fig.1.
OBJECTIVE MATERIALREQUIRED
To verify that the relation R in the set
L of all lines in a plane, defined by
R = {(l, m) : l ⊥ m} is symmetric but
neither reflexive nor transitive.
A piece of plywood, some pieces of
wires(8),nails,whitepaper, glueetc.
Activity 1
DEMONSTRATION
1. Let the wires represent the lines l1
, l2
, ..., l8
.
2. l1
is perpendicular to each of the lines l2
, l3
, l4
. [see Fig. 1]
24/04/18
102 Laboratory Manual
3. l6
is perpendicular to l7
.
4. l2
is parallel to l3
, l3
is parallel to l4
and l5
is parallel to l8
.
5. (l1
, l2
), (l1
, l3
), (l1
, l4
), (l6
, l7
) ∈ R
OBSERVATION
1. In Fig. 1, no line is perpendicular to itself, so the relation
R = {( l, m) : l ⊥ m} ______ reflexive (is/is not).
2. In Fig. 1, 1 2l l⊥ . Is l2
⊥ l1
? ______ (Yes/No)
∴ ( l1
, l2
) ∈ R ⇒ ( l2
, l1
) ______ R (∉/∈)
Similarly, l3
⊥ l1
. Is l1
⊥ l3
? _______ (Yes/No)
∴ ( l3
, l1
) ∈ R ⇒ ( l1
, l3
) ______ R (∉/∈)
Also, l6
⊥ l7
. Is l7
⊥ l6
? _______ (Yes/No)
∴ ( l6
, l7
) ∈ R ⇒ ( l7
, l6
) ______ R (∉/∈)
∴ The relation R .... symmetric (is/is not)
3. In Fig. 1, l2
⊥ l1
and l1
⊥ l3
. Is l2
⊥ l3
? ... (Yes/No)
i.e., (l2
, l1
) ∈ R and (l1
, l3
) ∈ R ⇒ (l2
, l3
) ______ R (∉/∈)
∴ The relation R .... transitive (is/is not).
APPLICATION
This activity can be used to check whether a
given relation is an equivalence relation or
not.
NOTE
1. In this case, the relation is
not an equivalence relation.
2. The activity can be repeated
by taking some more wire in
different positions.
24/04/18
METHOD OF CONSTRUCTION
Take a piece of plywood of convenient size and paste a white paper on it. Fix
the wires randomly on the plywood with the help of nails such that some of
them are parallel, some are perpendicular to each other and some are inclined
as shown in Fig. 2.
OBJECTIVE MATERIAL REQUIRED
To verify that the relation R in the set
L of all lines in a plane, defined by
R = {( l, m) : l|| m} is an equivalence
relation.
A piece of plywood, some pieces of
wire(8),plywood,nails,whitepaper,
glue.
Activity 2
DEMONSTRATION
1. Let the wires represent the lines l1
, l2
, ..., l8
.
2. l1
is perpendicular to each of the lines l2
, l3
, l4
(see Fig. 2).
24/04/18
104 Laboratory Manual
3. l6
is perpendicular to l7
.
4. l2
is parallel to l3
, l3
is parallel to l4
and l5
is parallel to l8
.
5. (l2
, l3
), (l3
, l4
), (l5
, l8
), ∈ R
OBSERVATION
1. In Fig. 2, every line is parallel to itself. So the relation R = {( l, m) : l|| m}
.... reflexive relation (is/is not)
2. In Fig. 2, observe that 2 3l l . Is l3
... l2
? (|| / || )
So, (l2
, l3
) ∈ R ⇒ (l3
, l2
) ... R (∉/∈)
Similarly, l3
|| l4
. Is l4
...l3
? (|| / || )
So, (l3
, l4
) ∈ R ⇒ (l4
, l3
) ... R (∉/∈)
and (l5
, l8
) ∈ R ⇒ (l8
, l5
) ... R (∉/∈)
∴ The relation R ... symmetric relation (is/is not)
3. In Fig. 2, observe that l2
|| l3
and l3
|| l4
. Is l2
... l4
? (|| / || )
So, (l2
, l3
) ∈ R and (l3
, l4
) ∈ R ⇒ (l2
, l4
) ... R (∈/∉)
Similarly, l3
|| l4
and l4
|| l2
. Is l3
... l2
? (|| / || )
So, (l3
, l4
) ∈ R, (l4
, l2
) ∈ R ⇒ (l3
, l2
) ... R (∈,∉)
Thus, the relation R ... transitive relation (is/is not)
Hence, the relation R is reflexive, symmetric and transitive. So, R is an
equivalence relation.
APPLICATION
This activity is useful in understanding the
concept of an equivalence relation.
This activity can be repeated
by taking some more wires
in different positions.
NOTE
24/04/18
METHOD OF CONSTRUCTION
1. Paste a plastic strip on the left hand side of the cardboard and fix three nails
on it as shown in the Fig.3.1. Name the nails on the strip as 1, 2 and 3.
2. Paste another strip on the right hand side of the cardboard and fix two nails in
the plastic strip as shown in Fig.3.2. Name the nails on the strip as a and b.
3. Join nails on the left strip to the nails on the right strip as shown in Fig. 3.3.
OBJECTIVE MATERIAL REQUIRED
To demonstrate a function which is
not one-one but is onto.
Cardboard, nails, strings, adhesive
and plastic strips.
Activity 3
DEMONSTRATION
1. Take the set X = {1, 2, 3}
2. Take the set Y = {a, b}
3. Join (correspondence) elements of X to the elements of Y as shown in Fig. 3.3
OBSERVATION
1. The image of the element 1 of X in Y is __________.
The image of the element 2 of X in Y is __________.
24/04/18
106 Laboratory Manual
The image of the element 3 of X in Y is __________.
So, Fig. 3.3 represents a __________ .
2. Every element in X has a _________ image in Y. So, the function is
_________(one-one/not one-one).
3. The pre-image of each element of Y in X _________ (exists/does not exist).
So, the function is ________ (onto/not onto).
APPLICATION
This activity can be used to demonstrate the
concept of one-one and onto function.
Demonstrate the same
activity by changing the
number of the elements of
the sets X and Y.
NOTE
24/04/18
METHOD OF CONSTRUCTION
1. Paste a plastic strip on the left hand side of the cardboard and fix two nails
in it as shown in the Fig. 4.1. Name the nails as a and b.
2. Paste another strip on the right hand side of the cardboard and fix three
nails on it as shown in the Fig. 4.2. Name the nails on the right strip as
1, 2 and 3.
3. Join nails on the left strip to the nails on the right strip as shown in the Fig. 4.3.
OBJECTIVE MATERIALREQUIRED
To demonstrate a function which is
one-one but not onto.
Cardboard, nails, strings, adhesive
and plastic strips.
Activity 4
DEMONSTRATION
1. Take the set X = {a, b}
2. Take the set Y = {1, 2, 3}.
3. Join elements of X to the elements of Y as shown in Fig. 4.3.
24/04/18
108 Laboratory Manual
OBSERVATION
1. The image of the element a of X in Y is ______________.
The image of the element b of X in Y is ______________.
So, the Fig. 4.3 represents a _____________________.
2. Every element in X has a _________ image in Y. So, the function is
_____________ (one-one/not one-one).
3. The pre-image of the element 1 of Y in X __________ (exists/does not
exist). So, the function is __________ (onto/not onto).
Thus, Fig. 4.3 represents a function which is _________ but not onto.
APPLICATION
This activity can be used to demonstrate the concept of one-one but not onto
function.
24/04/18
METHOD OF CONSTRUCTION
1. Take a cardboard of suitable dimensions, say, 30 cm × 30 cm.
2. On the cardboard, paste a white chart paper of size 25 cm × 25 cm (say).
3. On the paper, draw two lines, perpendicular to each other and name them
X′OX and YOY′ as rectangular axes [see Fig. 5].
OBJECTIVE MATERIALREQUIRED
To draw the graph of 1
sin x−
, using the
graph of sin x and demonstrate the
concept of mirror reflection (about
the line y = x).
Cardboard, white chart paper, ruler,
coloured pens, adhesive, pencil,
eraser, cutter, nails and thin wires.
Activity 5
24/04/18
110 Laboratory Manual
4. Graduate the axes approximately as shown in Fig. 5.1 by taking unit on
X-axis = 1.25 times the unit of Y-axis.
5. Mark approximately the points
,sin , ,sin , ... , ,sin
6 6 4 4 2 2
π π π π π π     
     
     
in the coordinate plane and at each
point fix a nail.
6. Repeat the above process on the other side of the x-axis, marking the points
– – – – – –
,sin , ,sin , ... , ,sin
6 6 4 4 2 2
π π π π π π     
     
     
approximately and fix nails
on these points as N1
′, N2
′, N3
′, N4
′. Also fix a nail at O.
7. Join the nails with the help of a tight wire on both sides of x-axis to get the
graph of sin x from
–
to
2 2
π π
.
8. Draw the graph of the line y = x (by plotting the points (1,1), (2, 2), (3, 3), ...
etc. and fixing a wire on these points).
9. From the nails N1
, N2
, N3
,N4
, draw perpendicular on the line y = x and produce
these lines such that length of perpendicular on both sides of the line y = x
are equal. At these points fix nails, I1
,I2
,I3
,I4
.
10. Repeat the above activity on the other side of X- axis and fix nails at I1
′,I2
′,I3
′,I4
′.
11. Join the nails on both sides of the line y = x by a tight wire that will show the
graph of 1
siny x−
= .
DEMONSTRATION
Put a mirror on the line y = x. The image of the graph of sin x in the mirror will
represent the graph of 1
sin x−
showing that sin–1
x is mirror reflection of sin x
and vice versa.
24/04/18
Mathematics 111
OBSERVATION
The image of point N1
in the mirror (the line y = x) is _________.
The image of point N2
in the mirror (the line y = x) is _________.
The image of point N3
in the mirror (the line y = x) is _________.
The image of point N4
in the mirror (the line y = x) is _________.
The image of point 1N′ in the mirror (the line y = x) is _________.
The image point of 2N′ in the mirror (the line y = x) is _________.
The image point of 3N′ in the mirror (the line y = x) is _________.
The image point of 4N′ in the mirror (the line y = x) is _________.
The image of the graph of six x in y = x is the graph of _________, and the
image of the graph of sin–1
x in y = x is the graph of __________.
APPLICATION
Similar activity can be performed for drawing the graphs of –1 1
cos , tanx x−
, etc.
24/04/18
METHOD OF CONSTRUCTION
1. Take a cardboard of a convenient size and paste a white chart paper on it.
2. Draw a unit circle with centre O on it.
3. Through the centre of the circle, draw two perpendicular lines X′OX and
YOY′ representing x-axis and y-axis, respectively as shown in Fig. 6.1.
4. Mark the points A, C, B and D, where the circle cuts the x-axis and y-axis,
respectively as shown in Fig. 6.1.
5. Fix two rails on opposite
sides of the cardboard
which are parallel to
y-axis. Fix one steel wire
between the rails such
that the wire can be
moved parallel to x-axis
as shown in Fig. 6.2.
OBJECTIVE MATERIAL REQUIRED
To explore the principal value of
the function sin–1
x using a unit
circle.
Cardboard, white chart paper, rails,
ruler, adhesive, steel wires and
needle.
Activity 6
24/04/18
Mathematics 113
6. Take a needle of unit
length. Fix one end of
it at the centre of the
circle and the other
end to move freely
along the circle
Fig. 6.2.
DEMONSTRATION
1. Keep the needle at an
arbitrary angle, say x1
with the positive direction of x-axis. Measure of angle in radian is equal to
the length of intercepted arc of the unit circle.
2. Slide the steel wire between the rails, parallel to x-axis such that the wire
meets with free end of the needle (say P1
) (Fig. 6.2).
3. Denote the y-coordinate of the point P1
as y1
, where y1
is the perpendicular
distance of steel wire from the x-axis of the unit circle giving y1
= sin x1
.
4. Rotate the needle further anticlockwise and keep it at the angle π – x1
. Find
the value of y-coordinate of intersecting point P2
with the help of sliding
steel wire. Value of y-coordinate for the points P1
and P2
are same for the
different value of angles, y1
= sinx1
and y1
= sin (π – x1
). This demonstrates
that sine function is not one-to-one for angles considered in first and second
quadrants.
5. Keep the needle at angles – x1
and (– π + x1
), respectively. By sliding down
the steel wire parallel to x-axis, demonstrate that y-coordinate for the points
P3
and P4
are the same and thus sine function is not one-to-one for points
considered in 3rd and 4th quadrants as shown in Fig. 6.2.
24/04/18
114 Laboratory Manual
6. However, the y-coordinate
of the points P3
and P1
are
different. Move the needle
in anticlockwise direction
starting from
2
π
− to
2
π
and
look at the behaviour of
y-coordinates of points P5
,
P6
, P7
and P8
by sliding the
steel wire parallel to
x-axis accordingly. y-co-
ordinate of points P5
, P6
, P7
and P8
are different (see
Fig. 6.3). Hence, sine
function is one-to-one in
the domian ,
2 2
π π 
−  
and its range lies between – 1 and 1.
7. Keep the needle at any arbitrary angle say θ lying in the interval ,
2 2
π π 
−  
and denote the y-coordi-
nate of the intersecting
point P9
as y. (see Fig. 6.4).
Then y = sin θ or θ = arc
sin–1
y) as sine function is
one-one and onto in the
domain ,
2 2
π π 
−  
and
range [–1, 1]. So, its
inverse arc sine function
exist. The domain of arc
sine function is [–1, 1] and
Fig. 6.4
24/04/18
Mathematics 115
range is ,
2 2
π π 
−  
. This range is called the principal value of arc sine
function (or sin–1
function).
OBSERVATION
1. sine function is non-negative in _________ and __________ quadrants.
2. For the quadrants 3rd and 4th, sine function is _________.
3. θ = arc sin y ⇒ y = ________ θ where
2
π
− ≤ θ ≤ ________.
4. The other domains of sine function on which it is one-one and onto provides
_________ for arc sine function.
APPLICATION
This activity can be used for finding the principal value of arc cosine function
(cos–1
y).
24/04/18
METHOD OF CONSTRUCTION
1. On the drawing board, fix a thick paper sheet of convenient size 20 cm × 20 cm
(say) with adhesive.
OBJECTIVE MATERIAL REQUIRED
To sketch the graphs of ax
and loga
x,
a > 0, a ≠ 1 and to examine that they
are mirror images of each other.
Drawing board, geometrical instru-
ments, drawing pins, thin wires,
sketch pens, thick white paper,
adhesive, pencil, eraser, a plane
mirror, squared paper.
Activity 7
Fig. 7
24/04/18
Mathematics 117
2. On the sheet, take two perpendicular lines XOX′ and YOY′, depicting
coordinate axes.
3. Mark graduations on the two axes as shown in the Fig. 7.
4. Find some ordered pairs satisfying y = ax
and y = loga
x. Plot these points
corresponding to the ordered pairs and join them by free hand curves in
both the cases. Fix thin wires along these curves using drawing pins.
5. Draw the graph of y = x, and fix a wire along the graph, using drawing pins.
DEMONSTRATION
1. For ax
, take a = 2 (say), and find ordered pairs satisfying it as
x 0 1 –1 2 –2 3 –3
1
2
–
1
2
4
2x
1 2 0.5 4
1
4
8
1
8
1.4 0.7 16
and plot these ordered pairs on the squared paper and fix a drawing pin at
each point.
2. Join the bases of drawing pins with a thin wire. This will represent the graph
of 2x
.
3. log2
x = y gives 2y
x= . Some ordered pairs satisfying it are:
x 1 2
1
2
4
1
4
8
1
8
y 0 1 –1 2 –2 3 –3
Plot these ordered pairs on the squared paper (graph paper) and fix a drawing
pin at each plotted point. Join the bases of the drawing pins with a thin wire.
This will represent the graph of log2
x.
24/04/18
118 Laboratory Manual
4. Draw the graph of line y = x on the sheet.
5. Place a mirror along the wire representing y = x. It can be seen that the two
graphs of the given functions are mirror images of each other in the line y = x.
OBSERVATION
1. Image of ordered pair (1, 2) on the graph of y = 2x
in y = x is ______. It lies
on the graph of y = _______.
2. Image of the point (4, 2) on the graph y = log2
x in y = x is _________ which
lies on the graph of y = _______.
Repeat this process for some more points lying on the two graphs.
APPLICATION
This activity is useful in understanding the concept of (exponential and
logarithmic functions) which are mirror images of each other in y = x.
24/04/18
METHOD OF CONSTRUCTION
1. Paste a graph paper on a white sheet and fix the sheet on the hardboard.
2. Find some ordered pairs satisfying the function y = log10
x. Using log tables/
calculator and draw the graph of the function on the graph paper (see Fig. 8)
OBJECTIVE MATERIALREQUIRED
To establish a relationship between
common logarithm (to the base 10)
and natural logarithm (to the base e)
of the number x.
Hardboard, white sheet, graph
paper, pencil, scale, log tables or
calculator (graphic/scientific).
Activity 8
Fig. 8
X
Y¢
1 4 5 62 3 7 8 9 10O
1 y = xlog10
y = xloge
¢
Y
eX¢
}}y
y¢
24/04/18
120 Laboratory Manual
3. Similarly, draw the graph of y′ = loge
x on the same graph paper as shown in
the figure (using log table/calculator).
DEMONSTRATION
1. Take any point on the positive direction of x-axis, and note its x-coordinate.
2. For this value of x, find the value of y-coordinates for both the graphs of
y = log10
x and y′ = loge
x by actual measurement, using a scale, and record
them as y and y′, respectively.
3. Find the ratio
y
y′ .
4. Repeat the above steps for some more points on the x-axis (with different
values) and find the corresponding ratios of the ordinates as in Step 3.
5. Each of these ratios will nearly be the same and equal to 0.4, which is
approximately equal to
1
log 10e
.
OBSERVATION
S.No. Points on 10=logy x ′ e=logy x Ratio
y
y′
the x-axis (approximate)
1. x1
= _____ y1
= _____ 1y′ = _____ __________
2. x2
=_____ y2
= _____ 2y′ = _____ __________
3. x3
=_____ y3
= _____ 3y′ = _____ __________
4. x4
=_____ y4
= _____ 4y′ = _____ __________
5. x5
=_____ y5
= _____ 5y′ = _____ __________
6. x6
=_____ y6
= _____ 6y′ = _____ __________
24/04/18
Mathematics 121
2. The value of
y
y′ for each point x is equal to _________ approximately.
3. The observed value of
y
y′ in each case is approximately equal to the value of
1
log 10e
.(Yes/No)
4. Therefore, 10log
log 10e
x= .
APPLICATION
This activity is useful in converting log of a number in one given base to log of
that number in another base.
Let, y = log10
x, i.e., x = 10y
.
Taking logarithm to base e on both the sides, we get log log 10e ex y=
or ( )1
log
log 10
e
e
y x=
10log 1
log log 10e e
x
x
⇒ = = 0.434294 (using log tables/calculator).
NOTE
24/04/18
METHOD OF CONSTRUCTION
1. Consider the function given by
2
–16
, 4
( ) – 4
10, 4
x
x
f x x
x
 
≠ 
= 
 = 
2. Take some points on the left and some points on the right side of c (= 4)
which are very near to c.
3. Find the corresponding values of f (x) for each of the points considered in
step 2 above.
4. Record the values of points on the left and right side of c as x and the
corresponding values of f (x) in a form of a table.
DEMONSTRATION
1. The values of x and f (x) are recorded as follows:
Table 1 : For points on the left of c (= 4).
x 3.9 3.99 3.999 3.9999 3.99999 3.999999 3.9999999
f (x) 7.9 7.99 7.999 7.9999 7.99999 7.999999 7.9999999
OBJECTIVE MATERIAL REQUIRED
To find analytically the limit of a
function f (x) at x = c and also to check
the continuity of the function at that
point.
Paper, pencil, calculator.
Activity 9
24/04/18
Mathematics 123
2. Table 2: For points on the right of c (= 4).
x 4.1 4.01 4.001 4.0001 4.00001 4.000001 4.0000001
f (x) 8.1 8.01 8.001 8.0001 8.00001 8.000001 8.0000001
OBSERVATION
1. The value of f (x) is approaching to ________, as x→ 4 from the left.
2. The value of f (x) is approaching to ________, as x→4 from the right.
3. So, ( )4
lim
x
f x
→
= ________ and ( )4
lim
x
f x+
→
= ________.
4. Therefore, ( )4
lim
x
f x
→
= ________ , f (4) = ________.
5. Is ( )4
lim
x
f x
→
= f (4) ________ ? (Yes/No)
6. Since ( ) lim ( )
x c
f c f x
→
≠ , so, the function is ________ at x = 4 (continuous/
not continuous).
APPLICATION
This activity is useful in understanding the concept of limit and continuity of a
function at a point.
24/04/18
METHOD OF CONSTRUCTION
1. Paste a white sheet on the hardboard.
2. Draw the curve of the given continuous function as represented in the Fig. 10.
3. Take any point A (x0
, 0) on the positive side of x-axis and corresponding to
this point, mark the point P (x0
, y0
) on the curve.
OBJECTIVE MATERIAL REQUIRED
To verify that for a function f to be
continuous at given point x0
,
( ) ( )0 0–y f x x f x∆ = + ∆ is
arbitrarily small provided. x∆ is
sufficiently small.
Hardboard, white sheets, pencil,
scale, calculator, adhesive.
Activity 10
Fig. 10
( – )x x0 4D x0 M3(x + x0 3)D M2(x + x0 2)D M1(x + x0 1)DM4
P
T2
N2
N1
X
Y
Dx4
Dx3 Dx2
Dx1
Dy4
Dy3
Dy2
Dy1
A
T1
X¢
Y¢
24/04/18
Mathematics 125
DEMONSTRATION
1. Take one more point M1
(x0
+ ∆x1
, 0) to the right of A, where ∆x1
is an
increment in x.
2. Draw the perpendicular from M1
to meet the curve at N1
. Let the coordinates
of N1
be (x0
+ ∆x1
, y0
+ ∆y1
)
3. Draw a perpendicular from the point P (x0
, y0
) to meet N1
M1
at T1
.
4. Now measureAM1
= 1x∆ (say) and record it and also measure 1 1 1N T y= ∆ and
record it.
5. Reduce the increment in x to ∆x2
(i.e., ∆x2
< ∆x1
) to get another point
M2 ( )0 2,0x x+ ∆ . Get the corresponding point N2
on the curve
6. Let the perpendicular PT1
intersects N2
M2
at T2
.
7. Again measure 2 2AM x= ∆ and record it.
Measure 2 2 2N T y=∆ and record it.
8. Repeat the above steps for some more points so that ∆x becomes smaller
and smaller.
OBSERVATION
S.No. Value of increment Corresponding
in x0
increment in y
1. 1 1x y∆ = ∆ =
2. 2 2x y∆ = ∆ =
3. 3 3x y∆ = ∆ =
4. 4 4x y∆ = ∆ =
5. 5 5x y∆ = ∆ =
24/04/18
126 Laboratory Manual
06. 6 6x y∆ = ∆ =
07. 7 7x y∆ = ∆ =
08. 8 8x y∆ = ∆ =
09. 9 9x y∆ = ∆ =
10.
2. So, y∆ becomes _________ when x∆ becomes smaller.
3. Thus 0
lim
x∆ →
y∆ = 0 for a continuous function.
APPLICATION
This activity is helpful in explaining the concept of derivative (left hand or right
hand) at any point on the curve corresponding to a function.
24/04/18

More Related Content

What's hot

Investigatory project on fertilizer
Investigatory project on fertilizer Investigatory project on fertilizer
Investigatory project on fertilizer
Abhishek Mishra Satna
 
Shaneka pob sba
Shaneka pob sbaShaneka pob sba
Shaneka pob sba
Shanny Brown
 
Smoke bombs
Smoke bombsSmoke bombs
Smoke bombs
Danti Saputri
 
Vbt and hybridization
Vbt and hybridizationVbt and hybridization
Vbt and hybridization
Slides by Asma Khalil
 
Presence of Pesticides in Fruits and vegetables
Presence of Pesticides in Fruits and vegetables Presence of Pesticides in Fruits and vegetables
Presence of Pesticides in Fruits and vegetables
Jyotismat Raul
 
Chemistry project work
Chemistry project workChemistry project work
Chemistry project workrahulchamp2345
 
Biology investigatory project xii on Drug Addiction
Biology investigatory project xii on Drug AddictionBiology investigatory project xii on Drug Addiction
Biology investigatory project xii on Drug Addiction
Khalifa Shameer
 
Maths practical file (class 12)
Maths practical file (class 12)Maths practical file (class 12)
Maths practical file (class 12)
Anushka Rai
 
toaz.info-chemistry-project-essential-oils-12-pr_44c692d978be5f0e9bfe6a36473f...
toaz.info-chemistry-project-essential-oils-12-pr_44c692d978be5f0e9bfe6a36473f...toaz.info-chemistry-project-essential-oils-12-pr_44c692d978be5f0e9bfe6a36473f...
toaz.info-chemistry-project-essential-oils-12-pr_44c692d978be5f0e9bfe6a36473f...
KrishnaPrints
 
Study Of oxalte ion in guava fruit at different stages of ripening
Study Of oxalte ion in guava fruit at different stages of ripeningStudy Of oxalte ion in guava fruit at different stages of ripening
Study Of oxalte ion in guava fruit at different stages of ripening
Prince Warade
 
To study the Presence of Oxalate Ions in Guava Fruit at different stages of R...
To study the Presence of Oxalate Ions in Guava Fruit at different stages of R...To study the Presence of Oxalate Ions in Guava Fruit at different stages of R...
To study the Presence of Oxalate Ions in Guava Fruit at different stages of R...
VanshPatil7
 
Additional Mathematics CSEC SBA Sample
Additional Mathematics CSEC SBA SampleAdditional Mathematics CSEC SBA Sample
Additional Mathematics CSEC SBA Sample
DavidRamdeen1
 
To find the refractive indexes of (a) water,(b) oil using a plane mirror, an ...
To find the refractive indexes of (a) water,(b) oil using a plane mirror, an ...To find the refractive indexes of (a) water,(b) oil using a plane mirror, an ...
To find the refractive indexes of (a) water,(b) oil using a plane mirror, an ...
AnkitSharma1903
 
Biology class 12 investigatory project
Biology class 12 investigatory projectBiology class 12 investigatory project
Biology class 12 investigatory project
SlimerElite
 
Chemistry Investigatory Project Class 12 - Drugs
Chemistry Investigatory Project Class 12 - DrugsChemistry Investigatory Project Class 12 - Drugs
Chemistry Investigatory Project Class 12 - Drugs
Shashikals Kp
 
INVESTIGATION OF NICOTINE IN TOBACCO PRODUCTS
INVESTIGATION OF NICOTINE IN TOBACCO PRODUCTSINVESTIGATION OF NICOTINE IN TOBACCO PRODUCTS
INVESTIGATION OF NICOTINE IN TOBACCO PRODUCTS
bimalbhakta
 
CBSE CLASS 12 CHEMISTRY PROJECT
CBSE CLASS 12 CHEMISTRY PROJECTCBSE CLASS 12 CHEMISTRY PROJECT
CBSE CLASS 12 CHEMISTRY PROJECT
Sivareth Moni Chelvan
 
Determination of Caffeine In Tea Samples
Determination of Caffeine In Tea SamplesDetermination of Caffeine In Tea Samples
Determination of Caffeine In Tea Samples
RAKSHITDOGRA1
 
Physics activity file class 12
Physics activity file class 12Physics activity file class 12
Physics activity file class 12
Titiksha Sharma
 
Class 12 Project PRISM AND NATURE OF LIGHT
Class 12 Project PRISM AND NATURE OF LIGHTClass 12 Project PRISM AND NATURE OF LIGHT
Class 12 Project PRISM AND NATURE OF LIGHT
GangadharBV1
 

What's hot (20)

Investigatory project on fertilizer
Investigatory project on fertilizer Investigatory project on fertilizer
Investigatory project on fertilizer
 
Shaneka pob sba
Shaneka pob sbaShaneka pob sba
Shaneka pob sba
 
Smoke bombs
Smoke bombsSmoke bombs
Smoke bombs
 
Vbt and hybridization
Vbt and hybridizationVbt and hybridization
Vbt and hybridization
 
Presence of Pesticides in Fruits and vegetables
Presence of Pesticides in Fruits and vegetables Presence of Pesticides in Fruits and vegetables
Presence of Pesticides in Fruits and vegetables
 
Chemistry project work
Chemistry project workChemistry project work
Chemistry project work
 
Biology investigatory project xii on Drug Addiction
Biology investigatory project xii on Drug AddictionBiology investigatory project xii on Drug Addiction
Biology investigatory project xii on Drug Addiction
 
Maths practical file (class 12)
Maths practical file (class 12)Maths practical file (class 12)
Maths practical file (class 12)
 
toaz.info-chemistry-project-essential-oils-12-pr_44c692d978be5f0e9bfe6a36473f...
toaz.info-chemistry-project-essential-oils-12-pr_44c692d978be5f0e9bfe6a36473f...toaz.info-chemistry-project-essential-oils-12-pr_44c692d978be5f0e9bfe6a36473f...
toaz.info-chemistry-project-essential-oils-12-pr_44c692d978be5f0e9bfe6a36473f...
 
Study Of oxalte ion in guava fruit at different stages of ripening
Study Of oxalte ion in guava fruit at different stages of ripeningStudy Of oxalte ion in guava fruit at different stages of ripening
Study Of oxalte ion in guava fruit at different stages of ripening
 
To study the Presence of Oxalate Ions in Guava Fruit at different stages of R...
To study the Presence of Oxalate Ions in Guava Fruit at different stages of R...To study the Presence of Oxalate Ions in Guava Fruit at different stages of R...
To study the Presence of Oxalate Ions in Guava Fruit at different stages of R...
 
Additional Mathematics CSEC SBA Sample
Additional Mathematics CSEC SBA SampleAdditional Mathematics CSEC SBA Sample
Additional Mathematics CSEC SBA Sample
 
To find the refractive indexes of (a) water,(b) oil using a plane mirror, an ...
To find the refractive indexes of (a) water,(b) oil using a plane mirror, an ...To find the refractive indexes of (a) water,(b) oil using a plane mirror, an ...
To find the refractive indexes of (a) water,(b) oil using a plane mirror, an ...
 
Biology class 12 investigatory project
Biology class 12 investigatory projectBiology class 12 investigatory project
Biology class 12 investigatory project
 
Chemistry Investigatory Project Class 12 - Drugs
Chemistry Investigatory Project Class 12 - DrugsChemistry Investigatory Project Class 12 - Drugs
Chemistry Investigatory Project Class 12 - Drugs
 
INVESTIGATION OF NICOTINE IN TOBACCO PRODUCTS
INVESTIGATION OF NICOTINE IN TOBACCO PRODUCTSINVESTIGATION OF NICOTINE IN TOBACCO PRODUCTS
INVESTIGATION OF NICOTINE IN TOBACCO PRODUCTS
 
CBSE CLASS 12 CHEMISTRY PROJECT
CBSE CLASS 12 CHEMISTRY PROJECTCBSE CLASS 12 CHEMISTRY PROJECT
CBSE CLASS 12 CHEMISTRY PROJECT
 
Determination of Caffeine In Tea Samples
Determination of Caffeine In Tea SamplesDetermination of Caffeine In Tea Samples
Determination of Caffeine In Tea Samples
 
Physics activity file class 12
Physics activity file class 12Physics activity file class 12
Physics activity file class 12
 
Class 12 Project PRISM AND NATURE OF LIGHT
Class 12 Project PRISM AND NATURE OF LIGHTClass 12 Project PRISM AND NATURE OF LIGHT
Class 12 Project PRISM AND NATURE OF LIGHT
 

Similar to Lab mannual ncert 1

ACTIVITY of mathematics class 12th
ACTIVITY of mathematics class 12thACTIVITY of mathematics class 12th
ACTIVITY of mathematics class 12th
prashantjain227
 
Precalculus 1 chapter 1
Precalculus 1 chapter 1Precalculus 1 chapter 1
Precalculus 1 chapter 1
oreves
 
Exponential-Function.pptx general Mathematics
Exponential-Function.pptx general MathematicsExponential-Function.pptx general Mathematics
Exponential-Function.pptx general Mathematics
PrinCess534001
 
Arts revealed in calculus and its extension
Arts revealed in calculus and its extensionArts revealed in calculus and its extension
Arts revealed in calculus and its extension
Premier Publishers
 
KSSM Form 4 Additional Mathematics Notes (Chapter 1-5)
KSSM Form 4 Additional Mathematics Notes (Chapter 1-5)KSSM Form 4 Additional Mathematics Notes (Chapter 1-5)
KSSM Form 4 Additional Mathematics Notes (Chapter 1-5)
Lai Zhi Jun
 
5.1 indentifying linear equations
5.1 indentifying linear equations5.1 indentifying linear equations
5.1 indentifying linear equationscoolhanddav
 
Ch02 se
Ch02 seCh02 se
Ch02 se
parulian
 
Linear equations in two variables
Linear equations in two variablesLinear equations in two variables
Linear equations in two variables
arvin efriani
 
20230124 PLOS Fractal Manuscript 8.docx
20230124 PLOS Fractal Manuscript 8.docx20230124 PLOS Fractal Manuscript 8.docx
20230124 PLOS Fractal Manuscript 8.docx
Sharon Liu
 
shape functions of 1D and 2 D rectangular elements.pptx
shape functions of 1D and 2 D rectangular elements.pptxshape functions of 1D and 2 D rectangular elements.pptx
shape functions of 1D and 2 D rectangular elements.pptx
VishalDeshpande27
 
Discrete Mathematics with Applications 4th Edition Susanna Solutions Manual
Discrete Mathematics with Applications 4th Edition Susanna Solutions ManualDiscrete Mathematics with Applications 4th Edition Susanna Solutions Manual
Discrete Mathematics with Applications 4th Edition Susanna Solutions Manual
HayfaVaughan
 
Graph Theory,Graph Terminologies,Planar Graph & Graph Colouring
Graph Theory,Graph Terminologies,Planar Graph & Graph ColouringGraph Theory,Graph Terminologies,Planar Graph & Graph Colouring
Graph Theory,Graph Terminologies,Planar Graph & Graph Colouring
Saurabh Kaushik
 
Math school-books-3rd-preparatory-2nd-term-khawagah-2019
Math school-books-3rd-preparatory-2nd-term-khawagah-2019Math school-books-3rd-preparatory-2nd-term-khawagah-2019
Math school-books-3rd-preparatory-2nd-term-khawagah-2019
khawagah
 
Index notation
Index notationIndex notation
Index notation
MERTEKMEN
 
G10_Daily Lesson Log_Second QUARTER.docx
G10_Daily Lesson Log_Second QUARTER.docxG10_Daily Lesson Log_Second QUARTER.docx
G10_Daily Lesson Log_Second QUARTER.docx
SinamarLaroyaRefuerz
 
Module1 exponential functions
Module1  exponential functionsModule1  exponential functions
Module1 exponential functions
dionesioable
 
Module functions
Module   functionsModule   functions
Module functions
dionesioable
 
chapter1_part2.pdf
chapter1_part2.pdfchapter1_part2.pdf
chapter1_part2.pdf
AliEb2
 

Similar to Lab mannual ncert 1 (20)

ACTIVITY of mathematics class 12th
ACTIVITY of mathematics class 12thACTIVITY of mathematics class 12th
ACTIVITY of mathematics class 12th
 
Precalculus 1 chapter 1
Precalculus 1 chapter 1Precalculus 1 chapter 1
Precalculus 1 chapter 1
 
Exponential-Function.pptx general Mathematics
Exponential-Function.pptx general MathematicsExponential-Function.pptx general Mathematics
Exponential-Function.pptx general Mathematics
 
Arts revealed in calculus and its extension
Arts revealed in calculus and its extensionArts revealed in calculus and its extension
Arts revealed in calculus and its extension
 
M1l2notes
M1l2notesM1l2notes
M1l2notes
 
KSSM Form 4 Additional Mathematics Notes (Chapter 1-5)
KSSM Form 4 Additional Mathematics Notes (Chapter 1-5)KSSM Form 4 Additional Mathematics Notes (Chapter 1-5)
KSSM Form 4 Additional Mathematics Notes (Chapter 1-5)
 
Chapter 5 Identifying Linear Functions
Chapter 5 Identifying Linear FunctionsChapter 5 Identifying Linear Functions
Chapter 5 Identifying Linear Functions
 
5.1 indentifying linear equations
5.1 indentifying linear equations5.1 indentifying linear equations
5.1 indentifying linear equations
 
Ch02 se
Ch02 seCh02 se
Ch02 se
 
Linear equations in two variables
Linear equations in two variablesLinear equations in two variables
Linear equations in two variables
 
20230124 PLOS Fractal Manuscript 8.docx
20230124 PLOS Fractal Manuscript 8.docx20230124 PLOS Fractal Manuscript 8.docx
20230124 PLOS Fractal Manuscript 8.docx
 
shape functions of 1D and 2 D rectangular elements.pptx
shape functions of 1D and 2 D rectangular elements.pptxshape functions of 1D and 2 D rectangular elements.pptx
shape functions of 1D and 2 D rectangular elements.pptx
 
Discrete Mathematics with Applications 4th Edition Susanna Solutions Manual
Discrete Mathematics with Applications 4th Edition Susanna Solutions ManualDiscrete Mathematics with Applications 4th Edition Susanna Solutions Manual
Discrete Mathematics with Applications 4th Edition Susanna Solutions Manual
 
Graph Theory,Graph Terminologies,Planar Graph & Graph Colouring
Graph Theory,Graph Terminologies,Planar Graph & Graph ColouringGraph Theory,Graph Terminologies,Planar Graph & Graph Colouring
Graph Theory,Graph Terminologies,Planar Graph & Graph Colouring
 
Math school-books-3rd-preparatory-2nd-term-khawagah-2019
Math school-books-3rd-preparatory-2nd-term-khawagah-2019Math school-books-3rd-preparatory-2nd-term-khawagah-2019
Math school-books-3rd-preparatory-2nd-term-khawagah-2019
 
Index notation
Index notationIndex notation
Index notation
 
G10_Daily Lesson Log_Second QUARTER.docx
G10_Daily Lesson Log_Second QUARTER.docxG10_Daily Lesson Log_Second QUARTER.docx
G10_Daily Lesson Log_Second QUARTER.docx
 
Module1 exponential functions
Module1  exponential functionsModule1  exponential functions
Module1 exponential functions
 
Module functions
Module   functionsModule   functions
Module functions
 
chapter1_part2.pdf
chapter1_part2.pdfchapter1_part2.pdf
chapter1_part2.pdf
 

More from Himani Asija

Prac 4 integral as limit of sum
Prac  4  integral as limit of sumPrac  4  integral as limit of sum
Prac 4 integral as limit of sum
Himani Asija
 
Prac 3 lagrange's thm
Prac  3 lagrange's thmPrac  3 lagrange's thm
Prac 3 lagrange's thm
Himani Asija
 
Prac 3 lagrange's thm
Prac  3 lagrange's thmPrac  3 lagrange's thm
Prac 3 lagrange's thm
Himani Asija
 
Prac 2 rolle's thm
Prac  2 rolle's thmPrac  2 rolle's thm
Prac 2 rolle's thm
Himani Asija
 
Prac 1 box folding
Prac 1 box foldingPrac 1 box folding
Prac 1 box folding
Himani Asija
 
Conicsections dpsvk
Conicsections dpsvkConicsections dpsvk
Conicsections dpsvkHimani Asija
 
Areas of bounded regions
Areas of bounded regionsAreas of bounded regions
Areas of bounded regionsHimani Asija
 
Innovative use of technology in the teaching of calculus
Innovative use of technology in the teaching of calculusInnovative use of technology in the teaching of calculus
Innovative use of technology in the teaching of calculus
Himani Asija
 
Mathematical modeling in the diagnosis of cancer
Mathematical modeling in the diagnosis of cancerMathematical modeling in the diagnosis of cancer
Mathematical modeling in the diagnosis of cancerHimani Asija
 
Dimensions a mathematical walkthrough
Dimensions a mathematical walkthroughDimensions a mathematical walkthrough
Dimensions a mathematical walkthroughHimani Asija
 
Believe it or not!!
Believe it or not!!Believe it or not!!
Believe it or not!!
Himani Asija
 
Believe it or not!!
Believe it or not!!Believe it or not!!
Believe it or not!!
Himani Asija
 

More from Himani Asija (14)

Prac 4 integral as limit of sum
Prac  4  integral as limit of sumPrac  4  integral as limit of sum
Prac 4 integral as limit of sum
 
Prac 3 lagrange's thm
Prac  3 lagrange's thmPrac  3 lagrange's thm
Prac 3 lagrange's thm
 
Prac 3 lagrange's thm
Prac  3 lagrange's thmPrac  3 lagrange's thm
Prac 3 lagrange's thm
 
Prac 2 rolle's thm
Prac  2 rolle's thmPrac  2 rolle's thm
Prac 2 rolle's thm
 
Prac 1 box folding
Prac 1 box foldingPrac 1 box folding
Prac 1 box folding
 
Conicsections dpsvk
Conicsections dpsvkConicsections dpsvk
Conicsections dpsvk
 
Indices and surds
Indices and surdsIndices and surds
Indices and surds
 
Areas of bounded regions
Areas of bounded regionsAreas of bounded regions
Areas of bounded regions
 
Innovative use of technology in the teaching of calculus
Innovative use of technology in the teaching of calculusInnovative use of technology in the teaching of calculus
Innovative use of technology in the teaching of calculus
 
Mathematical modeling in the diagnosis of cancer
Mathematical modeling in the diagnosis of cancerMathematical modeling in the diagnosis of cancer
Mathematical modeling in the diagnosis of cancer
 
Dimensions a mathematical walkthrough
Dimensions a mathematical walkthroughDimensions a mathematical walkthrough
Dimensions a mathematical walkthrough
 
Aviation safety
Aviation safety Aviation safety
Aviation safety
 
Believe it or not!!
Believe it or not!!Believe it or not!!
Believe it or not!!
 
Believe it or not!!
Believe it or not!!Believe it or not!!
Believe it or not!!
 

Recently uploaded

Polish students' mobility in the Czech Republic
Polish students' mobility in the Czech RepublicPolish students' mobility in the Czech Republic
Polish students' mobility in the Czech Republic
Anna Sz.
 
Instructions for Submissions thorugh G- Classroom.pptx
Instructions for Submissions thorugh G- Classroom.pptxInstructions for Submissions thorugh G- Classroom.pptx
Instructions for Submissions thorugh G- Classroom.pptx
Jheel Barad
 
Unit 8 - Information and Communication Technology (Paper I).pdf
Unit 8 - Information and Communication Technology (Paper I).pdfUnit 8 - Information and Communication Technology (Paper I).pdf
Unit 8 - Information and Communication Technology (Paper I).pdf
Thiyagu K
 
Sha'Carri Richardson Presentation 202345
Sha'Carri Richardson Presentation 202345Sha'Carri Richardson Presentation 202345
Sha'Carri Richardson Presentation 202345
beazzy04
 
Fish and Chips - have they had their chips
Fish and Chips - have they had their chipsFish and Chips - have they had their chips
Fish and Chips - have they had their chips
GeoBlogs
 
Mule 4.6 & Java 17 Upgrade | MuleSoft Mysore Meetup #46
Mule 4.6 & Java 17 Upgrade | MuleSoft Mysore Meetup #46Mule 4.6 & Java 17 Upgrade | MuleSoft Mysore Meetup #46
Mule 4.6 & Java 17 Upgrade | MuleSoft Mysore Meetup #46
MysoreMuleSoftMeetup
 
How to Create Map Views in the Odoo 17 ERP
How to Create Map Views in the Odoo 17 ERPHow to Create Map Views in the Odoo 17 ERP
How to Create Map Views in the Odoo 17 ERP
Celine George
 
Thesis Statement for students diagnonsed withADHD.ppt
Thesis Statement for students diagnonsed withADHD.pptThesis Statement for students diagnonsed withADHD.ppt
Thesis Statement for students diagnonsed withADHD.ppt
EverAndrsGuerraGuerr
 
GIÁO ÁN DẠY THÊM (KẾ HOẠCH BÀI BUỔI 2) - TIẾNG ANH 8 GLOBAL SUCCESS (2 CỘT) N...
GIÁO ÁN DẠY THÊM (KẾ HOẠCH BÀI BUỔI 2) - TIẾNG ANH 8 GLOBAL SUCCESS (2 CỘT) N...GIÁO ÁN DẠY THÊM (KẾ HOẠCH BÀI BUỔI 2) - TIẾNG ANH 8 GLOBAL SUCCESS (2 CỘT) N...
GIÁO ÁN DẠY THÊM (KẾ HOẠCH BÀI BUỔI 2) - TIẾNG ANH 8 GLOBAL SUCCESS (2 CỘT) N...
Nguyen Thanh Tu Collection
 
Cambridge International AS A Level Biology Coursebook - EBook (MaryFosbery J...
Cambridge International AS  A Level Biology Coursebook - EBook (MaryFosbery J...Cambridge International AS  A Level Biology Coursebook - EBook (MaryFosbery J...
Cambridge International AS A Level Biology Coursebook - EBook (MaryFosbery J...
AzmatAli747758
 
PART A. Introduction to Costumer Service
PART A. Introduction to Costumer ServicePART A. Introduction to Costumer Service
PART A. Introduction to Costumer Service
PedroFerreira53928
 
Ethnobotany and Ethnopharmacology ......
Ethnobotany and Ethnopharmacology ......Ethnobotany and Ethnopharmacology ......
Ethnobotany and Ethnopharmacology ......
Ashokrao Mane college of Pharmacy Peth-Vadgaon
 
The approach at University of Liverpool.pptx
The approach at University of Liverpool.pptxThe approach at University of Liverpool.pptx
The approach at University of Liverpool.pptx
Jisc
 
The Challenger.pdf DNHS Official Publication
The Challenger.pdf DNHS Official PublicationThe Challenger.pdf DNHS Official Publication
The Challenger.pdf DNHS Official Publication
Delapenabediema
 
Operation Blue Star - Saka Neela Tara
Operation Blue Star   -  Saka Neela TaraOperation Blue Star   -  Saka Neela Tara
Operation Blue Star - Saka Neela Tara
Balvir Singh
 
aaaaaaaaaaaaaaaaaaaaaaaaaaaaaaaaaaaaaaaaa
aaaaaaaaaaaaaaaaaaaaaaaaaaaaaaaaaaaaaaaaaaaaaaaaaaaaaaaaaaaaaaaaaaaaaaaaaaaaaaaaaa
aaaaaaaaaaaaaaaaaaaaaaaaaaaaaaaaaaaaaaaaa
siemaillard
 
Introduction to Quality Improvement Essentials
Introduction to Quality Improvement EssentialsIntroduction to Quality Improvement Essentials
Introduction to Quality Improvement Essentials
Excellence Foundation for South Sudan
 
Unit 2- Research Aptitude (UGC NET Paper I).pdf
Unit 2- Research Aptitude (UGC NET Paper I).pdfUnit 2- Research Aptitude (UGC NET Paper I).pdf
Unit 2- Research Aptitude (UGC NET Paper I).pdf
Thiyagu K
 
How libraries can support authors with open access requirements for UKRI fund...
How libraries can support authors with open access requirements for UKRI fund...How libraries can support authors with open access requirements for UKRI fund...
How libraries can support authors with open access requirements for UKRI fund...
Jisc
 
The Art Pastor's Guide to Sabbath | Steve Thomason
The Art Pastor's Guide to Sabbath | Steve ThomasonThe Art Pastor's Guide to Sabbath | Steve Thomason
The Art Pastor's Guide to Sabbath | Steve Thomason
Steve Thomason
 

Recently uploaded (20)

Polish students' mobility in the Czech Republic
Polish students' mobility in the Czech RepublicPolish students' mobility in the Czech Republic
Polish students' mobility in the Czech Republic
 
Instructions for Submissions thorugh G- Classroom.pptx
Instructions for Submissions thorugh G- Classroom.pptxInstructions for Submissions thorugh G- Classroom.pptx
Instructions for Submissions thorugh G- Classroom.pptx
 
Unit 8 - Information and Communication Technology (Paper I).pdf
Unit 8 - Information and Communication Technology (Paper I).pdfUnit 8 - Information and Communication Technology (Paper I).pdf
Unit 8 - Information and Communication Technology (Paper I).pdf
 
Sha'Carri Richardson Presentation 202345
Sha'Carri Richardson Presentation 202345Sha'Carri Richardson Presentation 202345
Sha'Carri Richardson Presentation 202345
 
Fish and Chips - have they had their chips
Fish and Chips - have they had their chipsFish and Chips - have they had their chips
Fish and Chips - have they had their chips
 
Mule 4.6 & Java 17 Upgrade | MuleSoft Mysore Meetup #46
Mule 4.6 & Java 17 Upgrade | MuleSoft Mysore Meetup #46Mule 4.6 & Java 17 Upgrade | MuleSoft Mysore Meetup #46
Mule 4.6 & Java 17 Upgrade | MuleSoft Mysore Meetup #46
 
How to Create Map Views in the Odoo 17 ERP
How to Create Map Views in the Odoo 17 ERPHow to Create Map Views in the Odoo 17 ERP
How to Create Map Views in the Odoo 17 ERP
 
Thesis Statement for students diagnonsed withADHD.ppt
Thesis Statement for students diagnonsed withADHD.pptThesis Statement for students diagnonsed withADHD.ppt
Thesis Statement for students diagnonsed withADHD.ppt
 
GIÁO ÁN DẠY THÊM (KẾ HOẠCH BÀI BUỔI 2) - TIẾNG ANH 8 GLOBAL SUCCESS (2 CỘT) N...
GIÁO ÁN DẠY THÊM (KẾ HOẠCH BÀI BUỔI 2) - TIẾNG ANH 8 GLOBAL SUCCESS (2 CỘT) N...GIÁO ÁN DẠY THÊM (KẾ HOẠCH BÀI BUỔI 2) - TIẾNG ANH 8 GLOBAL SUCCESS (2 CỘT) N...
GIÁO ÁN DẠY THÊM (KẾ HOẠCH BÀI BUỔI 2) - TIẾNG ANH 8 GLOBAL SUCCESS (2 CỘT) N...
 
Cambridge International AS A Level Biology Coursebook - EBook (MaryFosbery J...
Cambridge International AS  A Level Biology Coursebook - EBook (MaryFosbery J...Cambridge International AS  A Level Biology Coursebook - EBook (MaryFosbery J...
Cambridge International AS A Level Biology Coursebook - EBook (MaryFosbery J...
 
PART A. Introduction to Costumer Service
PART A. Introduction to Costumer ServicePART A. Introduction to Costumer Service
PART A. Introduction to Costumer Service
 
Ethnobotany and Ethnopharmacology ......
Ethnobotany and Ethnopharmacology ......Ethnobotany and Ethnopharmacology ......
Ethnobotany and Ethnopharmacology ......
 
The approach at University of Liverpool.pptx
The approach at University of Liverpool.pptxThe approach at University of Liverpool.pptx
The approach at University of Liverpool.pptx
 
The Challenger.pdf DNHS Official Publication
The Challenger.pdf DNHS Official PublicationThe Challenger.pdf DNHS Official Publication
The Challenger.pdf DNHS Official Publication
 
Operation Blue Star - Saka Neela Tara
Operation Blue Star   -  Saka Neela TaraOperation Blue Star   -  Saka Neela Tara
Operation Blue Star - Saka Neela Tara
 
aaaaaaaaaaaaaaaaaaaaaaaaaaaaaaaaaaaaaaaaa
aaaaaaaaaaaaaaaaaaaaaaaaaaaaaaaaaaaaaaaaaaaaaaaaaaaaaaaaaaaaaaaaaaaaaaaaaaaaaaaaaa
aaaaaaaaaaaaaaaaaaaaaaaaaaaaaaaaaaaaaaaaa
 
Introduction to Quality Improvement Essentials
Introduction to Quality Improvement EssentialsIntroduction to Quality Improvement Essentials
Introduction to Quality Improvement Essentials
 
Unit 2- Research Aptitude (UGC NET Paper I).pdf
Unit 2- Research Aptitude (UGC NET Paper I).pdfUnit 2- Research Aptitude (UGC NET Paper I).pdf
Unit 2- Research Aptitude (UGC NET Paper I).pdf
 
How libraries can support authors with open access requirements for UKRI fund...
How libraries can support authors with open access requirements for UKRI fund...How libraries can support authors with open access requirements for UKRI fund...
How libraries can support authors with open access requirements for UKRI fund...
 
The Art Pastor's Guide to Sabbath | Steve Thomason
The Art Pastor's Guide to Sabbath | Steve ThomasonThe Art Pastor's Guide to Sabbath | Steve Thomason
The Art Pastor's Guide to Sabbath | Steve Thomason
 

Lab mannual ncert 1

  • 2. The basic principles of learning mathematics are : (a) learning should be related to each child individually (b) the need for mathematics should develop from an intimate acquaintance with the environment (c) the child should be active and interested, (d) concrete material and wide variety of illustrations are needed to aid the learning process (e) understanding should be encouraged at each stage of acquiring a particular skill (f) content should be broadly based with adequate appreciation of the links between the various branches of mathematics, (g) correct mathematical usage should be encouraged at all stages. – Ronwill 24/04/18
  • 3. METHOD OF CONSTRUCTION Take a piece of plywood and paste a white paper on it. Fix the wires randomly on the plywood with the help of nails such that some of them are parallel, some are perpendicular to each other and some are inclined as shown in Fig.1. OBJECTIVE MATERIALREQUIRED To verify that the relation R in the set L of all lines in a plane, defined by R = {(l, m) : l ⊥ m} is symmetric but neither reflexive nor transitive. A piece of plywood, some pieces of wires(8),nails,whitepaper, glueetc. Activity 1 DEMONSTRATION 1. Let the wires represent the lines l1 , l2 , ..., l8 . 2. l1 is perpendicular to each of the lines l2 , l3 , l4 . [see Fig. 1] 24/04/18
  • 4. 102 Laboratory Manual 3. l6 is perpendicular to l7 . 4. l2 is parallel to l3 , l3 is parallel to l4 and l5 is parallel to l8 . 5. (l1 , l2 ), (l1 , l3 ), (l1 , l4 ), (l6 , l7 ) ∈ R OBSERVATION 1. In Fig. 1, no line is perpendicular to itself, so the relation R = {( l, m) : l ⊥ m} ______ reflexive (is/is not). 2. In Fig. 1, 1 2l l⊥ . Is l2 ⊥ l1 ? ______ (Yes/No) ∴ ( l1 , l2 ) ∈ R ⇒ ( l2 , l1 ) ______ R (∉/∈) Similarly, l3 ⊥ l1 . Is l1 ⊥ l3 ? _______ (Yes/No) ∴ ( l3 , l1 ) ∈ R ⇒ ( l1 , l3 ) ______ R (∉/∈) Also, l6 ⊥ l7 . Is l7 ⊥ l6 ? _______ (Yes/No) ∴ ( l6 , l7 ) ∈ R ⇒ ( l7 , l6 ) ______ R (∉/∈) ∴ The relation R .... symmetric (is/is not) 3. In Fig. 1, l2 ⊥ l1 and l1 ⊥ l3 . Is l2 ⊥ l3 ? ... (Yes/No) i.e., (l2 , l1 ) ∈ R and (l1 , l3 ) ∈ R ⇒ (l2 , l3 ) ______ R (∉/∈) ∴ The relation R .... transitive (is/is not). APPLICATION This activity can be used to check whether a given relation is an equivalence relation or not. NOTE 1. In this case, the relation is not an equivalence relation. 2. The activity can be repeated by taking some more wire in different positions. 24/04/18
  • 5. METHOD OF CONSTRUCTION Take a piece of plywood of convenient size and paste a white paper on it. Fix the wires randomly on the plywood with the help of nails such that some of them are parallel, some are perpendicular to each other and some are inclined as shown in Fig. 2. OBJECTIVE MATERIAL REQUIRED To verify that the relation R in the set L of all lines in a plane, defined by R = {( l, m) : l|| m} is an equivalence relation. A piece of plywood, some pieces of wire(8),plywood,nails,whitepaper, glue. Activity 2 DEMONSTRATION 1. Let the wires represent the lines l1 , l2 , ..., l8 . 2. l1 is perpendicular to each of the lines l2 , l3 , l4 (see Fig. 2). 24/04/18
  • 6. 104 Laboratory Manual 3. l6 is perpendicular to l7 . 4. l2 is parallel to l3 , l3 is parallel to l4 and l5 is parallel to l8 . 5. (l2 , l3 ), (l3 , l4 ), (l5 , l8 ), ∈ R OBSERVATION 1. In Fig. 2, every line is parallel to itself. So the relation R = {( l, m) : l|| m} .... reflexive relation (is/is not) 2. In Fig. 2, observe that 2 3l l . Is l3 ... l2 ? (|| / || ) So, (l2 , l3 ) ∈ R ⇒ (l3 , l2 ) ... R (∉/∈) Similarly, l3 || l4 . Is l4 ...l3 ? (|| / || ) So, (l3 , l4 ) ∈ R ⇒ (l4 , l3 ) ... R (∉/∈) and (l5 , l8 ) ∈ R ⇒ (l8 , l5 ) ... R (∉/∈) ∴ The relation R ... symmetric relation (is/is not) 3. In Fig. 2, observe that l2 || l3 and l3 || l4 . Is l2 ... l4 ? (|| / || ) So, (l2 , l3 ) ∈ R and (l3 , l4 ) ∈ R ⇒ (l2 , l4 ) ... R (∈/∉) Similarly, l3 || l4 and l4 || l2 . Is l3 ... l2 ? (|| / || ) So, (l3 , l4 ) ∈ R, (l4 , l2 ) ∈ R ⇒ (l3 , l2 ) ... R (∈,∉) Thus, the relation R ... transitive relation (is/is not) Hence, the relation R is reflexive, symmetric and transitive. So, R is an equivalence relation. APPLICATION This activity is useful in understanding the concept of an equivalence relation. This activity can be repeated by taking some more wires in different positions. NOTE 24/04/18
  • 7. METHOD OF CONSTRUCTION 1. Paste a plastic strip on the left hand side of the cardboard and fix three nails on it as shown in the Fig.3.1. Name the nails on the strip as 1, 2 and 3. 2. Paste another strip on the right hand side of the cardboard and fix two nails in the plastic strip as shown in Fig.3.2. Name the nails on the strip as a and b. 3. Join nails on the left strip to the nails on the right strip as shown in Fig. 3.3. OBJECTIVE MATERIAL REQUIRED To demonstrate a function which is not one-one but is onto. Cardboard, nails, strings, adhesive and plastic strips. Activity 3 DEMONSTRATION 1. Take the set X = {1, 2, 3} 2. Take the set Y = {a, b} 3. Join (correspondence) elements of X to the elements of Y as shown in Fig. 3.3 OBSERVATION 1. The image of the element 1 of X in Y is __________. The image of the element 2 of X in Y is __________. 24/04/18
  • 8. 106 Laboratory Manual The image of the element 3 of X in Y is __________. So, Fig. 3.3 represents a __________ . 2. Every element in X has a _________ image in Y. So, the function is _________(one-one/not one-one). 3. The pre-image of each element of Y in X _________ (exists/does not exist). So, the function is ________ (onto/not onto). APPLICATION This activity can be used to demonstrate the concept of one-one and onto function. Demonstrate the same activity by changing the number of the elements of the sets X and Y. NOTE 24/04/18
  • 9. METHOD OF CONSTRUCTION 1. Paste a plastic strip on the left hand side of the cardboard and fix two nails in it as shown in the Fig. 4.1. Name the nails as a and b. 2. Paste another strip on the right hand side of the cardboard and fix three nails on it as shown in the Fig. 4.2. Name the nails on the right strip as 1, 2 and 3. 3. Join nails on the left strip to the nails on the right strip as shown in the Fig. 4.3. OBJECTIVE MATERIALREQUIRED To demonstrate a function which is one-one but not onto. Cardboard, nails, strings, adhesive and plastic strips. Activity 4 DEMONSTRATION 1. Take the set X = {a, b} 2. Take the set Y = {1, 2, 3}. 3. Join elements of X to the elements of Y as shown in Fig. 4.3. 24/04/18
  • 10. 108 Laboratory Manual OBSERVATION 1. The image of the element a of X in Y is ______________. The image of the element b of X in Y is ______________. So, the Fig. 4.3 represents a _____________________. 2. Every element in X has a _________ image in Y. So, the function is _____________ (one-one/not one-one). 3. The pre-image of the element 1 of Y in X __________ (exists/does not exist). So, the function is __________ (onto/not onto). Thus, Fig. 4.3 represents a function which is _________ but not onto. APPLICATION This activity can be used to demonstrate the concept of one-one but not onto function. 24/04/18
  • 11. METHOD OF CONSTRUCTION 1. Take a cardboard of suitable dimensions, say, 30 cm × 30 cm. 2. On the cardboard, paste a white chart paper of size 25 cm × 25 cm (say). 3. On the paper, draw two lines, perpendicular to each other and name them X′OX and YOY′ as rectangular axes [see Fig. 5]. OBJECTIVE MATERIALREQUIRED To draw the graph of 1 sin x− , using the graph of sin x and demonstrate the concept of mirror reflection (about the line y = x). Cardboard, white chart paper, ruler, coloured pens, adhesive, pencil, eraser, cutter, nails and thin wires. Activity 5 24/04/18
  • 12. 110 Laboratory Manual 4. Graduate the axes approximately as shown in Fig. 5.1 by taking unit on X-axis = 1.25 times the unit of Y-axis. 5. Mark approximately the points ,sin , ,sin , ... , ,sin 6 6 4 4 2 2 π π π π π π                  in the coordinate plane and at each point fix a nail. 6. Repeat the above process on the other side of the x-axis, marking the points – – – – – – ,sin , ,sin , ... , ,sin 6 6 4 4 2 2 π π π π π π                  approximately and fix nails on these points as N1 ′, N2 ′, N3 ′, N4 ′. Also fix a nail at O. 7. Join the nails with the help of a tight wire on both sides of x-axis to get the graph of sin x from – to 2 2 π π . 8. Draw the graph of the line y = x (by plotting the points (1,1), (2, 2), (3, 3), ... etc. and fixing a wire on these points). 9. From the nails N1 , N2 , N3 ,N4 , draw perpendicular on the line y = x and produce these lines such that length of perpendicular on both sides of the line y = x are equal. At these points fix nails, I1 ,I2 ,I3 ,I4 . 10. Repeat the above activity on the other side of X- axis and fix nails at I1 ′,I2 ′,I3 ′,I4 ′. 11. Join the nails on both sides of the line y = x by a tight wire that will show the graph of 1 siny x− = . DEMONSTRATION Put a mirror on the line y = x. The image of the graph of sin x in the mirror will represent the graph of 1 sin x− showing that sin–1 x is mirror reflection of sin x and vice versa. 24/04/18
  • 13. Mathematics 111 OBSERVATION The image of point N1 in the mirror (the line y = x) is _________. The image of point N2 in the mirror (the line y = x) is _________. The image of point N3 in the mirror (the line y = x) is _________. The image of point N4 in the mirror (the line y = x) is _________. The image of point 1N′ in the mirror (the line y = x) is _________. The image point of 2N′ in the mirror (the line y = x) is _________. The image point of 3N′ in the mirror (the line y = x) is _________. The image point of 4N′ in the mirror (the line y = x) is _________. The image of the graph of six x in y = x is the graph of _________, and the image of the graph of sin–1 x in y = x is the graph of __________. APPLICATION Similar activity can be performed for drawing the graphs of –1 1 cos , tanx x− , etc. 24/04/18
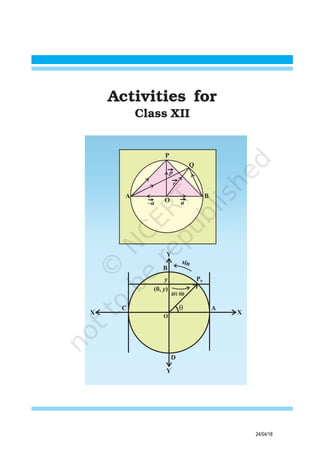
  • 14. METHOD OF CONSTRUCTION 1. Take a cardboard of a convenient size and paste a white chart paper on it. 2. Draw a unit circle with centre O on it. 3. Through the centre of the circle, draw two perpendicular lines X′OX and YOY′ representing x-axis and y-axis, respectively as shown in Fig. 6.1. 4. Mark the points A, C, B and D, where the circle cuts the x-axis and y-axis, respectively as shown in Fig. 6.1. 5. Fix two rails on opposite sides of the cardboard which are parallel to y-axis. Fix one steel wire between the rails such that the wire can be moved parallel to x-axis as shown in Fig. 6.2. OBJECTIVE MATERIAL REQUIRED To explore the principal value of the function sin–1 x using a unit circle. Cardboard, white chart paper, rails, ruler, adhesive, steel wires and needle. Activity 6 24/04/18
  • 15. Mathematics 113 6. Take a needle of unit length. Fix one end of it at the centre of the circle and the other end to move freely along the circle Fig. 6.2. DEMONSTRATION 1. Keep the needle at an arbitrary angle, say x1 with the positive direction of x-axis. Measure of angle in radian is equal to the length of intercepted arc of the unit circle. 2. Slide the steel wire between the rails, parallel to x-axis such that the wire meets with free end of the needle (say P1 ) (Fig. 6.2). 3. Denote the y-coordinate of the point P1 as y1 , where y1 is the perpendicular distance of steel wire from the x-axis of the unit circle giving y1 = sin x1 . 4. Rotate the needle further anticlockwise and keep it at the angle π – x1 . Find the value of y-coordinate of intersecting point P2 with the help of sliding steel wire. Value of y-coordinate for the points P1 and P2 are same for the different value of angles, y1 = sinx1 and y1 = sin (π – x1 ). This demonstrates that sine function is not one-to-one for angles considered in first and second quadrants. 5. Keep the needle at angles – x1 and (– π + x1 ), respectively. By sliding down the steel wire parallel to x-axis, demonstrate that y-coordinate for the points P3 and P4 are the same and thus sine function is not one-to-one for points considered in 3rd and 4th quadrants as shown in Fig. 6.2. 24/04/18
  • 16. 114 Laboratory Manual 6. However, the y-coordinate of the points P3 and P1 are different. Move the needle in anticlockwise direction starting from 2 π − to 2 π and look at the behaviour of y-coordinates of points P5 , P6 , P7 and P8 by sliding the steel wire parallel to x-axis accordingly. y-co- ordinate of points P5 , P6 , P7 and P8 are different (see Fig. 6.3). Hence, sine function is one-to-one in the domian , 2 2 π π  −   and its range lies between – 1 and 1. 7. Keep the needle at any arbitrary angle say θ lying in the interval , 2 2 π π  −   and denote the y-coordi- nate of the intersecting point P9 as y. (see Fig. 6.4). Then y = sin θ or θ = arc sin–1 y) as sine function is one-one and onto in the domain , 2 2 π π  −   and range [–1, 1]. So, its inverse arc sine function exist. The domain of arc sine function is [–1, 1] and Fig. 6.4 24/04/18
  • 17. Mathematics 115 range is , 2 2 π π  −   . This range is called the principal value of arc sine function (or sin–1 function). OBSERVATION 1. sine function is non-negative in _________ and __________ quadrants. 2. For the quadrants 3rd and 4th, sine function is _________. 3. θ = arc sin y ⇒ y = ________ θ where 2 π − ≤ θ ≤ ________. 4. The other domains of sine function on which it is one-one and onto provides _________ for arc sine function. APPLICATION This activity can be used for finding the principal value of arc cosine function (cos–1 y). 24/04/18
  • 18. METHOD OF CONSTRUCTION 1. On the drawing board, fix a thick paper sheet of convenient size 20 cm × 20 cm (say) with adhesive. OBJECTIVE MATERIAL REQUIRED To sketch the graphs of ax and loga x, a > 0, a ≠ 1 and to examine that they are mirror images of each other. Drawing board, geometrical instru- ments, drawing pins, thin wires, sketch pens, thick white paper, adhesive, pencil, eraser, a plane mirror, squared paper. Activity 7 Fig. 7 24/04/18
  • 19. Mathematics 117 2. On the sheet, take two perpendicular lines XOX′ and YOY′, depicting coordinate axes. 3. Mark graduations on the two axes as shown in the Fig. 7. 4. Find some ordered pairs satisfying y = ax and y = loga x. Plot these points corresponding to the ordered pairs and join them by free hand curves in both the cases. Fix thin wires along these curves using drawing pins. 5. Draw the graph of y = x, and fix a wire along the graph, using drawing pins. DEMONSTRATION 1. For ax , take a = 2 (say), and find ordered pairs satisfying it as x 0 1 –1 2 –2 3 –3 1 2 – 1 2 4 2x 1 2 0.5 4 1 4 8 1 8 1.4 0.7 16 and plot these ordered pairs on the squared paper and fix a drawing pin at each point. 2. Join the bases of drawing pins with a thin wire. This will represent the graph of 2x . 3. log2 x = y gives 2y x= . Some ordered pairs satisfying it are: x 1 2 1 2 4 1 4 8 1 8 y 0 1 –1 2 –2 3 –3 Plot these ordered pairs on the squared paper (graph paper) and fix a drawing pin at each plotted point. Join the bases of the drawing pins with a thin wire. This will represent the graph of log2 x. 24/04/18
  • 20. 118 Laboratory Manual 4. Draw the graph of line y = x on the sheet. 5. Place a mirror along the wire representing y = x. It can be seen that the two graphs of the given functions are mirror images of each other in the line y = x. OBSERVATION 1. Image of ordered pair (1, 2) on the graph of y = 2x in y = x is ______. It lies on the graph of y = _______. 2. Image of the point (4, 2) on the graph y = log2 x in y = x is _________ which lies on the graph of y = _______. Repeat this process for some more points lying on the two graphs. APPLICATION This activity is useful in understanding the concept of (exponential and logarithmic functions) which are mirror images of each other in y = x. 24/04/18
  • 21. METHOD OF CONSTRUCTION 1. Paste a graph paper on a white sheet and fix the sheet on the hardboard. 2. Find some ordered pairs satisfying the function y = log10 x. Using log tables/ calculator and draw the graph of the function on the graph paper (see Fig. 8) OBJECTIVE MATERIALREQUIRED To establish a relationship between common logarithm (to the base 10) and natural logarithm (to the base e) of the number x. Hardboard, white sheet, graph paper, pencil, scale, log tables or calculator (graphic/scientific). Activity 8 Fig. 8 X Y¢ 1 4 5 62 3 7 8 9 10O 1 y = xlog10 y = xloge ¢ Y eX¢ }}y y¢ 24/04/18
  • 22. 120 Laboratory Manual 3. Similarly, draw the graph of y′ = loge x on the same graph paper as shown in the figure (using log table/calculator). DEMONSTRATION 1. Take any point on the positive direction of x-axis, and note its x-coordinate. 2. For this value of x, find the value of y-coordinates for both the graphs of y = log10 x and y′ = loge x by actual measurement, using a scale, and record them as y and y′, respectively. 3. Find the ratio y y′ . 4. Repeat the above steps for some more points on the x-axis (with different values) and find the corresponding ratios of the ordinates as in Step 3. 5. Each of these ratios will nearly be the same and equal to 0.4, which is approximately equal to 1 log 10e . OBSERVATION S.No. Points on 10=logy x ′ e=logy x Ratio y y′ the x-axis (approximate) 1. x1 = _____ y1 = _____ 1y′ = _____ __________ 2. x2 =_____ y2 = _____ 2y′ = _____ __________ 3. x3 =_____ y3 = _____ 3y′ = _____ __________ 4. x4 =_____ y4 = _____ 4y′ = _____ __________ 5. x5 =_____ y5 = _____ 5y′ = _____ __________ 6. x6 =_____ y6 = _____ 6y′ = _____ __________ 24/04/18
  • 23. Mathematics 121 2. The value of y y′ for each point x is equal to _________ approximately. 3. The observed value of y y′ in each case is approximately equal to the value of 1 log 10e .(Yes/No) 4. Therefore, 10log log 10e x= . APPLICATION This activity is useful in converting log of a number in one given base to log of that number in another base. Let, y = log10 x, i.e., x = 10y . Taking logarithm to base e on both the sides, we get log log 10e ex y= or ( )1 log log 10 e e y x= 10log 1 log log 10e e x x ⇒ = = 0.434294 (using log tables/calculator). NOTE 24/04/18
  • 24. METHOD OF CONSTRUCTION 1. Consider the function given by 2 –16 , 4 ( ) – 4 10, 4 x x f x x x   ≠  =   =  2. Take some points on the left and some points on the right side of c (= 4) which are very near to c. 3. Find the corresponding values of f (x) for each of the points considered in step 2 above. 4. Record the values of points on the left and right side of c as x and the corresponding values of f (x) in a form of a table. DEMONSTRATION 1. The values of x and f (x) are recorded as follows: Table 1 : For points on the left of c (= 4). x 3.9 3.99 3.999 3.9999 3.99999 3.999999 3.9999999 f (x) 7.9 7.99 7.999 7.9999 7.99999 7.999999 7.9999999 OBJECTIVE MATERIAL REQUIRED To find analytically the limit of a function f (x) at x = c and also to check the continuity of the function at that point. Paper, pencil, calculator. Activity 9 24/04/18
  • 25. Mathematics 123 2. Table 2: For points on the right of c (= 4). x 4.1 4.01 4.001 4.0001 4.00001 4.000001 4.0000001 f (x) 8.1 8.01 8.001 8.0001 8.00001 8.000001 8.0000001 OBSERVATION 1. The value of f (x) is approaching to ________, as x→ 4 from the left. 2. The value of f (x) is approaching to ________, as x→4 from the right. 3. So, ( )4 lim x f x → = ________ and ( )4 lim x f x+ → = ________. 4. Therefore, ( )4 lim x f x → = ________ , f (4) = ________. 5. Is ( )4 lim x f x → = f (4) ________ ? (Yes/No) 6. Since ( ) lim ( ) x c f c f x → ≠ , so, the function is ________ at x = 4 (continuous/ not continuous). APPLICATION This activity is useful in understanding the concept of limit and continuity of a function at a point. 24/04/18
  • 26. METHOD OF CONSTRUCTION 1. Paste a white sheet on the hardboard. 2. Draw the curve of the given continuous function as represented in the Fig. 10. 3. Take any point A (x0 , 0) on the positive side of x-axis and corresponding to this point, mark the point P (x0 , y0 ) on the curve. OBJECTIVE MATERIAL REQUIRED To verify that for a function f to be continuous at given point x0 , ( ) ( )0 0–y f x x f x∆ = + ∆ is arbitrarily small provided. x∆ is sufficiently small. Hardboard, white sheets, pencil, scale, calculator, adhesive. Activity 10 Fig. 10 ( – )x x0 4D x0 M3(x + x0 3)D M2(x + x0 2)D M1(x + x0 1)DM4 P T2 N2 N1 X Y Dx4 Dx3 Dx2 Dx1 Dy4 Dy3 Dy2 Dy1 A T1 X¢ Y¢ 24/04/18
  • 27. Mathematics 125 DEMONSTRATION 1. Take one more point M1 (x0 + ∆x1 , 0) to the right of A, where ∆x1 is an increment in x. 2. Draw the perpendicular from M1 to meet the curve at N1 . Let the coordinates of N1 be (x0 + ∆x1 , y0 + ∆y1 ) 3. Draw a perpendicular from the point P (x0 , y0 ) to meet N1 M1 at T1 . 4. Now measureAM1 = 1x∆ (say) and record it and also measure 1 1 1N T y= ∆ and record it. 5. Reduce the increment in x to ∆x2 (i.e., ∆x2 < ∆x1 ) to get another point M2 ( )0 2,0x x+ ∆ . Get the corresponding point N2 on the curve 6. Let the perpendicular PT1 intersects N2 M2 at T2 . 7. Again measure 2 2AM x= ∆ and record it. Measure 2 2 2N T y=∆ and record it. 8. Repeat the above steps for some more points so that ∆x becomes smaller and smaller. OBSERVATION S.No. Value of increment Corresponding in x0 increment in y 1. 1 1x y∆ = ∆ = 2. 2 2x y∆ = ∆ = 3. 3 3x y∆ = ∆ = 4. 4 4x y∆ = ∆ = 5. 5 5x y∆ = ∆ = 24/04/18
  • 28. 126 Laboratory Manual 06. 6 6x y∆ = ∆ = 07. 7 7x y∆ = ∆ = 08. 8 8x y∆ = ∆ = 09. 9 9x y∆ = ∆ = 10. 2. So, y∆ becomes _________ when x∆ becomes smaller. 3. Thus 0 lim x∆ → y∆ = 0 for a continuous function. APPLICATION This activity is helpful in explaining the concept of derivative (left hand or right hand) at any point on the curve corresponding to a function. 24/04/18