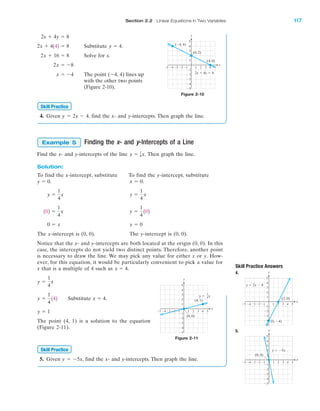
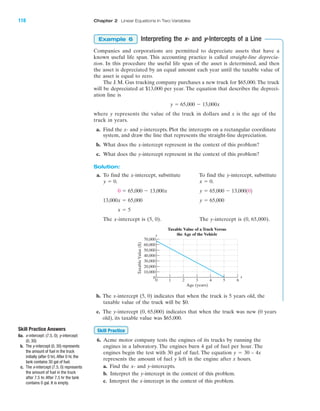
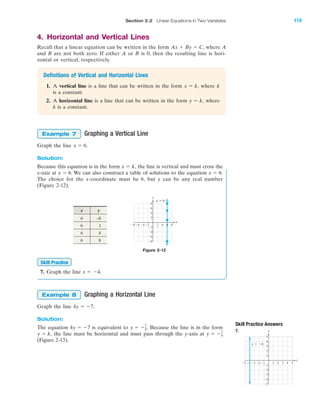
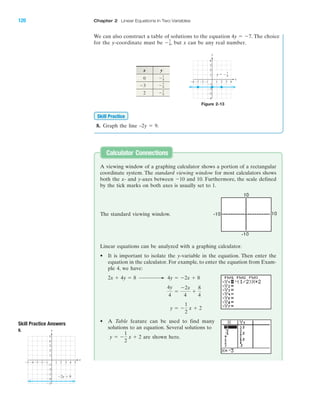
Downloaded 17 times
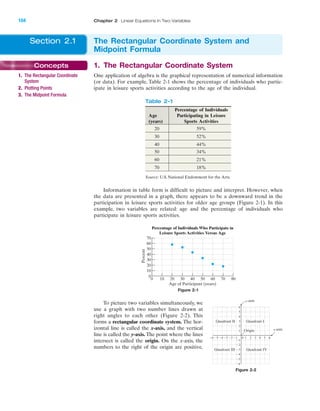
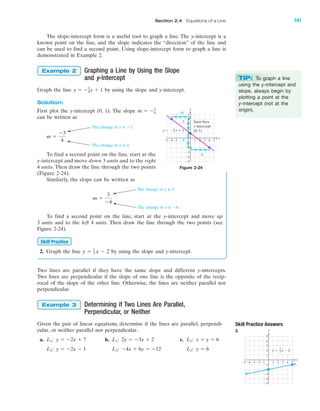
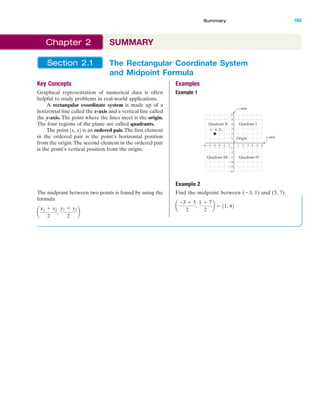

The document discusses the graphing of numerical information using the rectangular coordinate system, including key concepts like plotting points, the midpoint formula, and the application of linear equations. It emphasizes the importance of graphs in visualizing data and provides examples of plotting points and interpreting graphs in real-life contexts, such as tracking savings. The text also outlines exercises and terminology related to graphing and coordinates.