1. The document provides instructions for conducting a topographic survey using GNSS units and mapping the results in ArcMap.
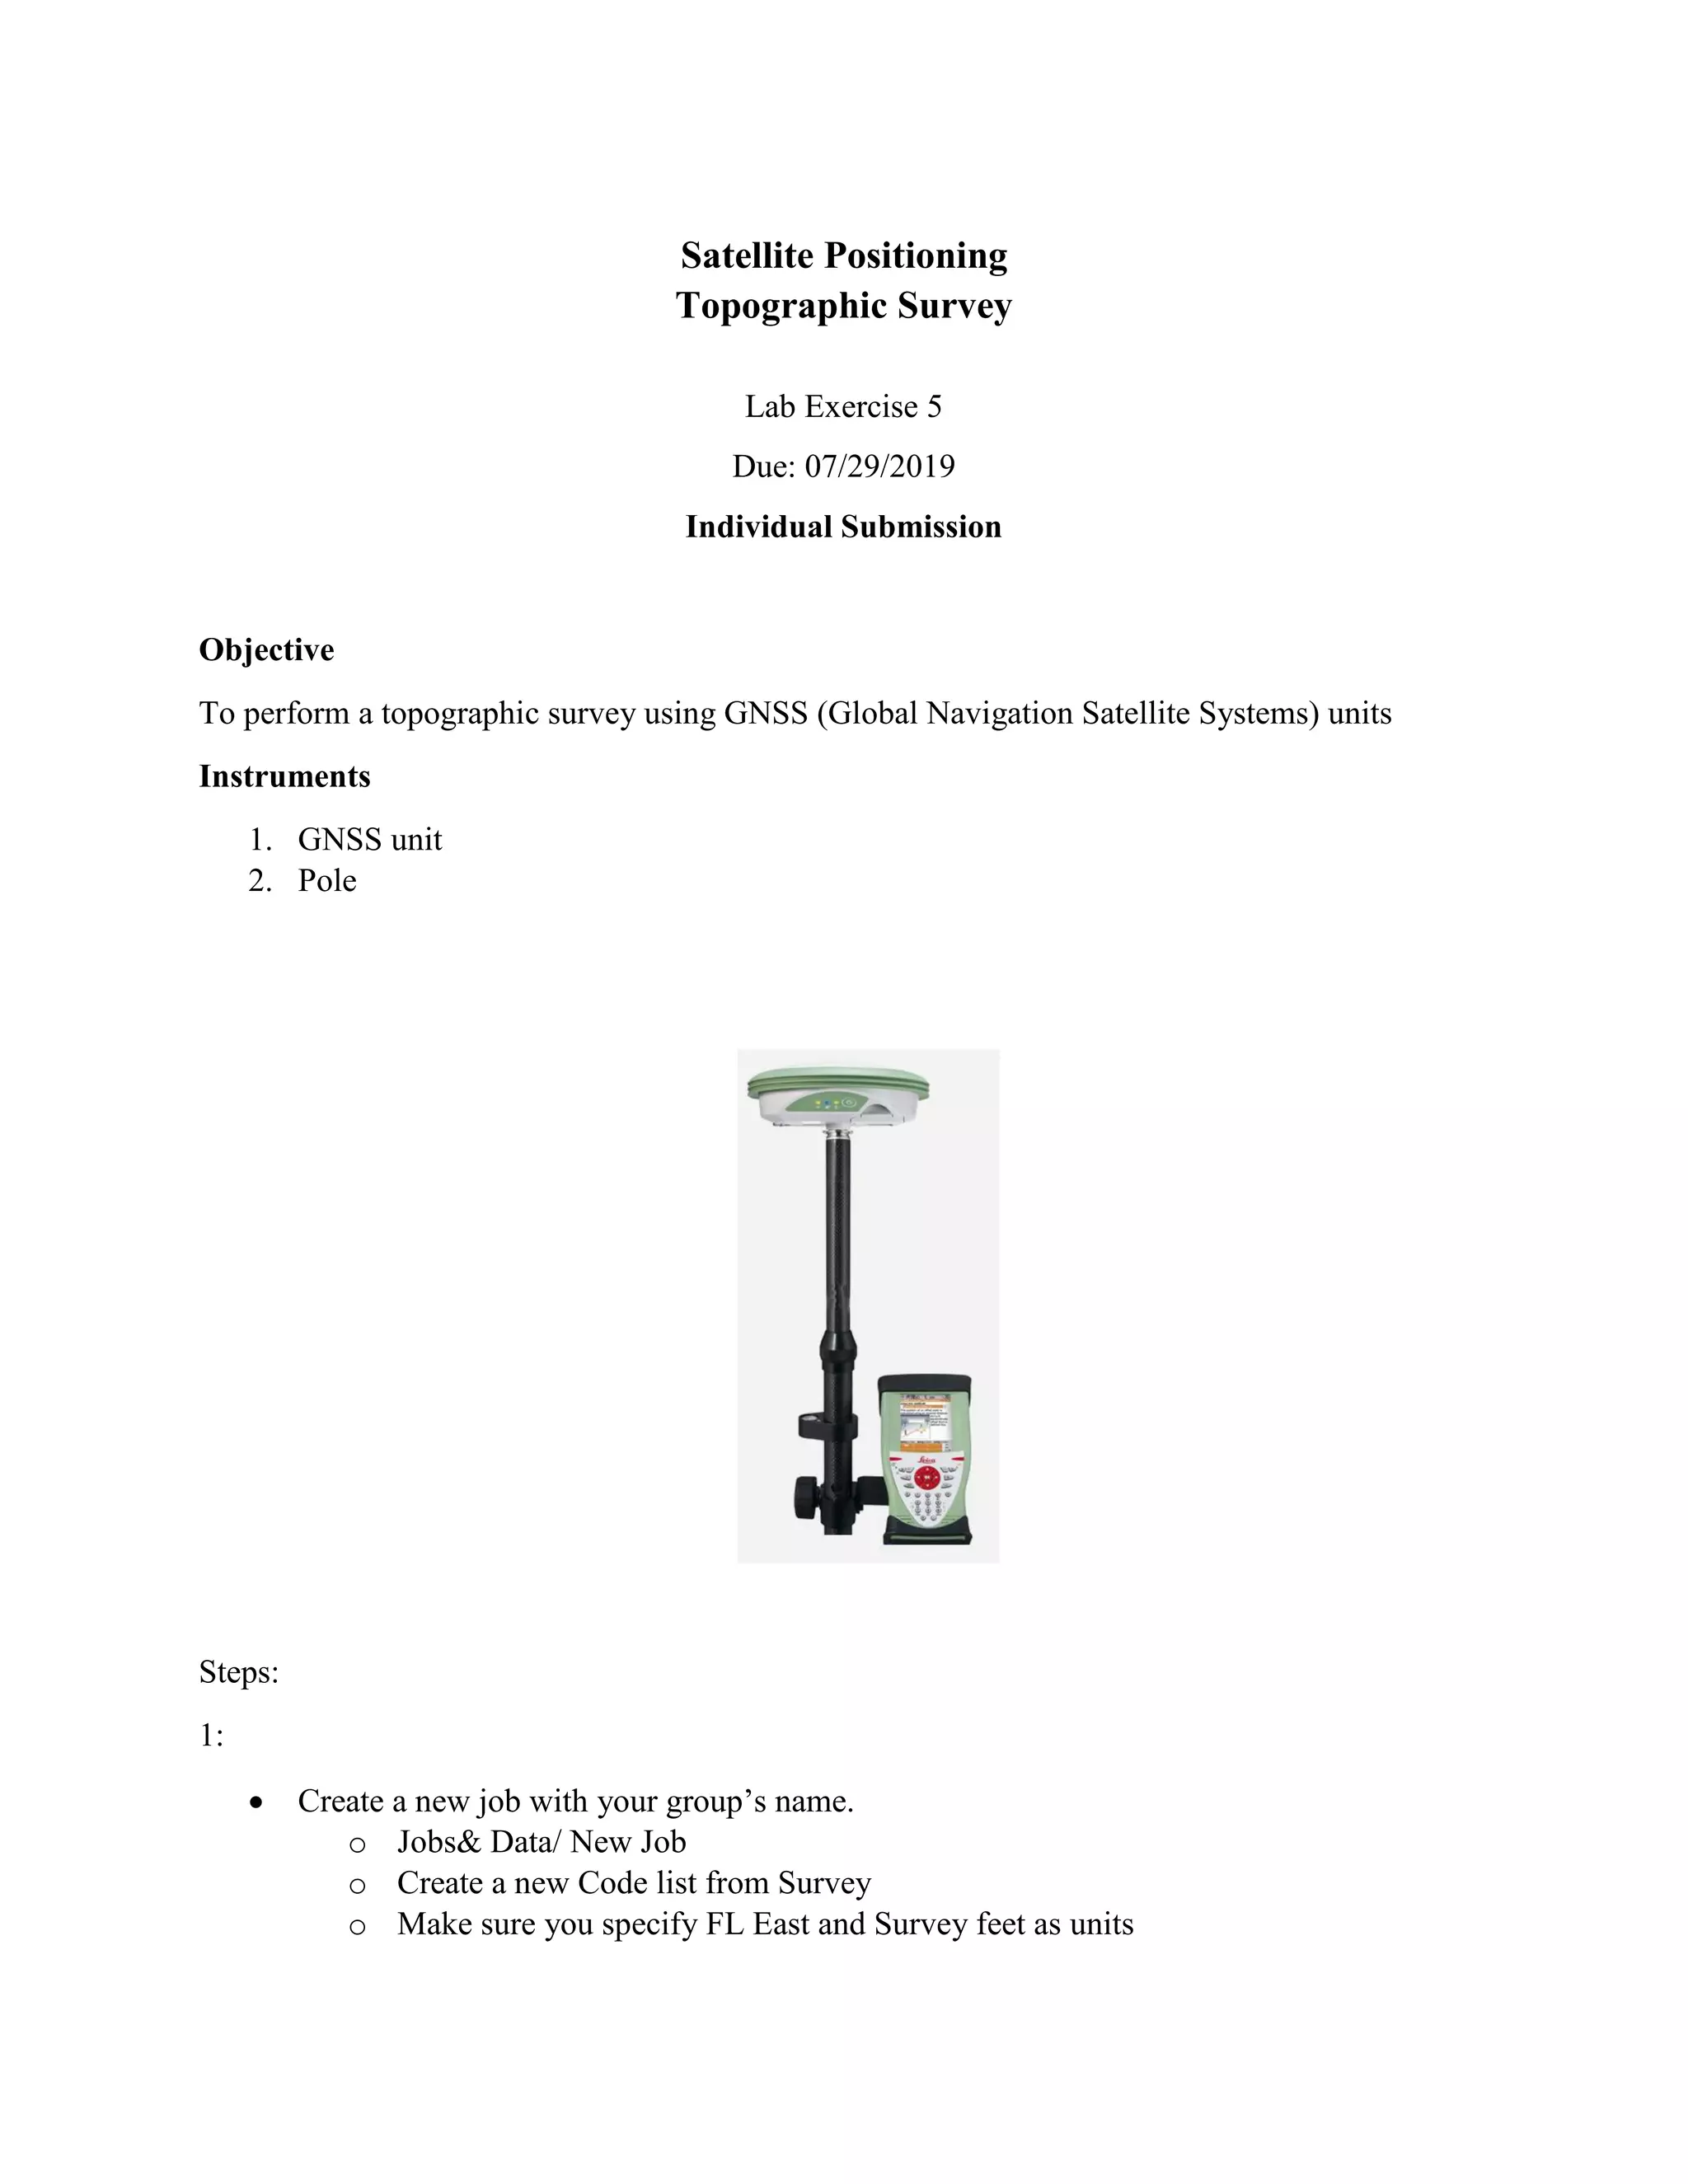
2. Students are asked to collect at least 15 point features in the field using a GNSS unit and export the data to a USB drive.
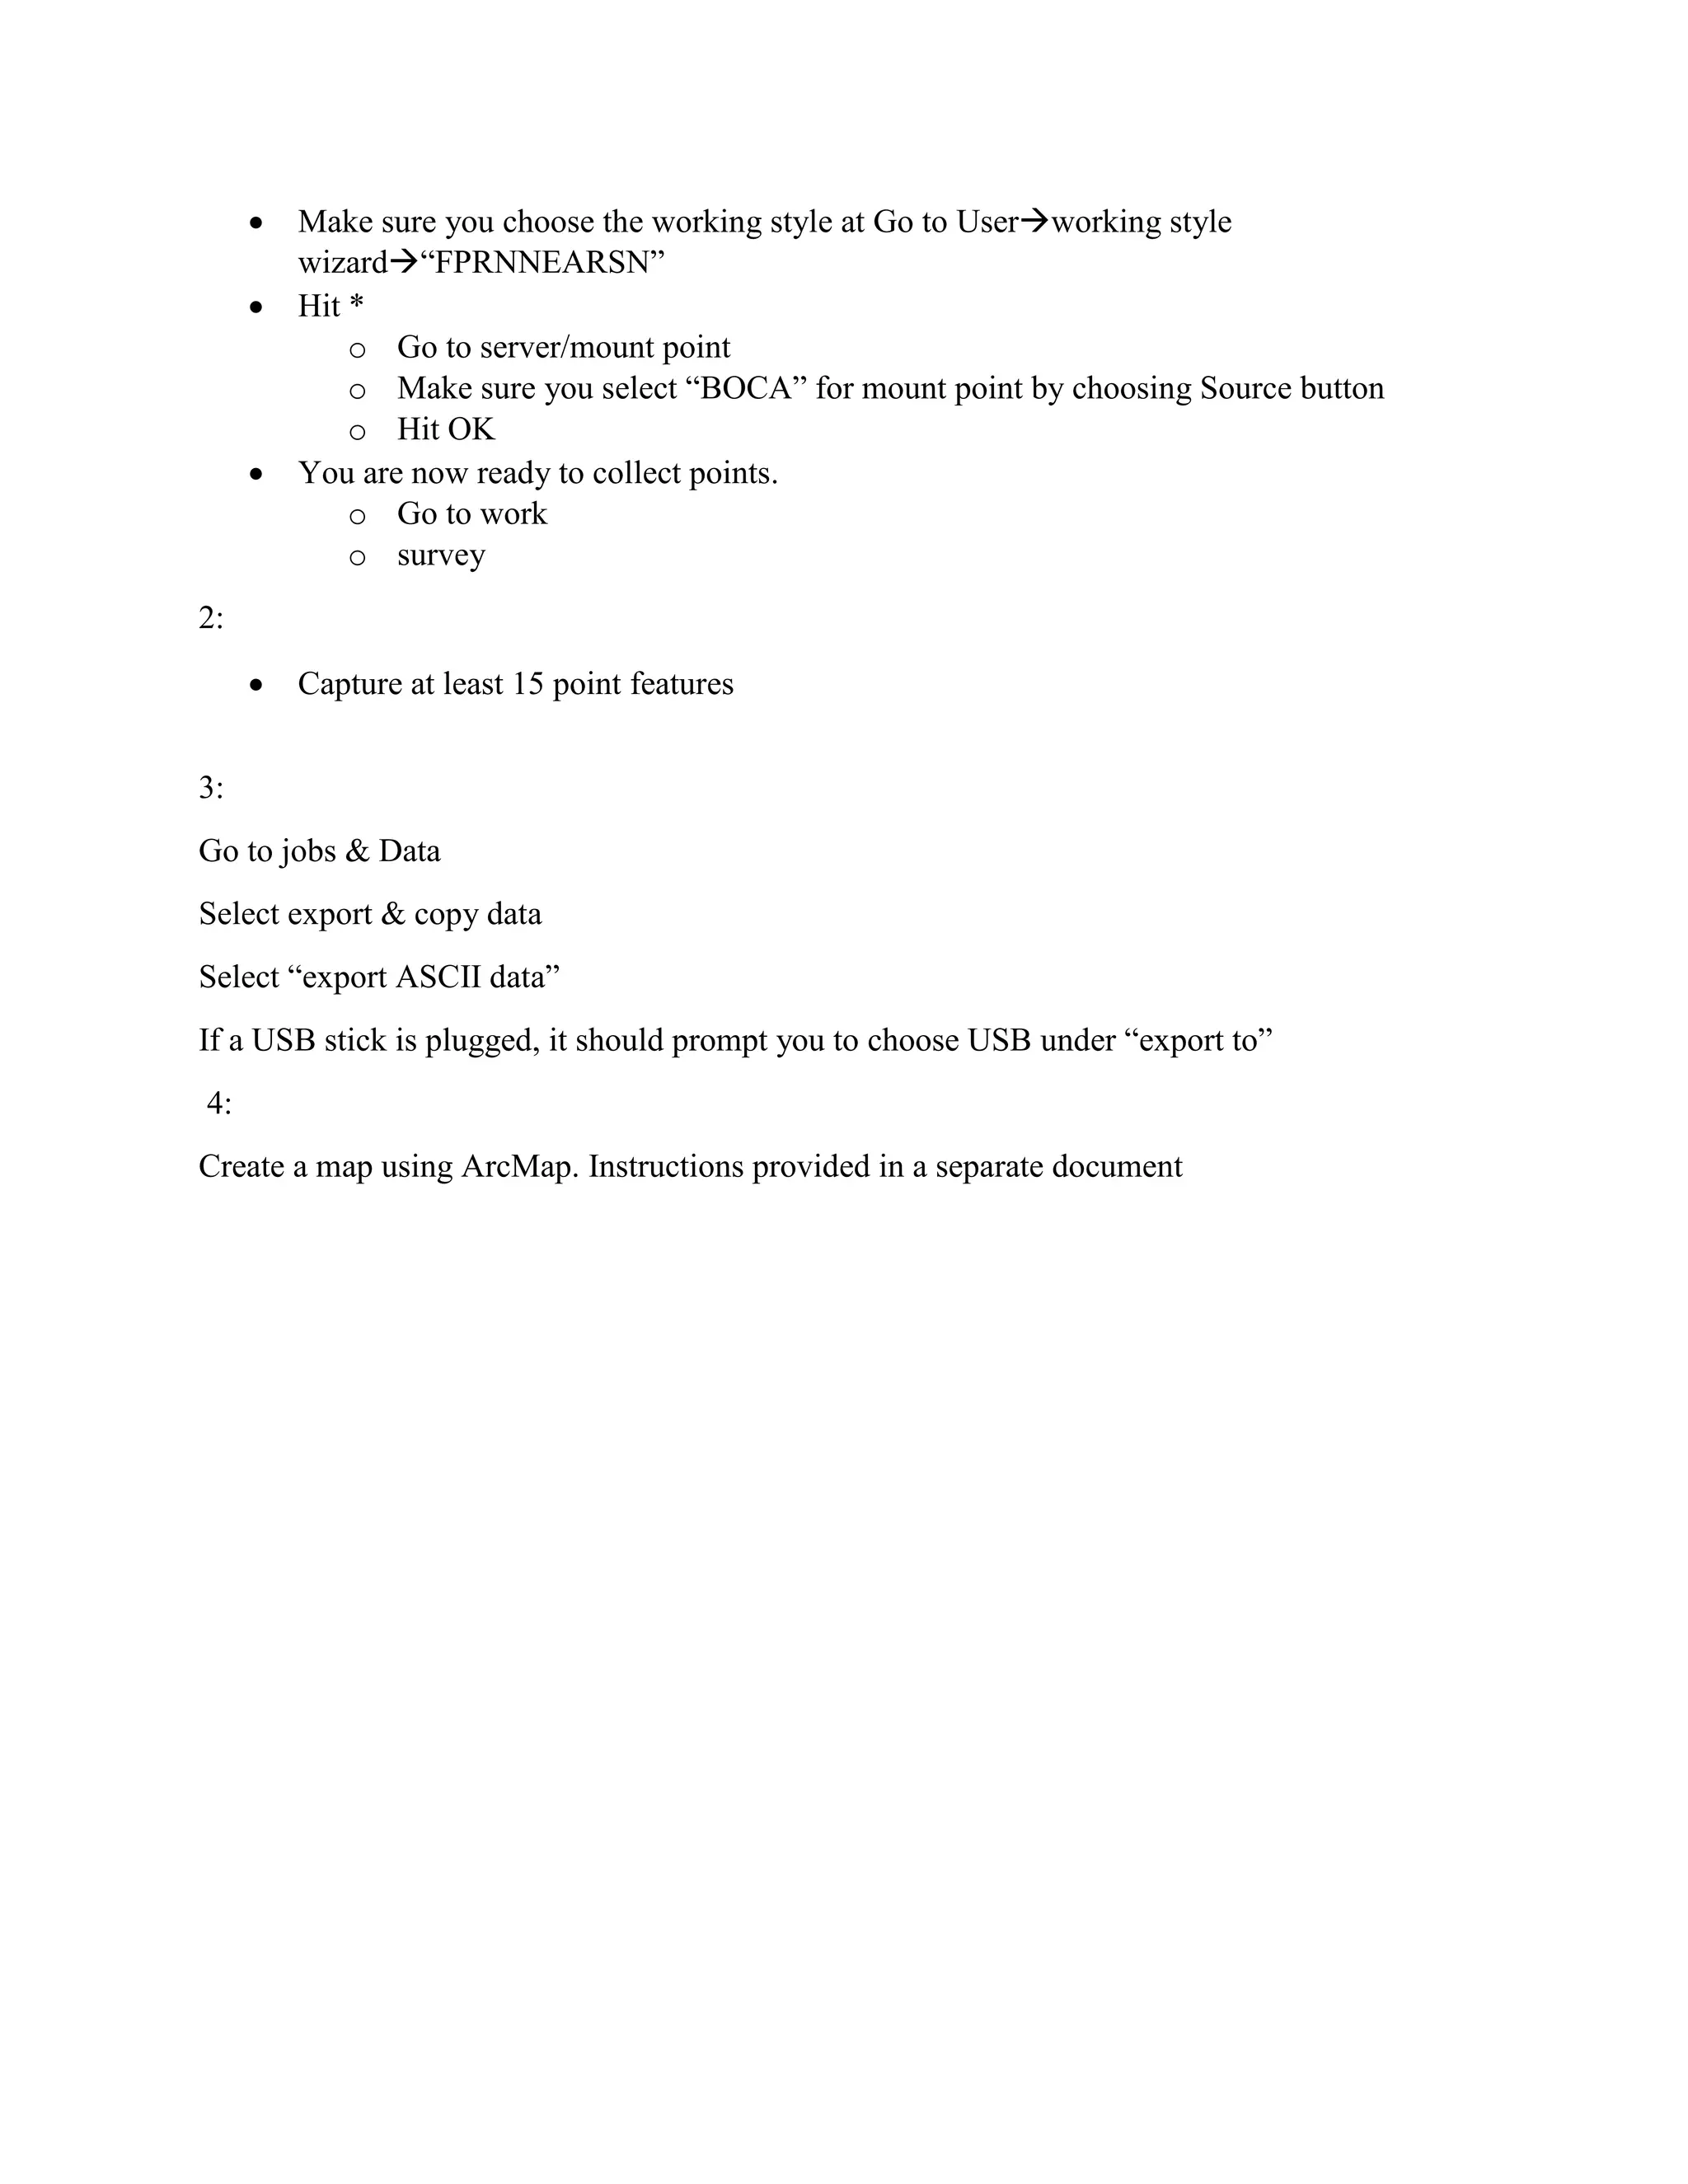
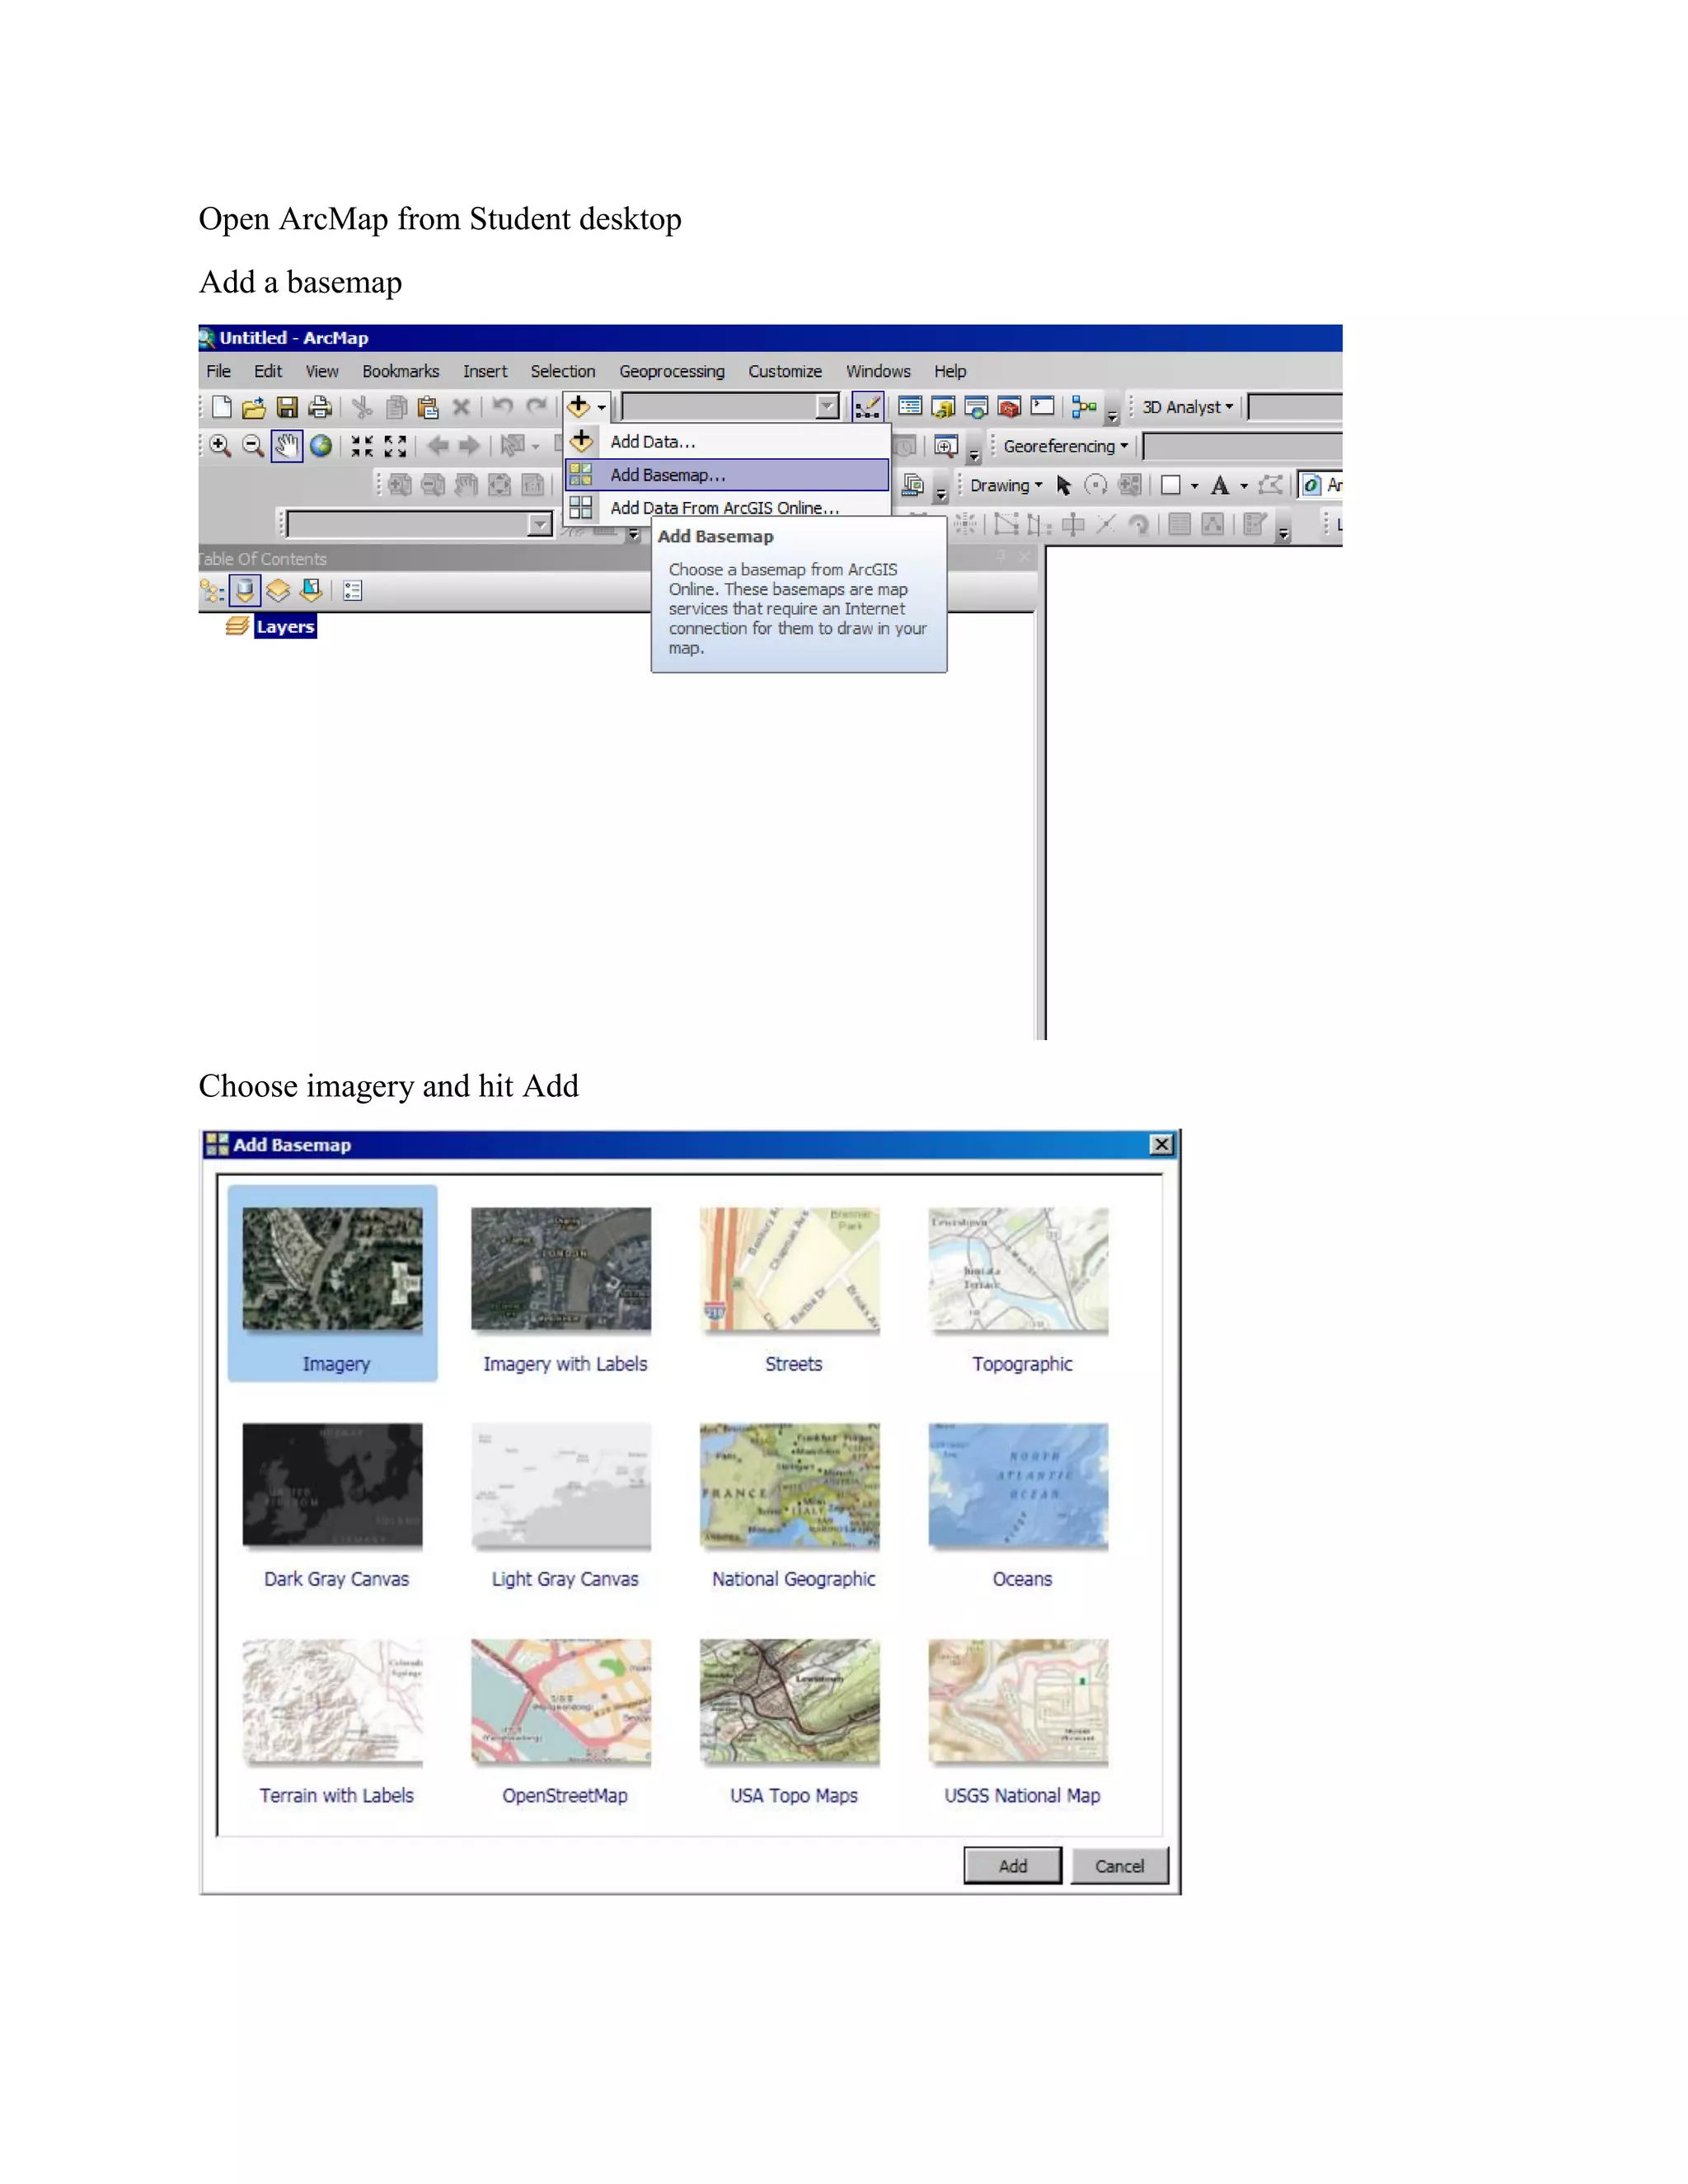
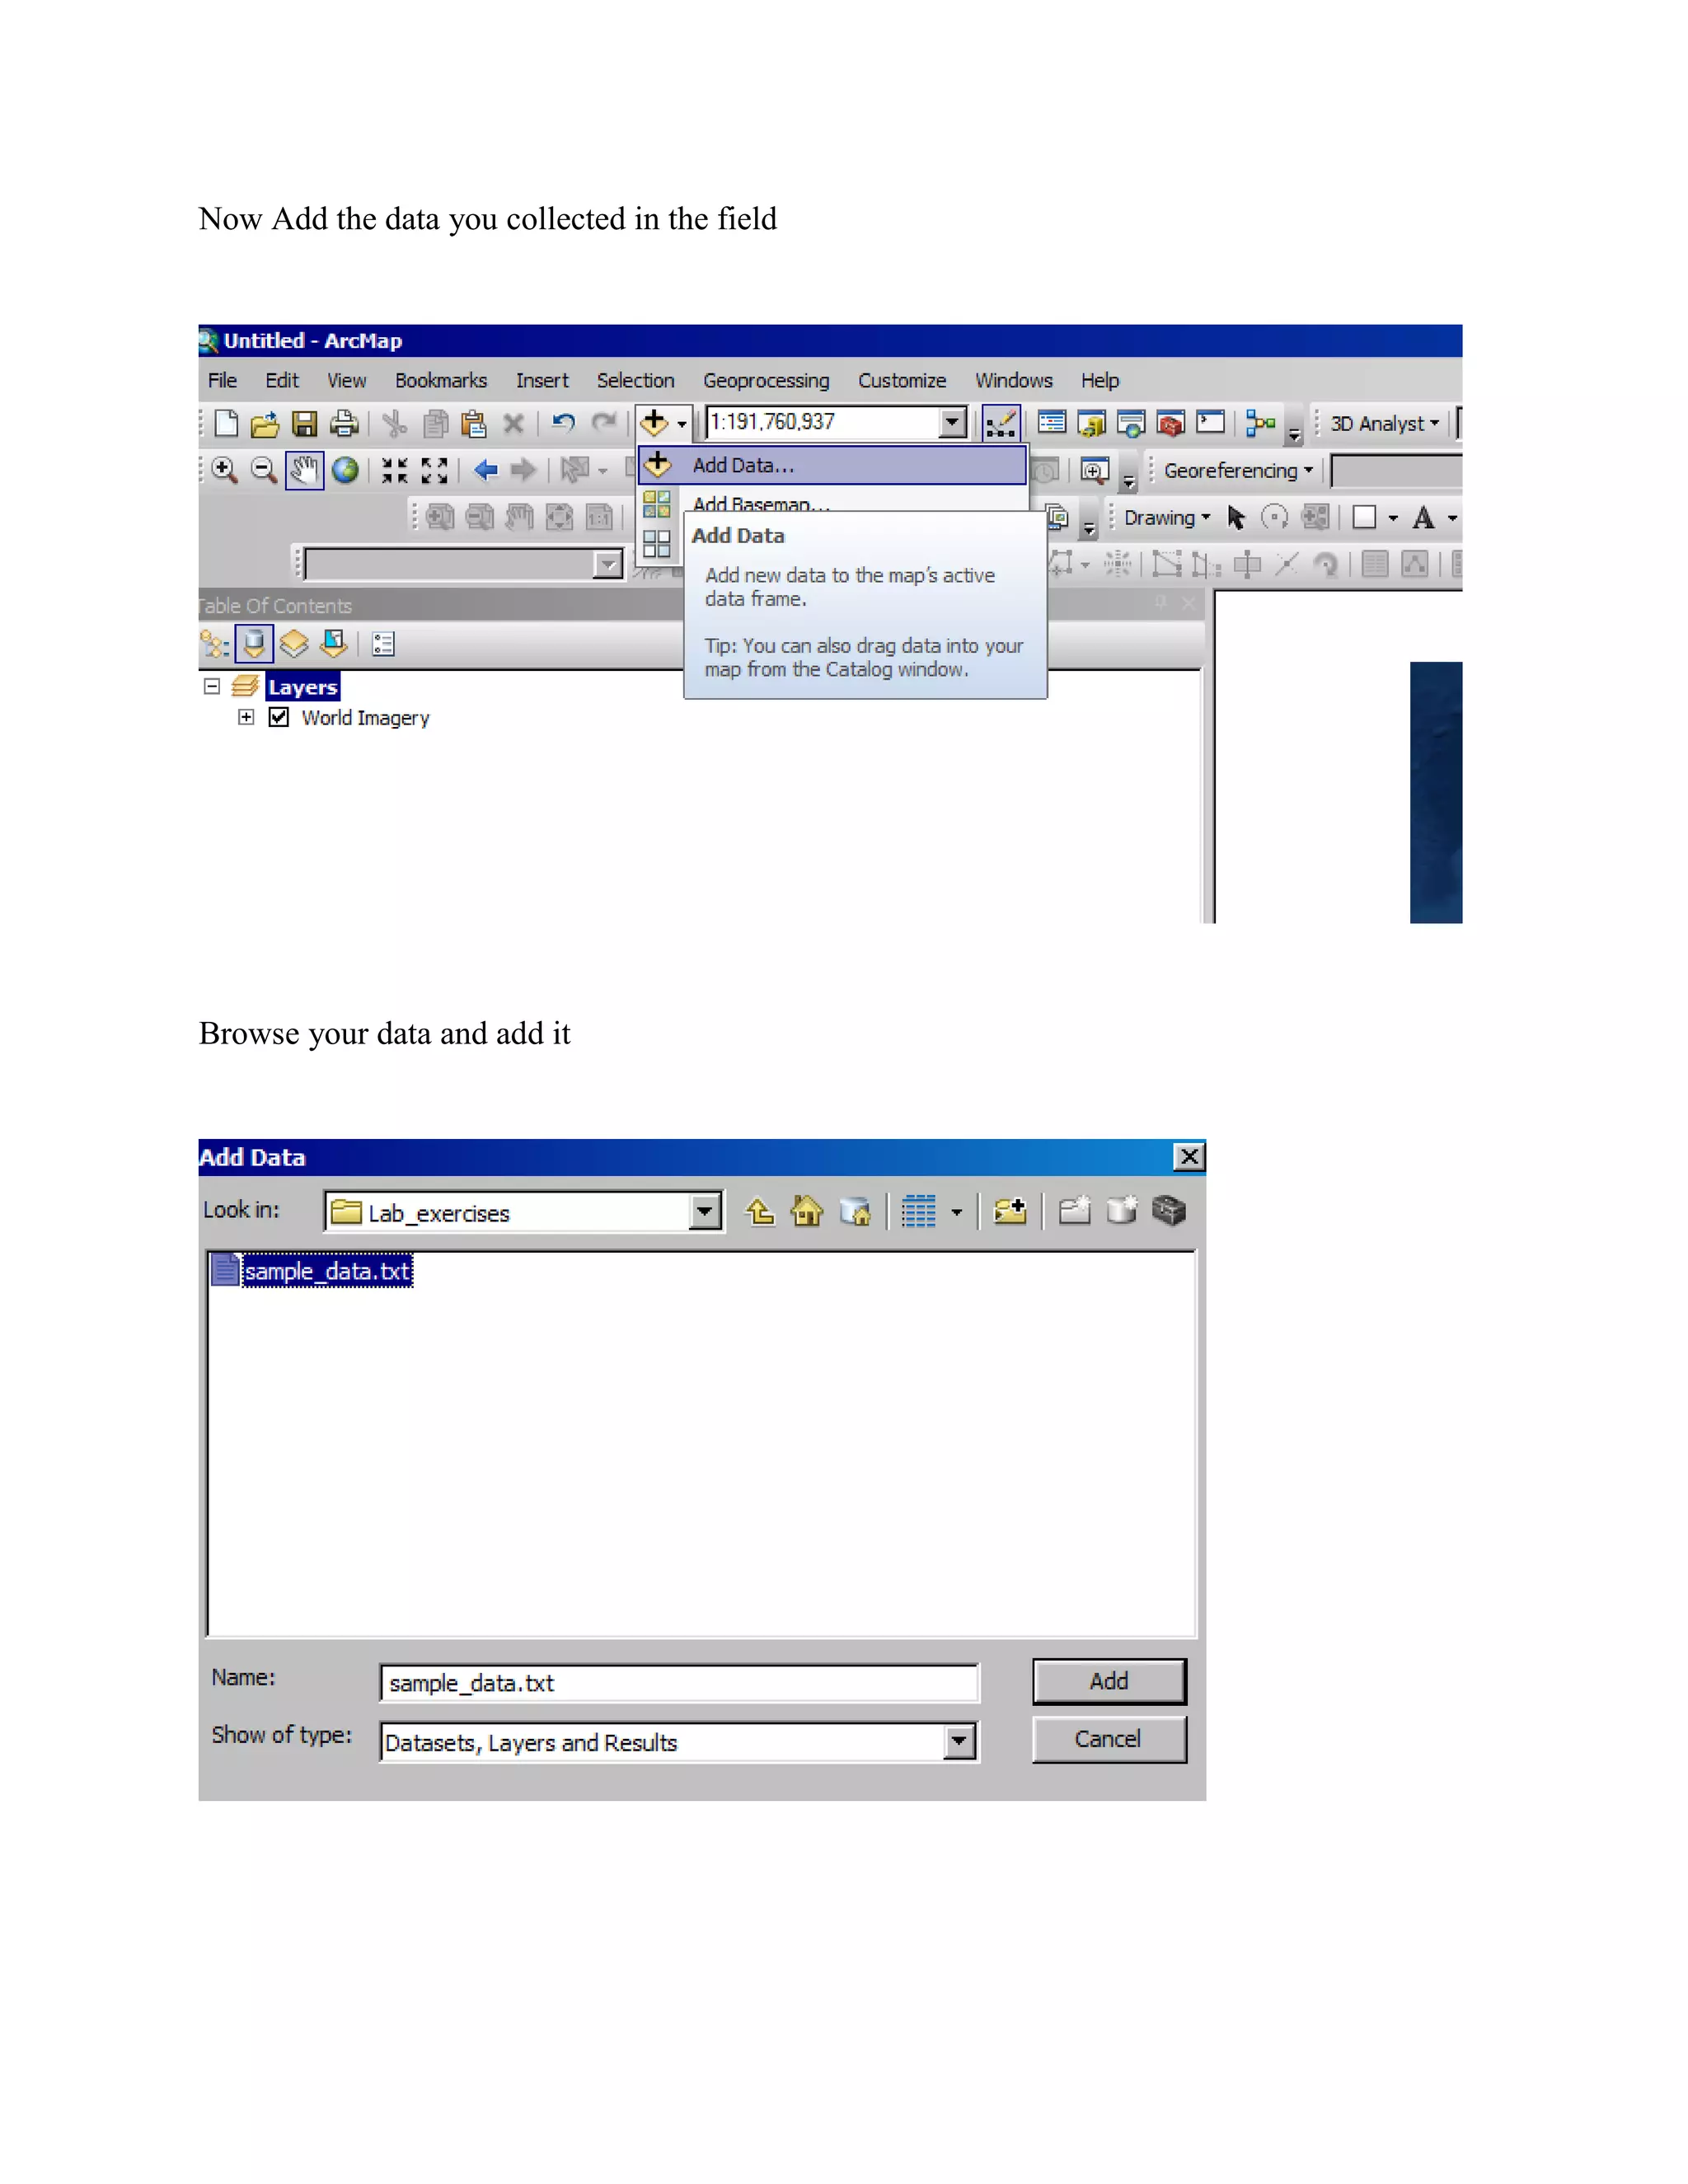
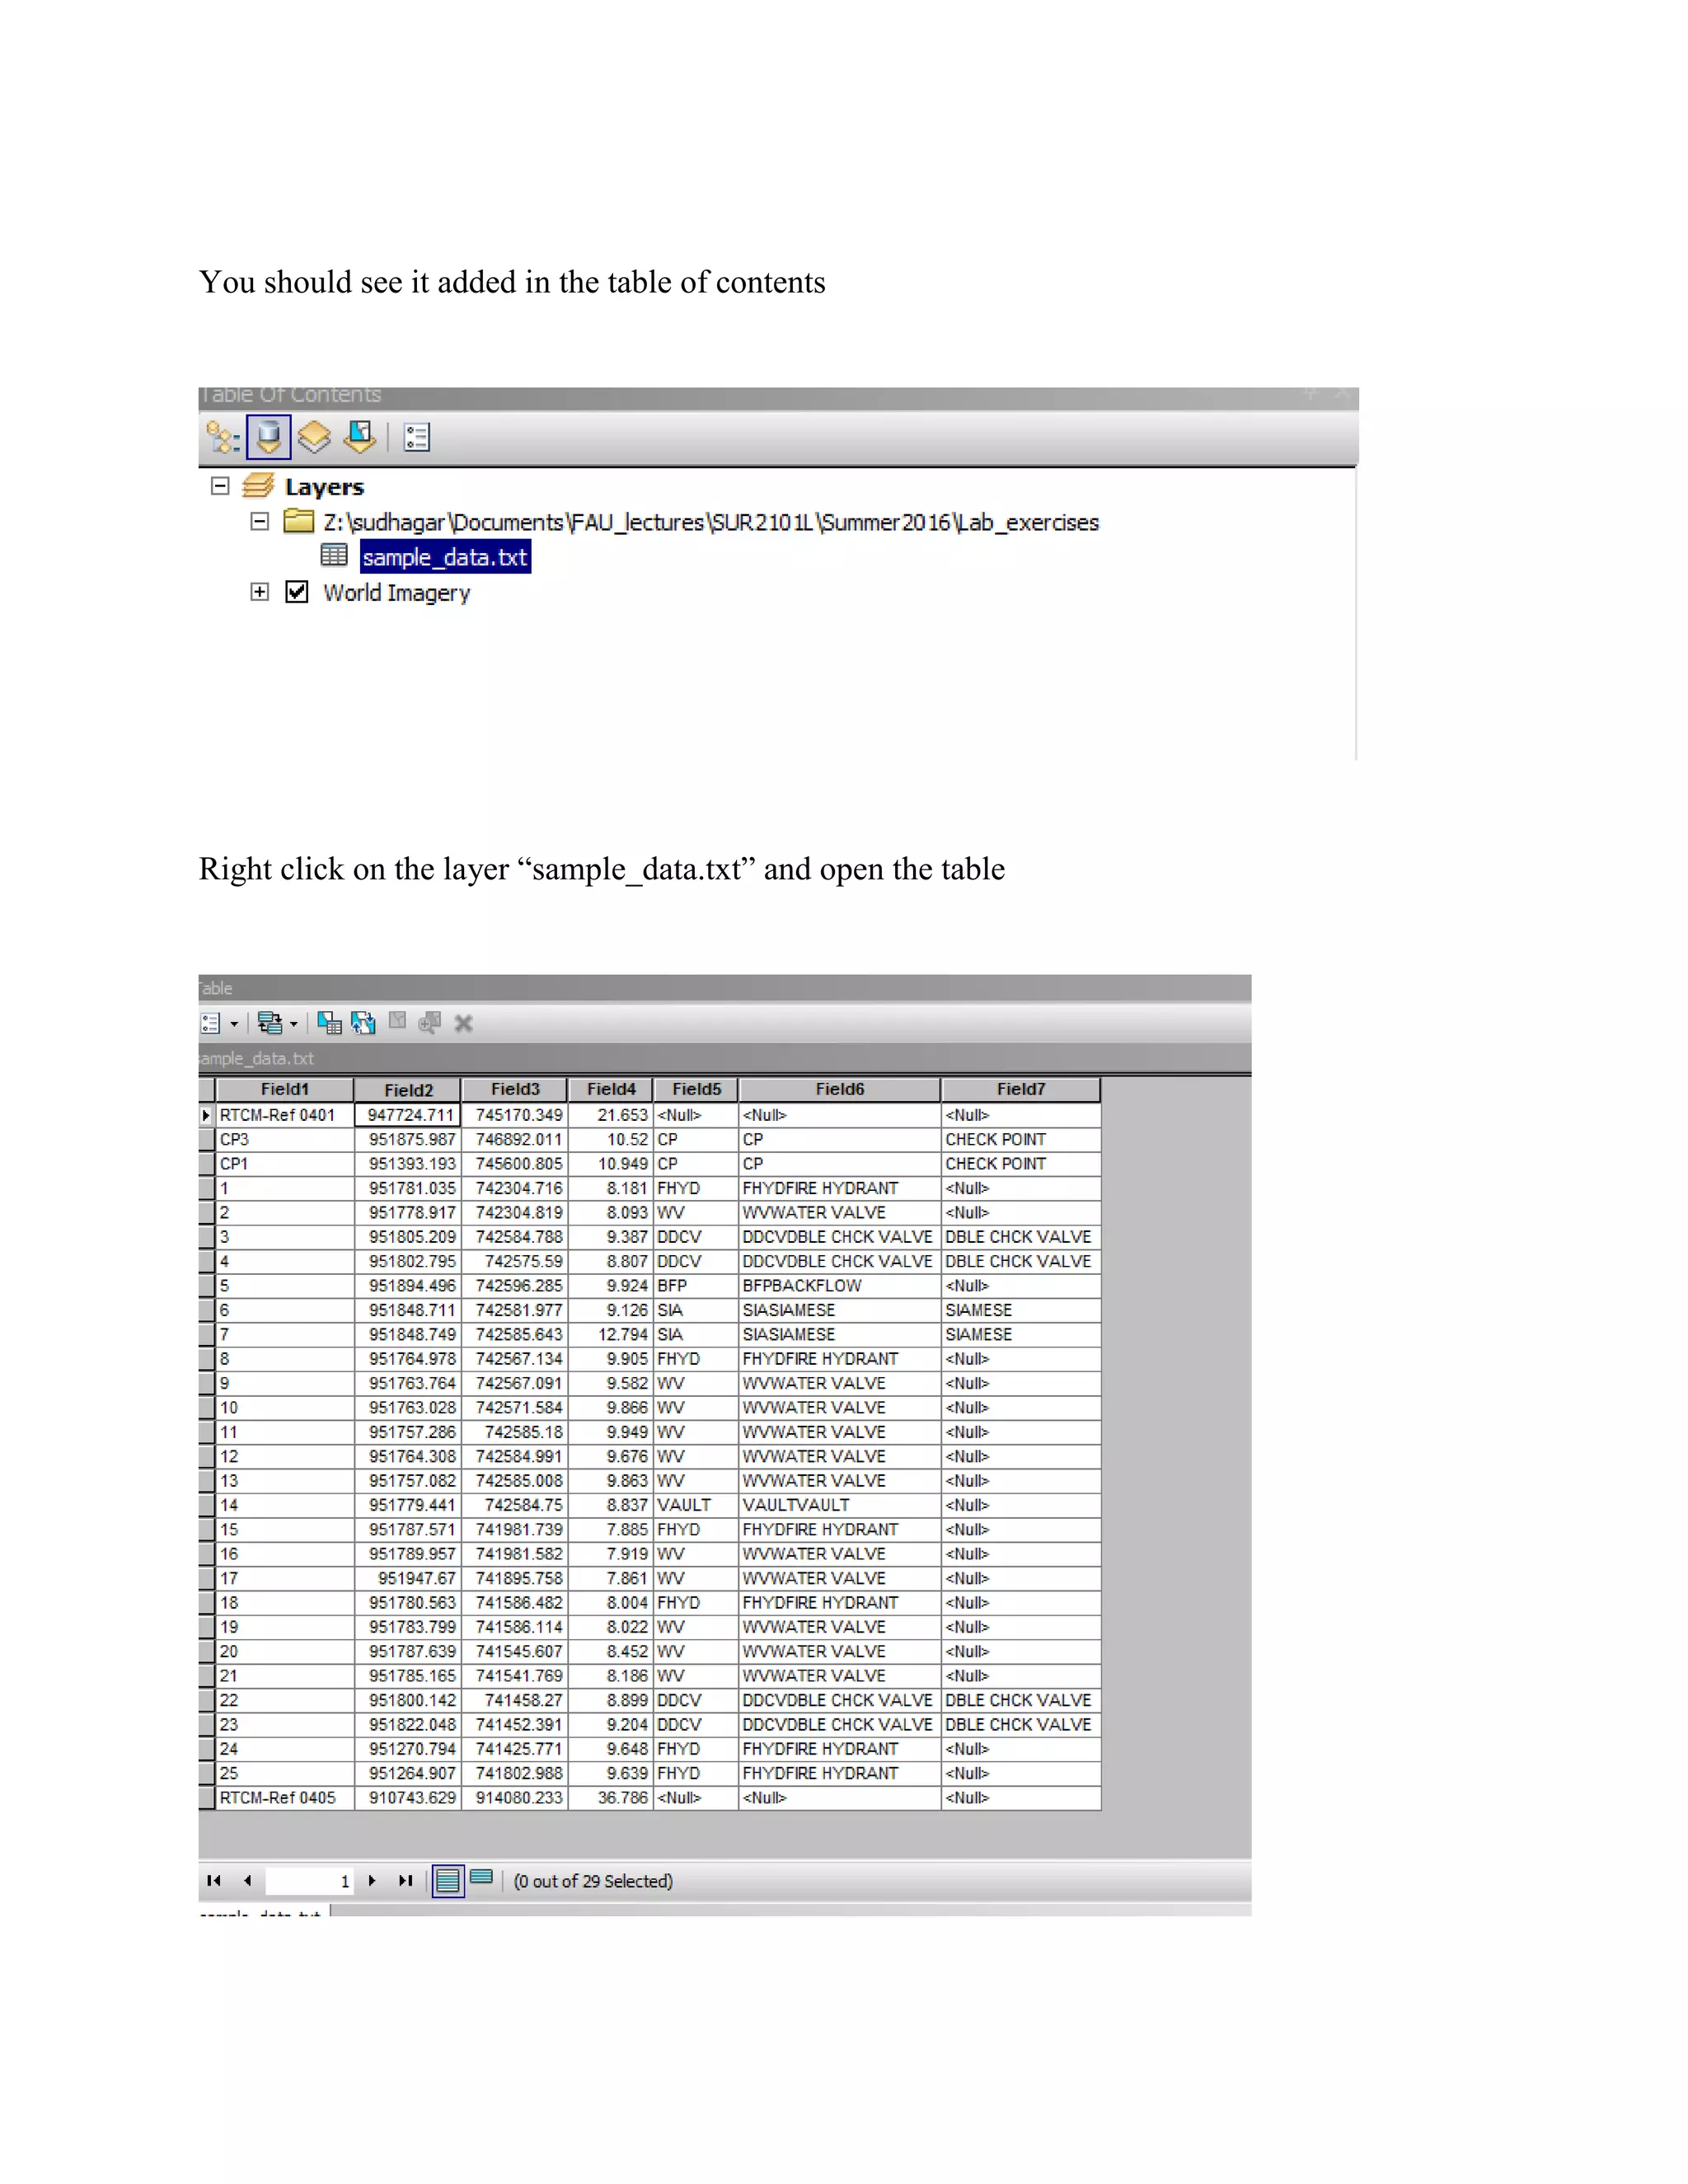
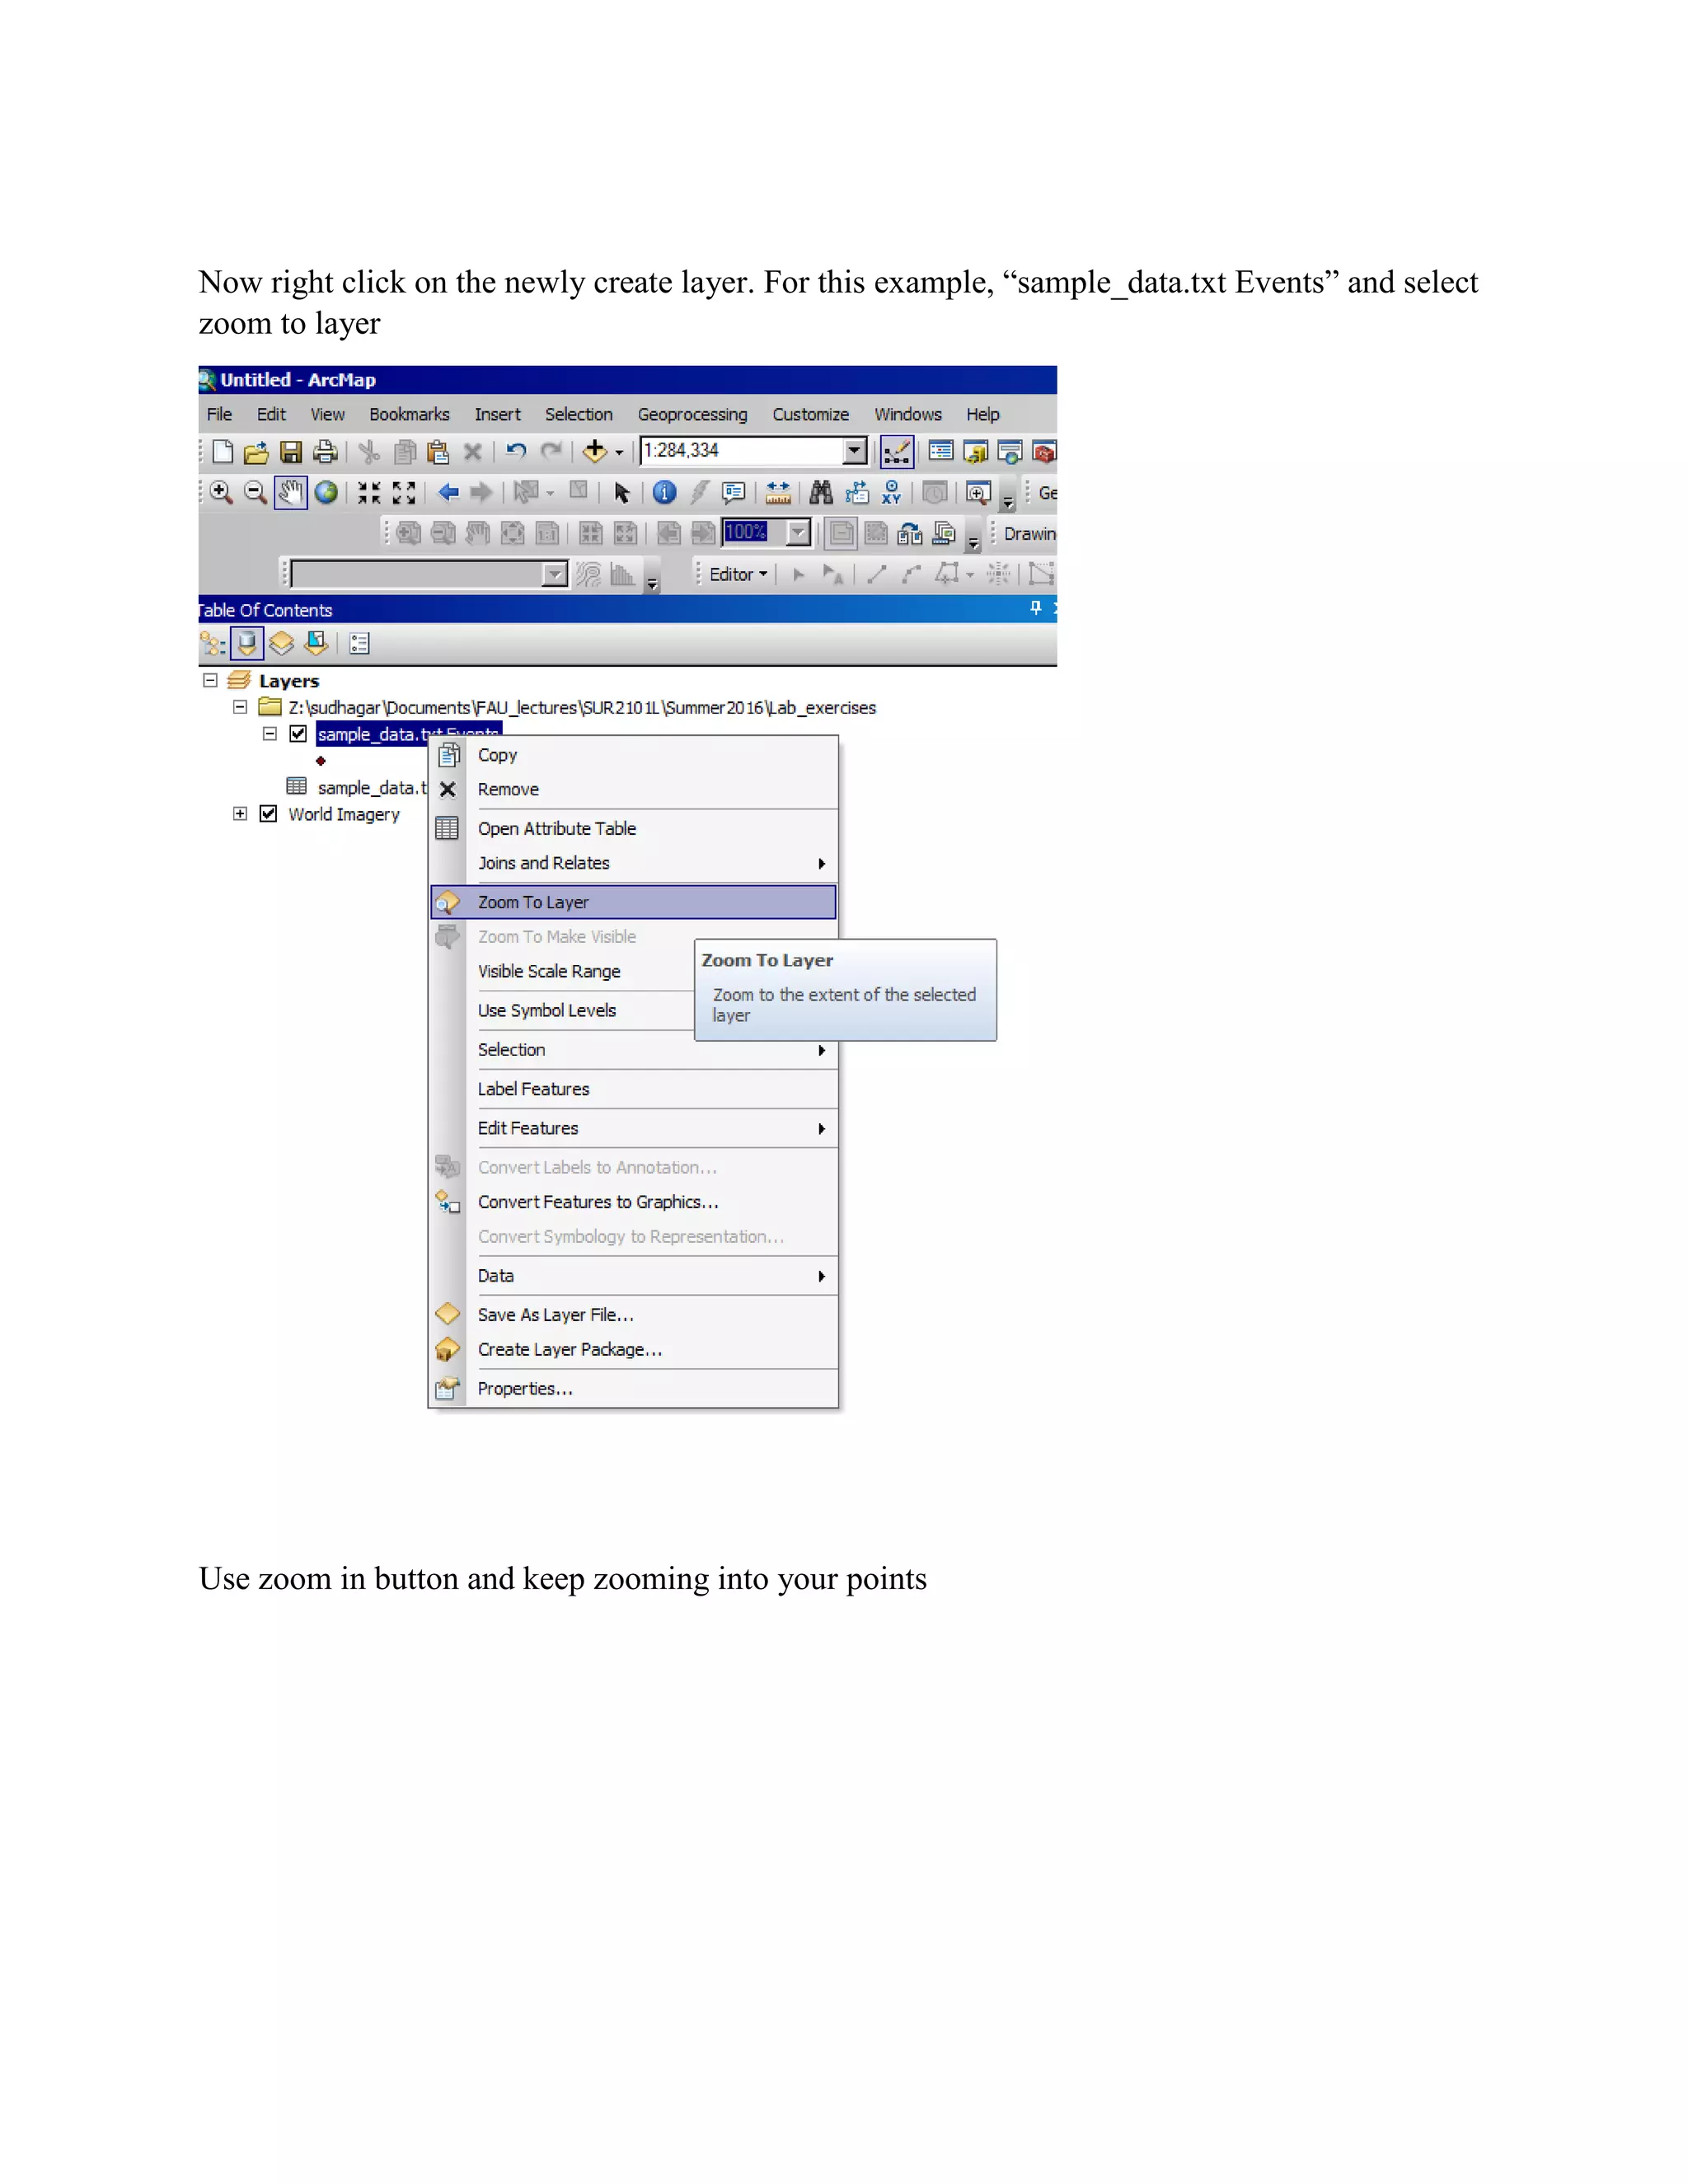
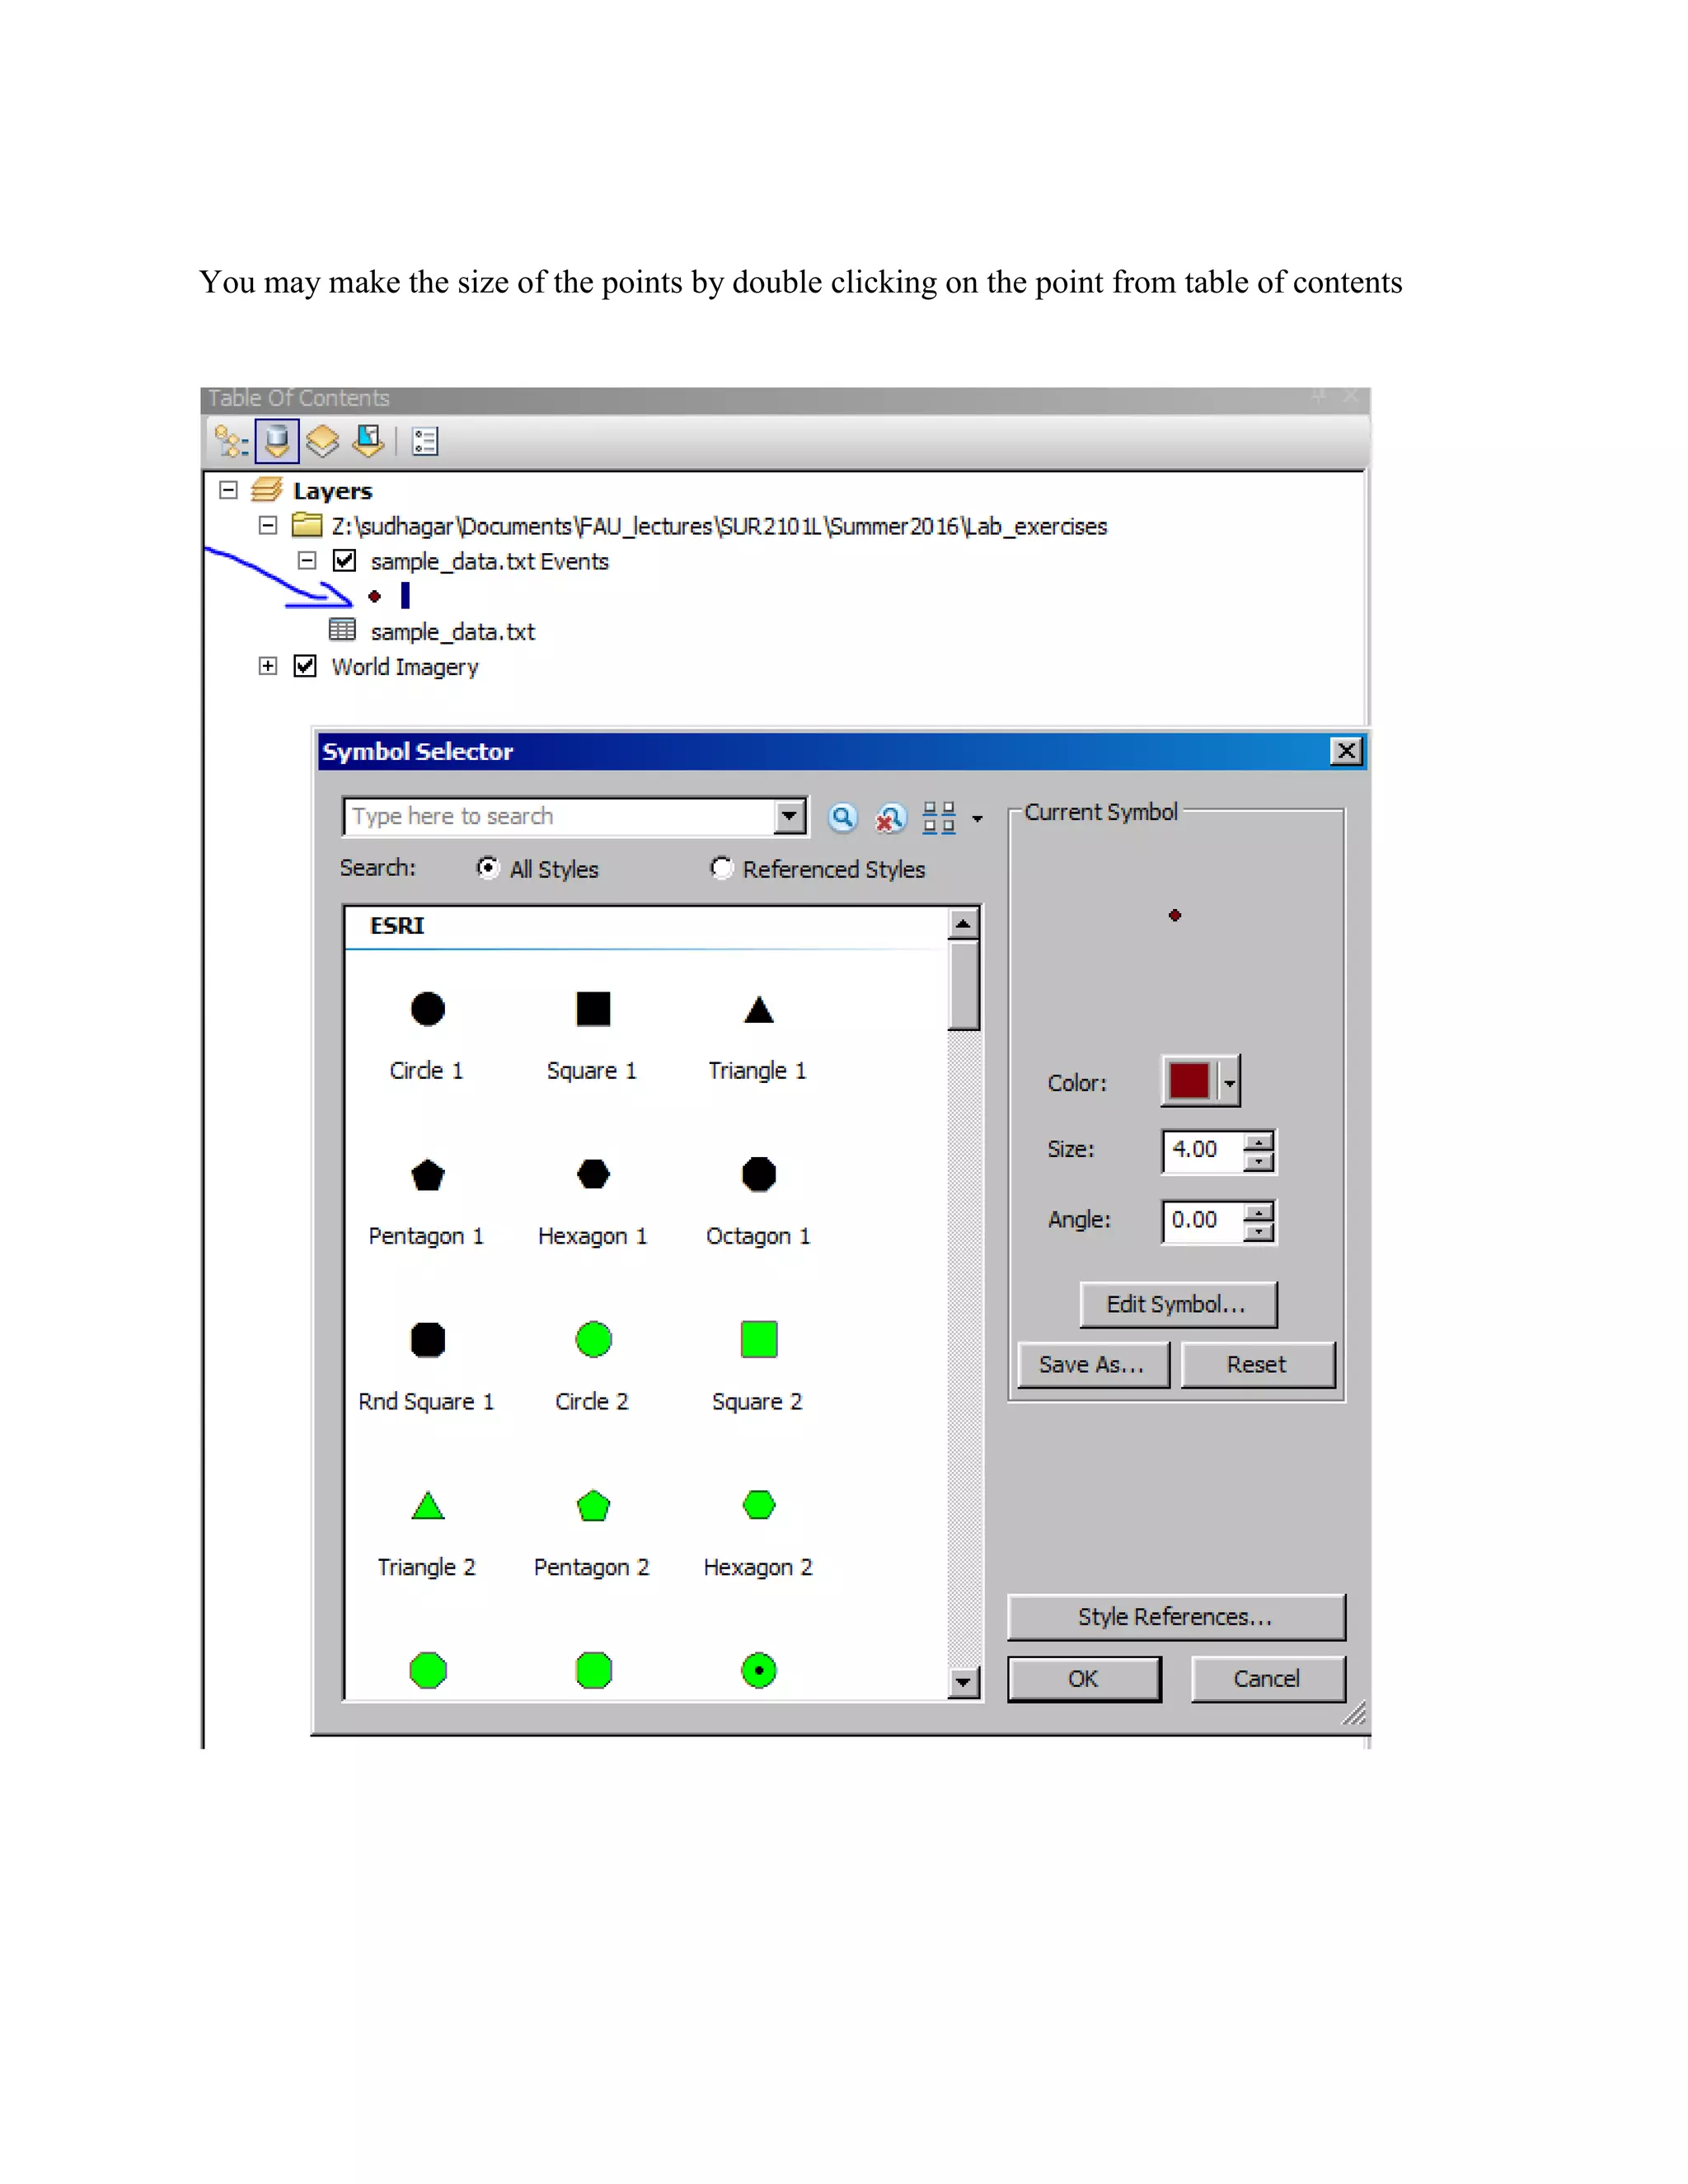
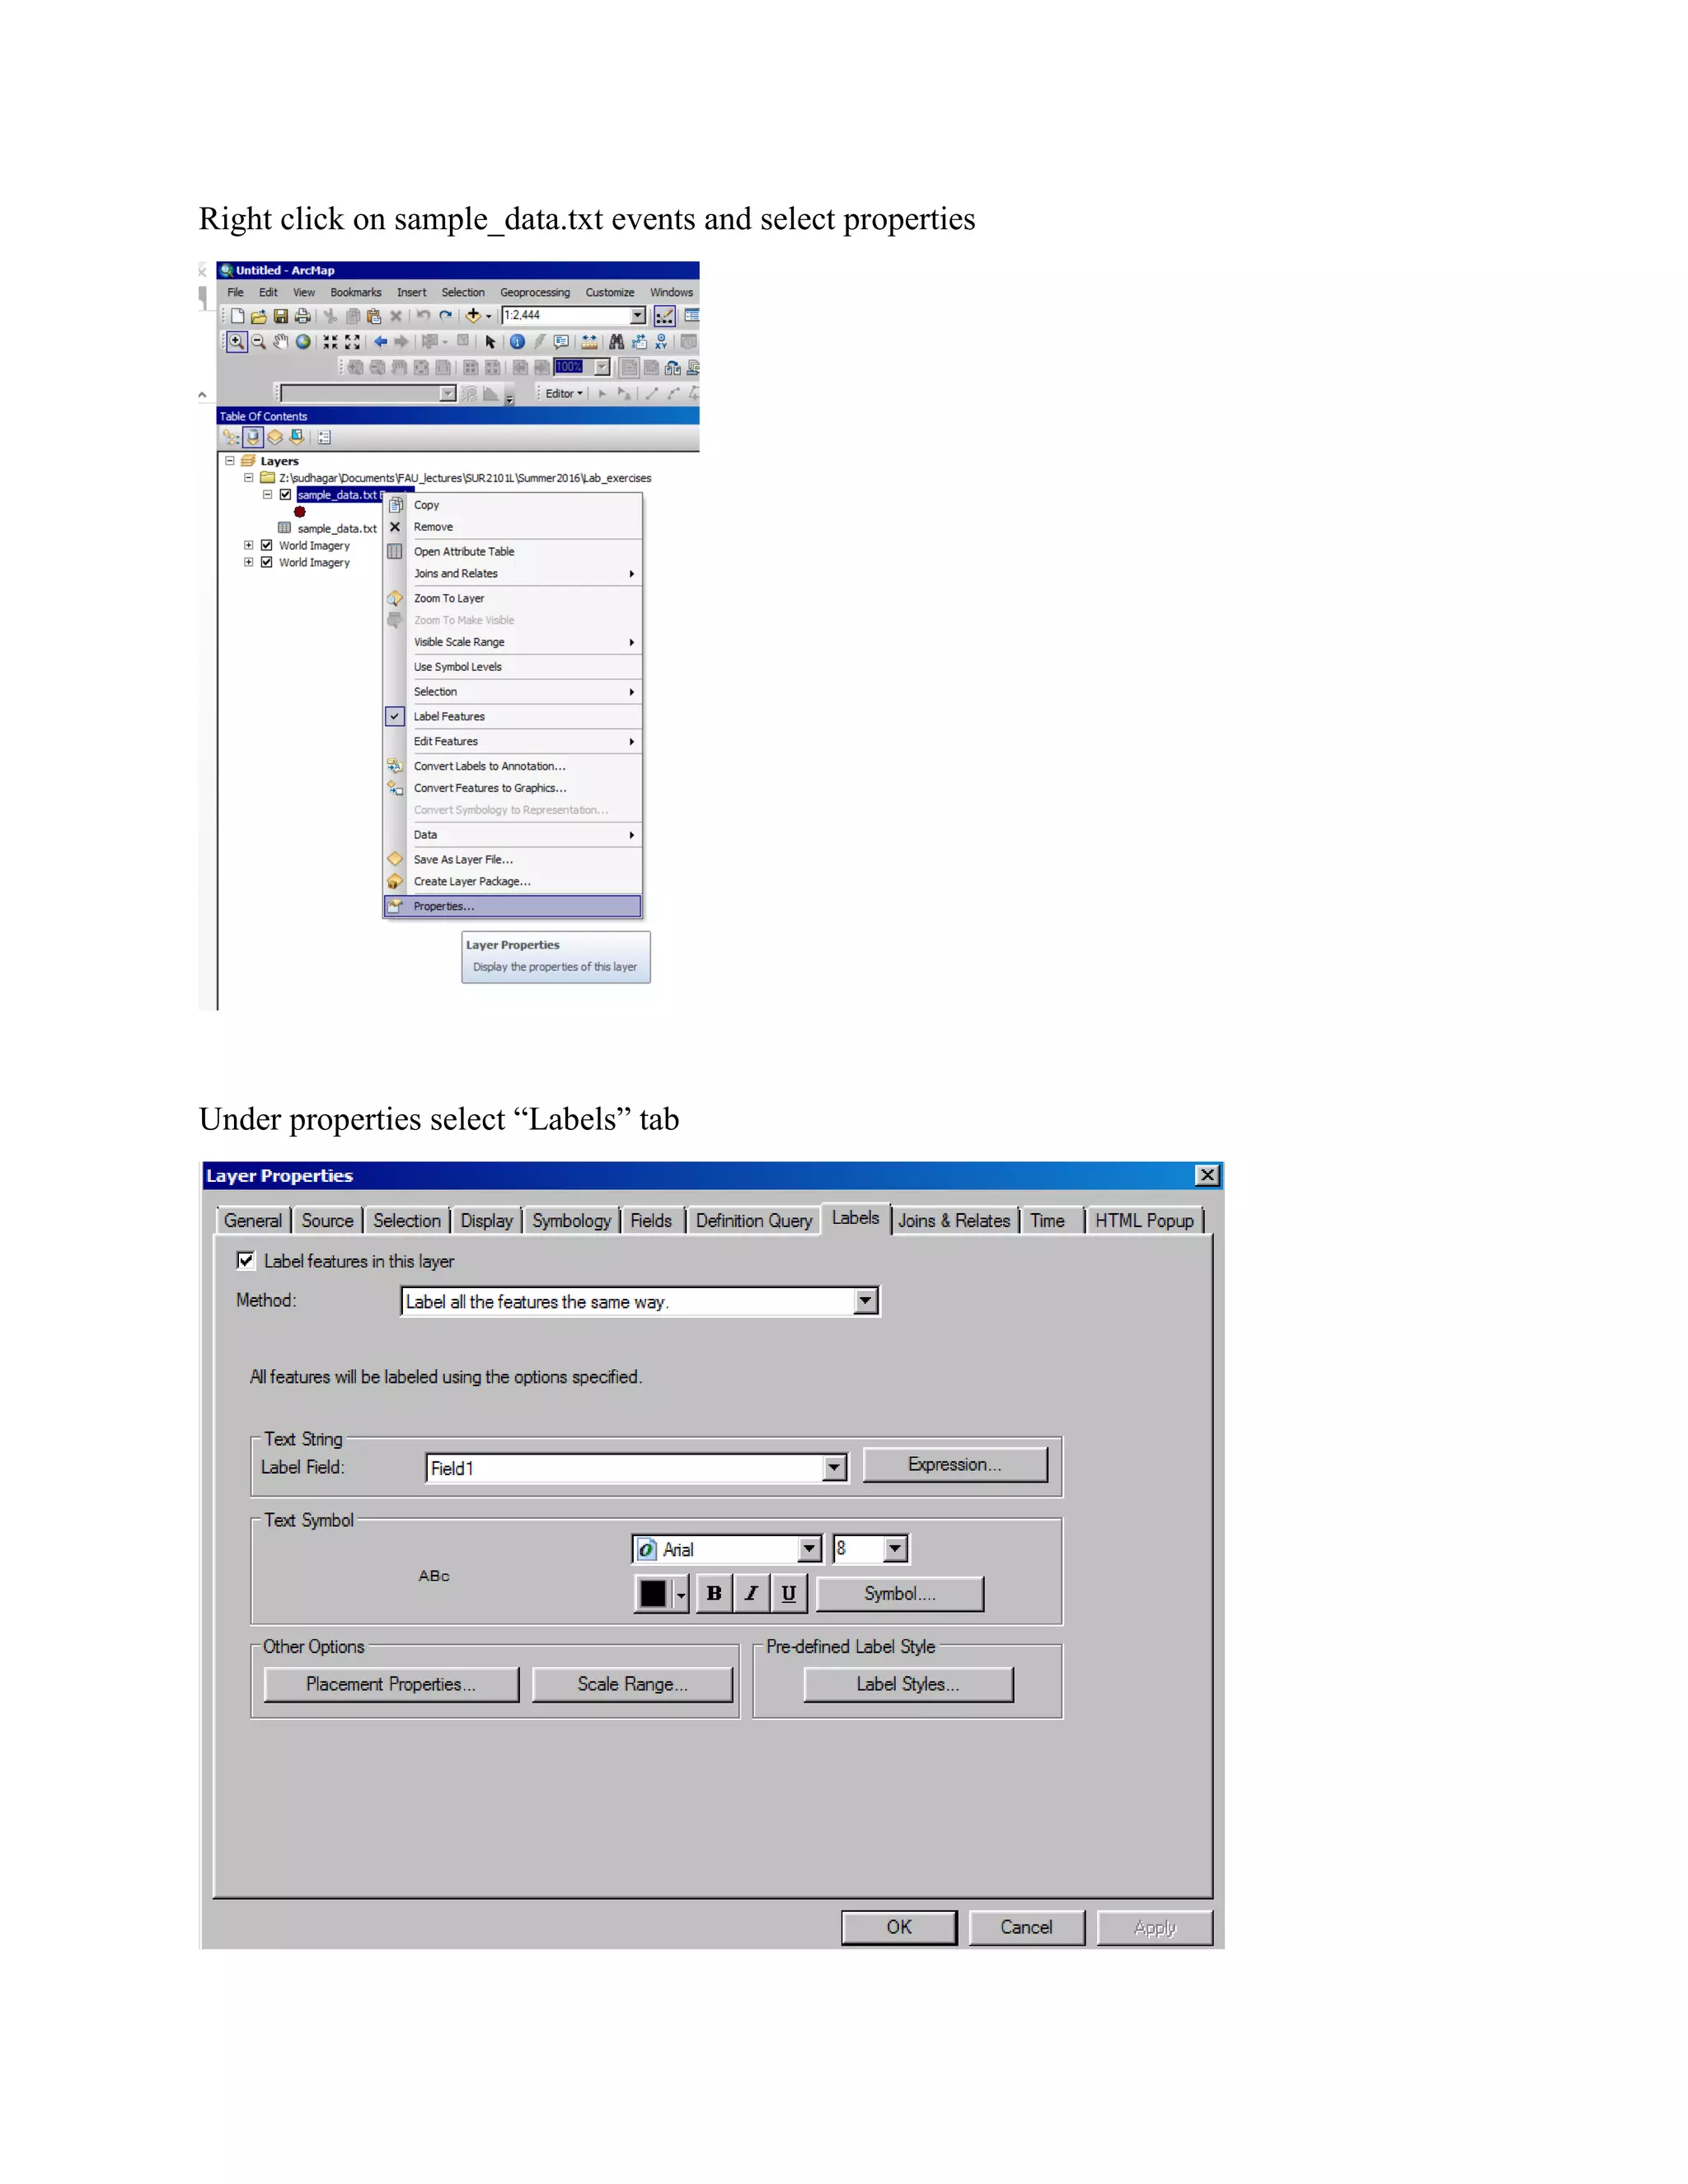
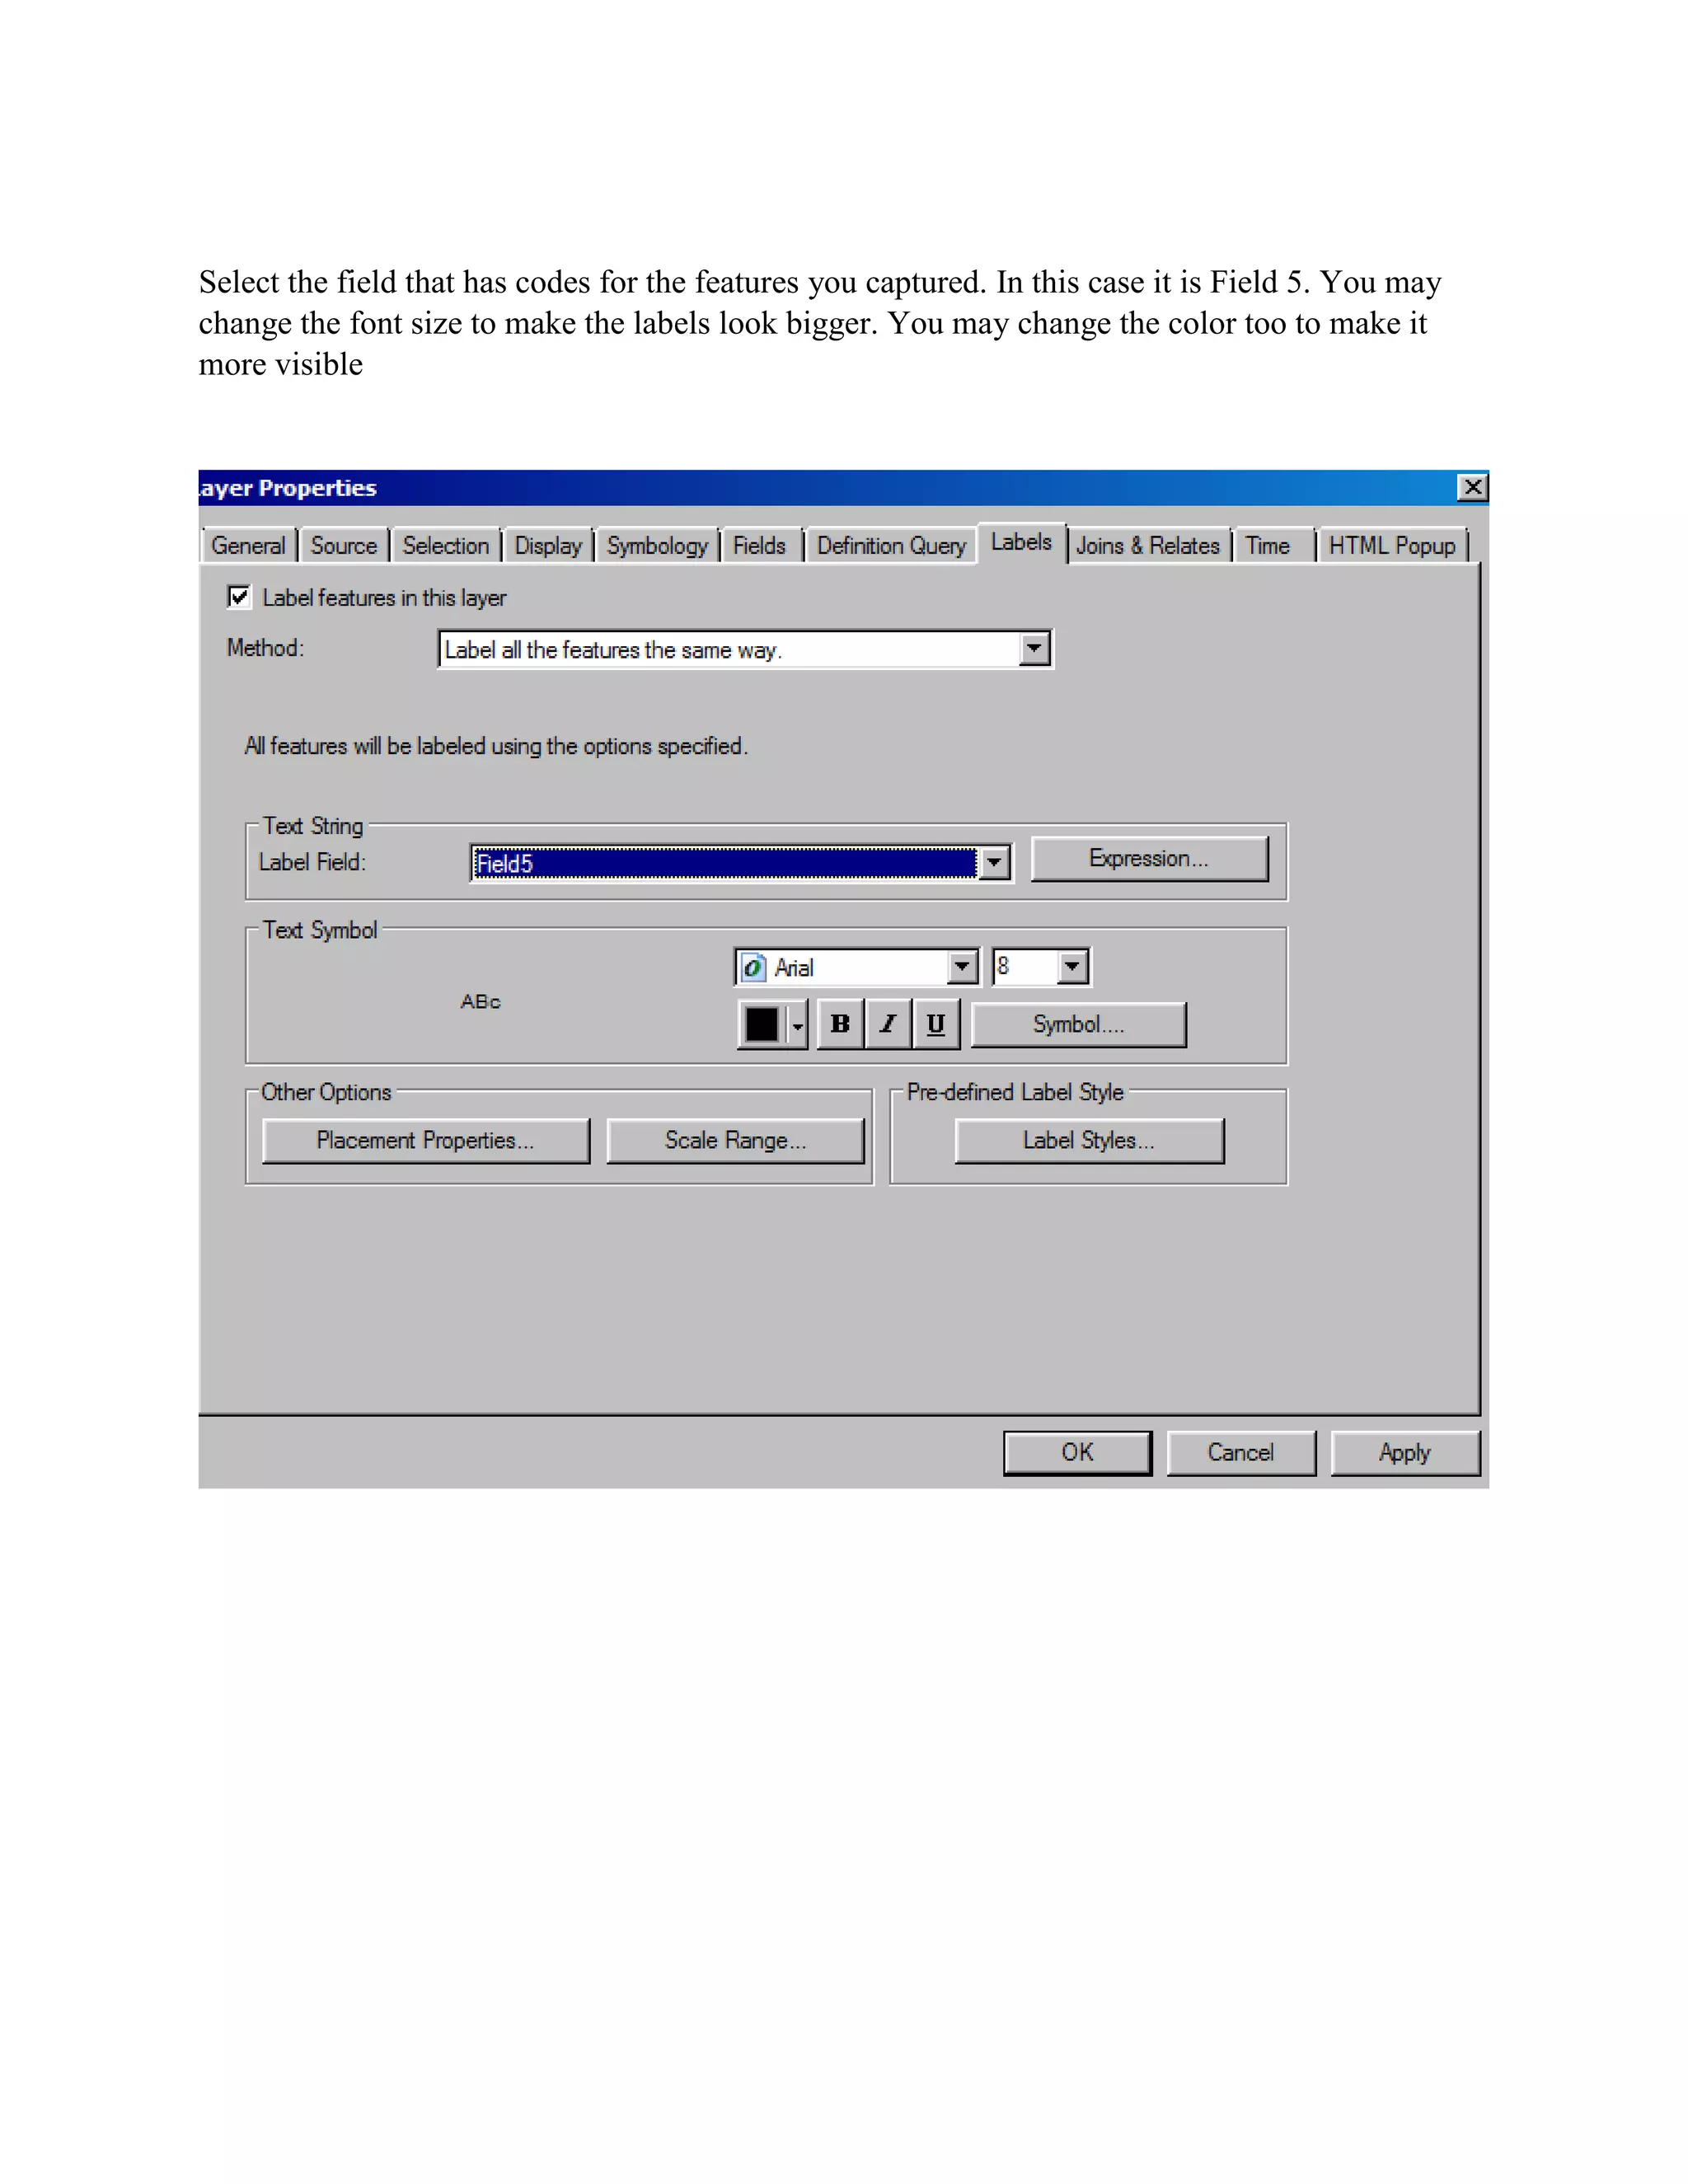
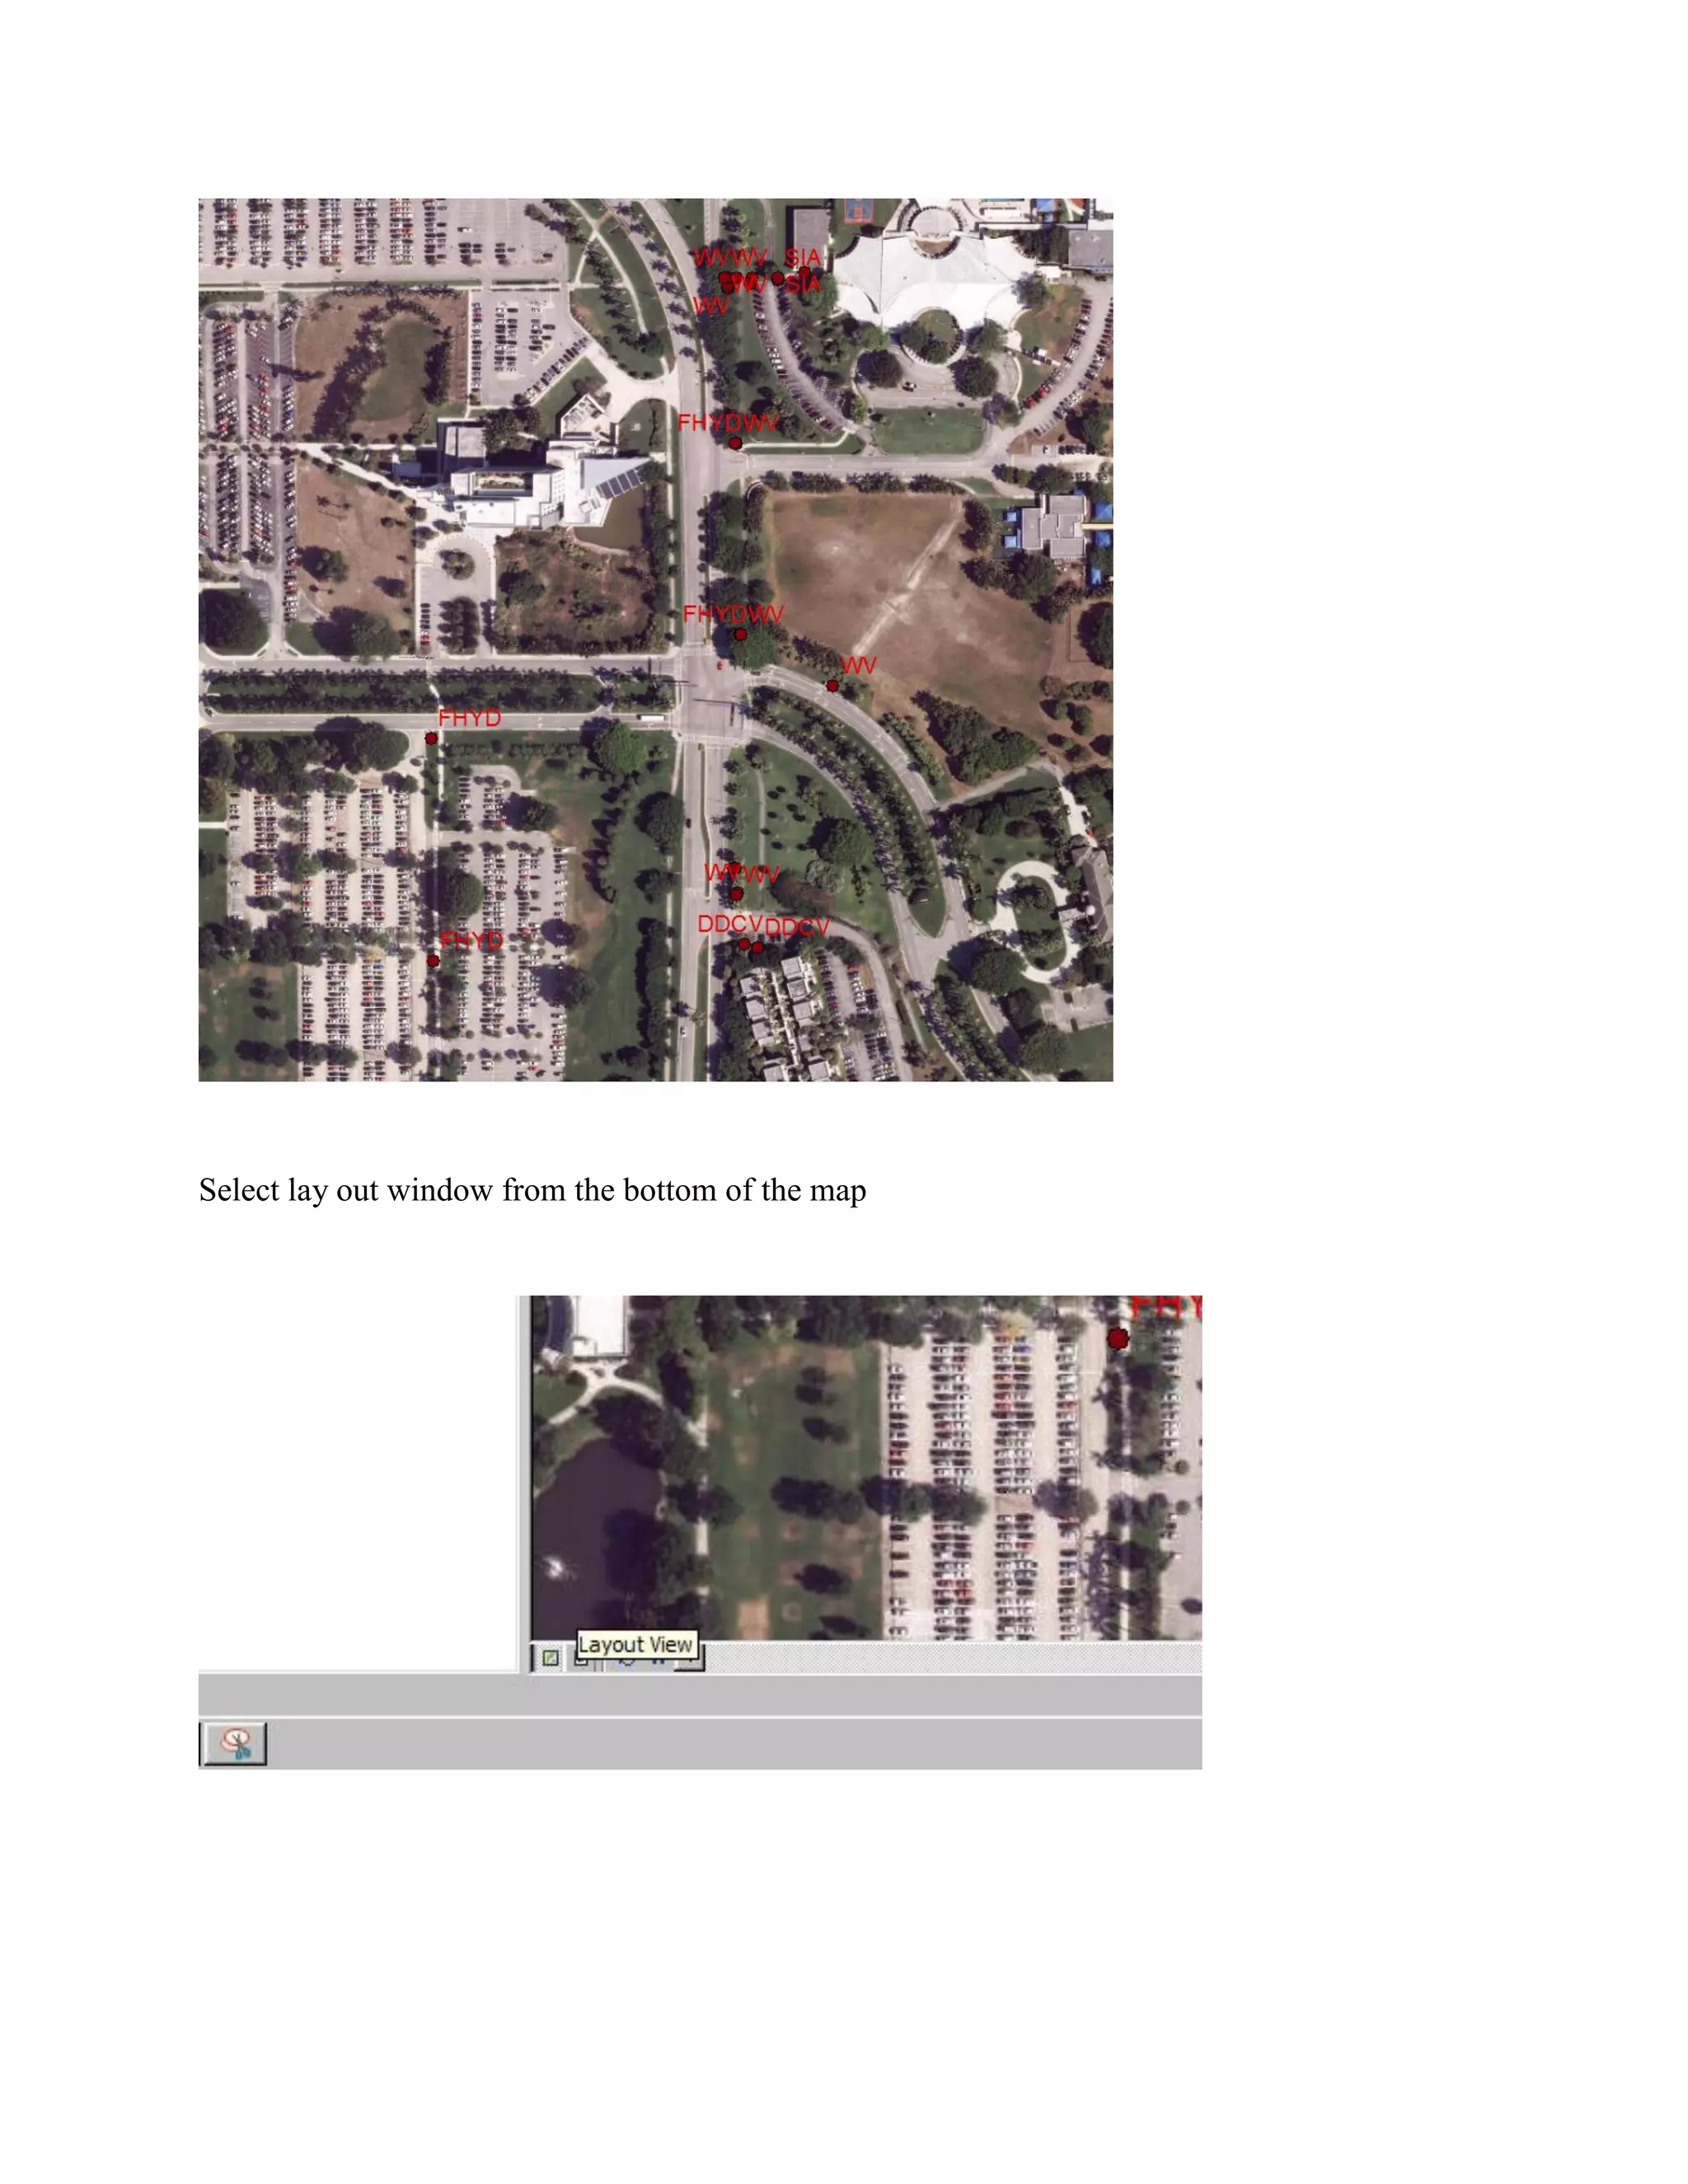
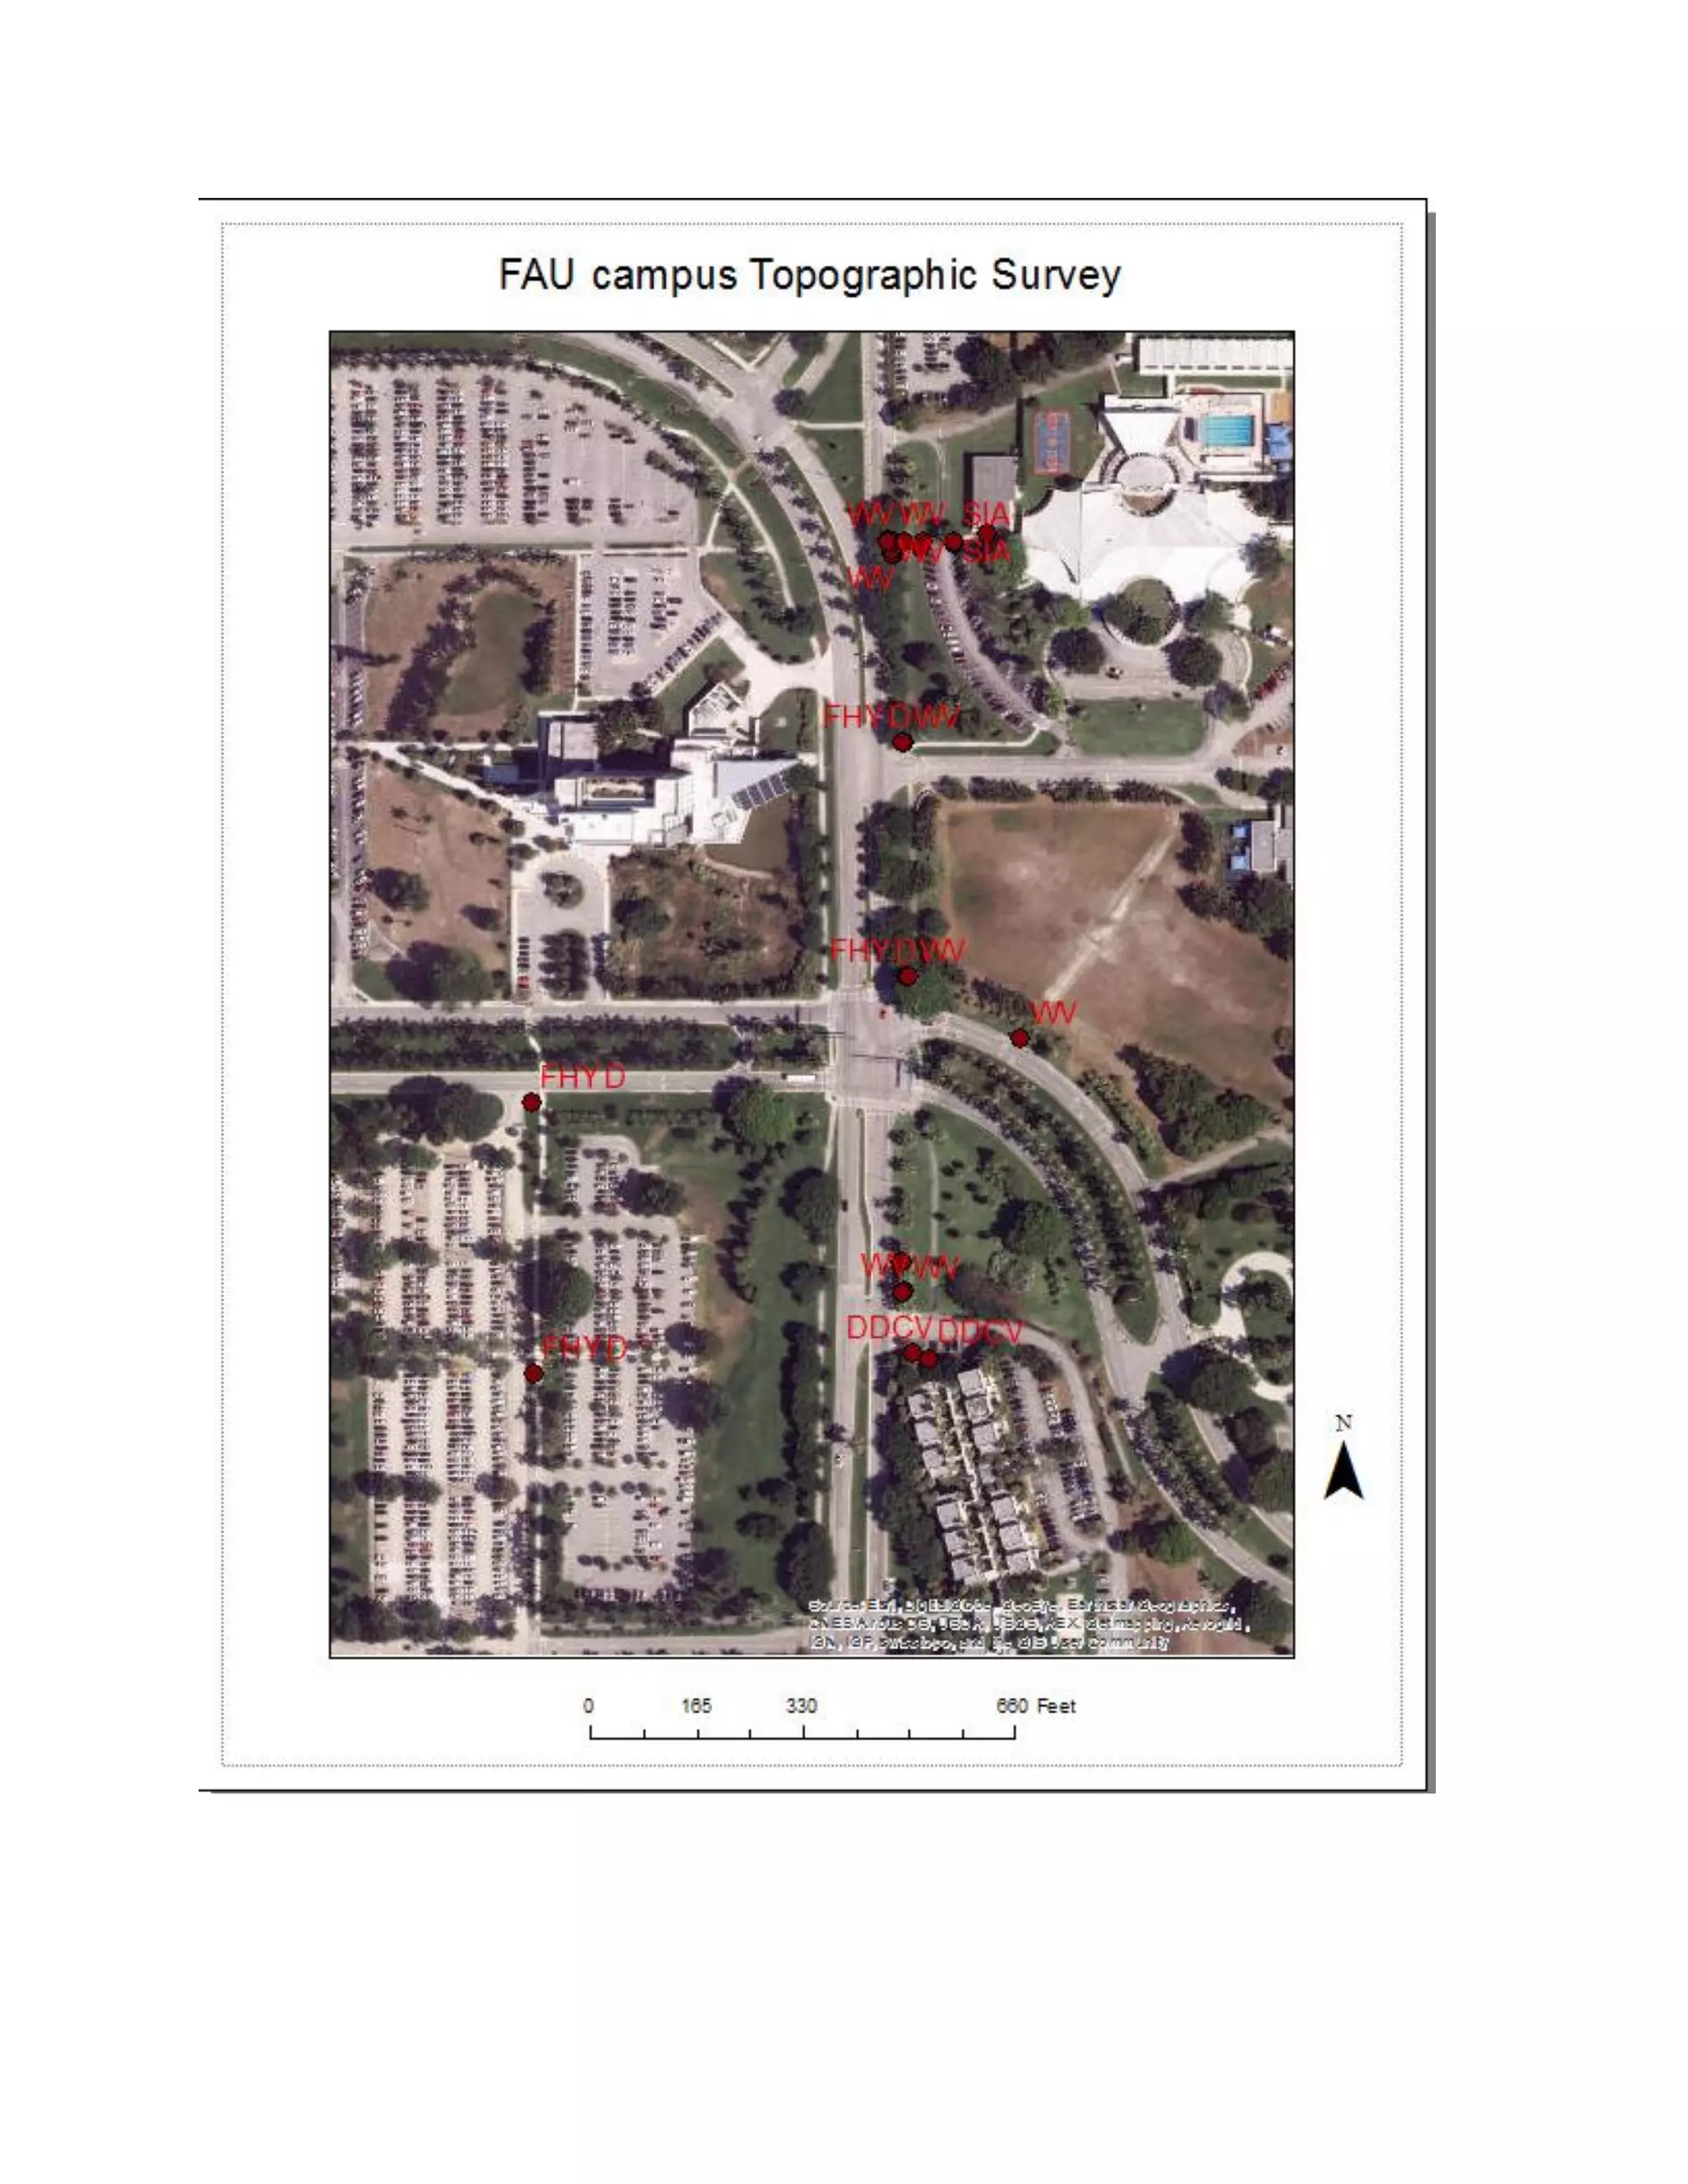
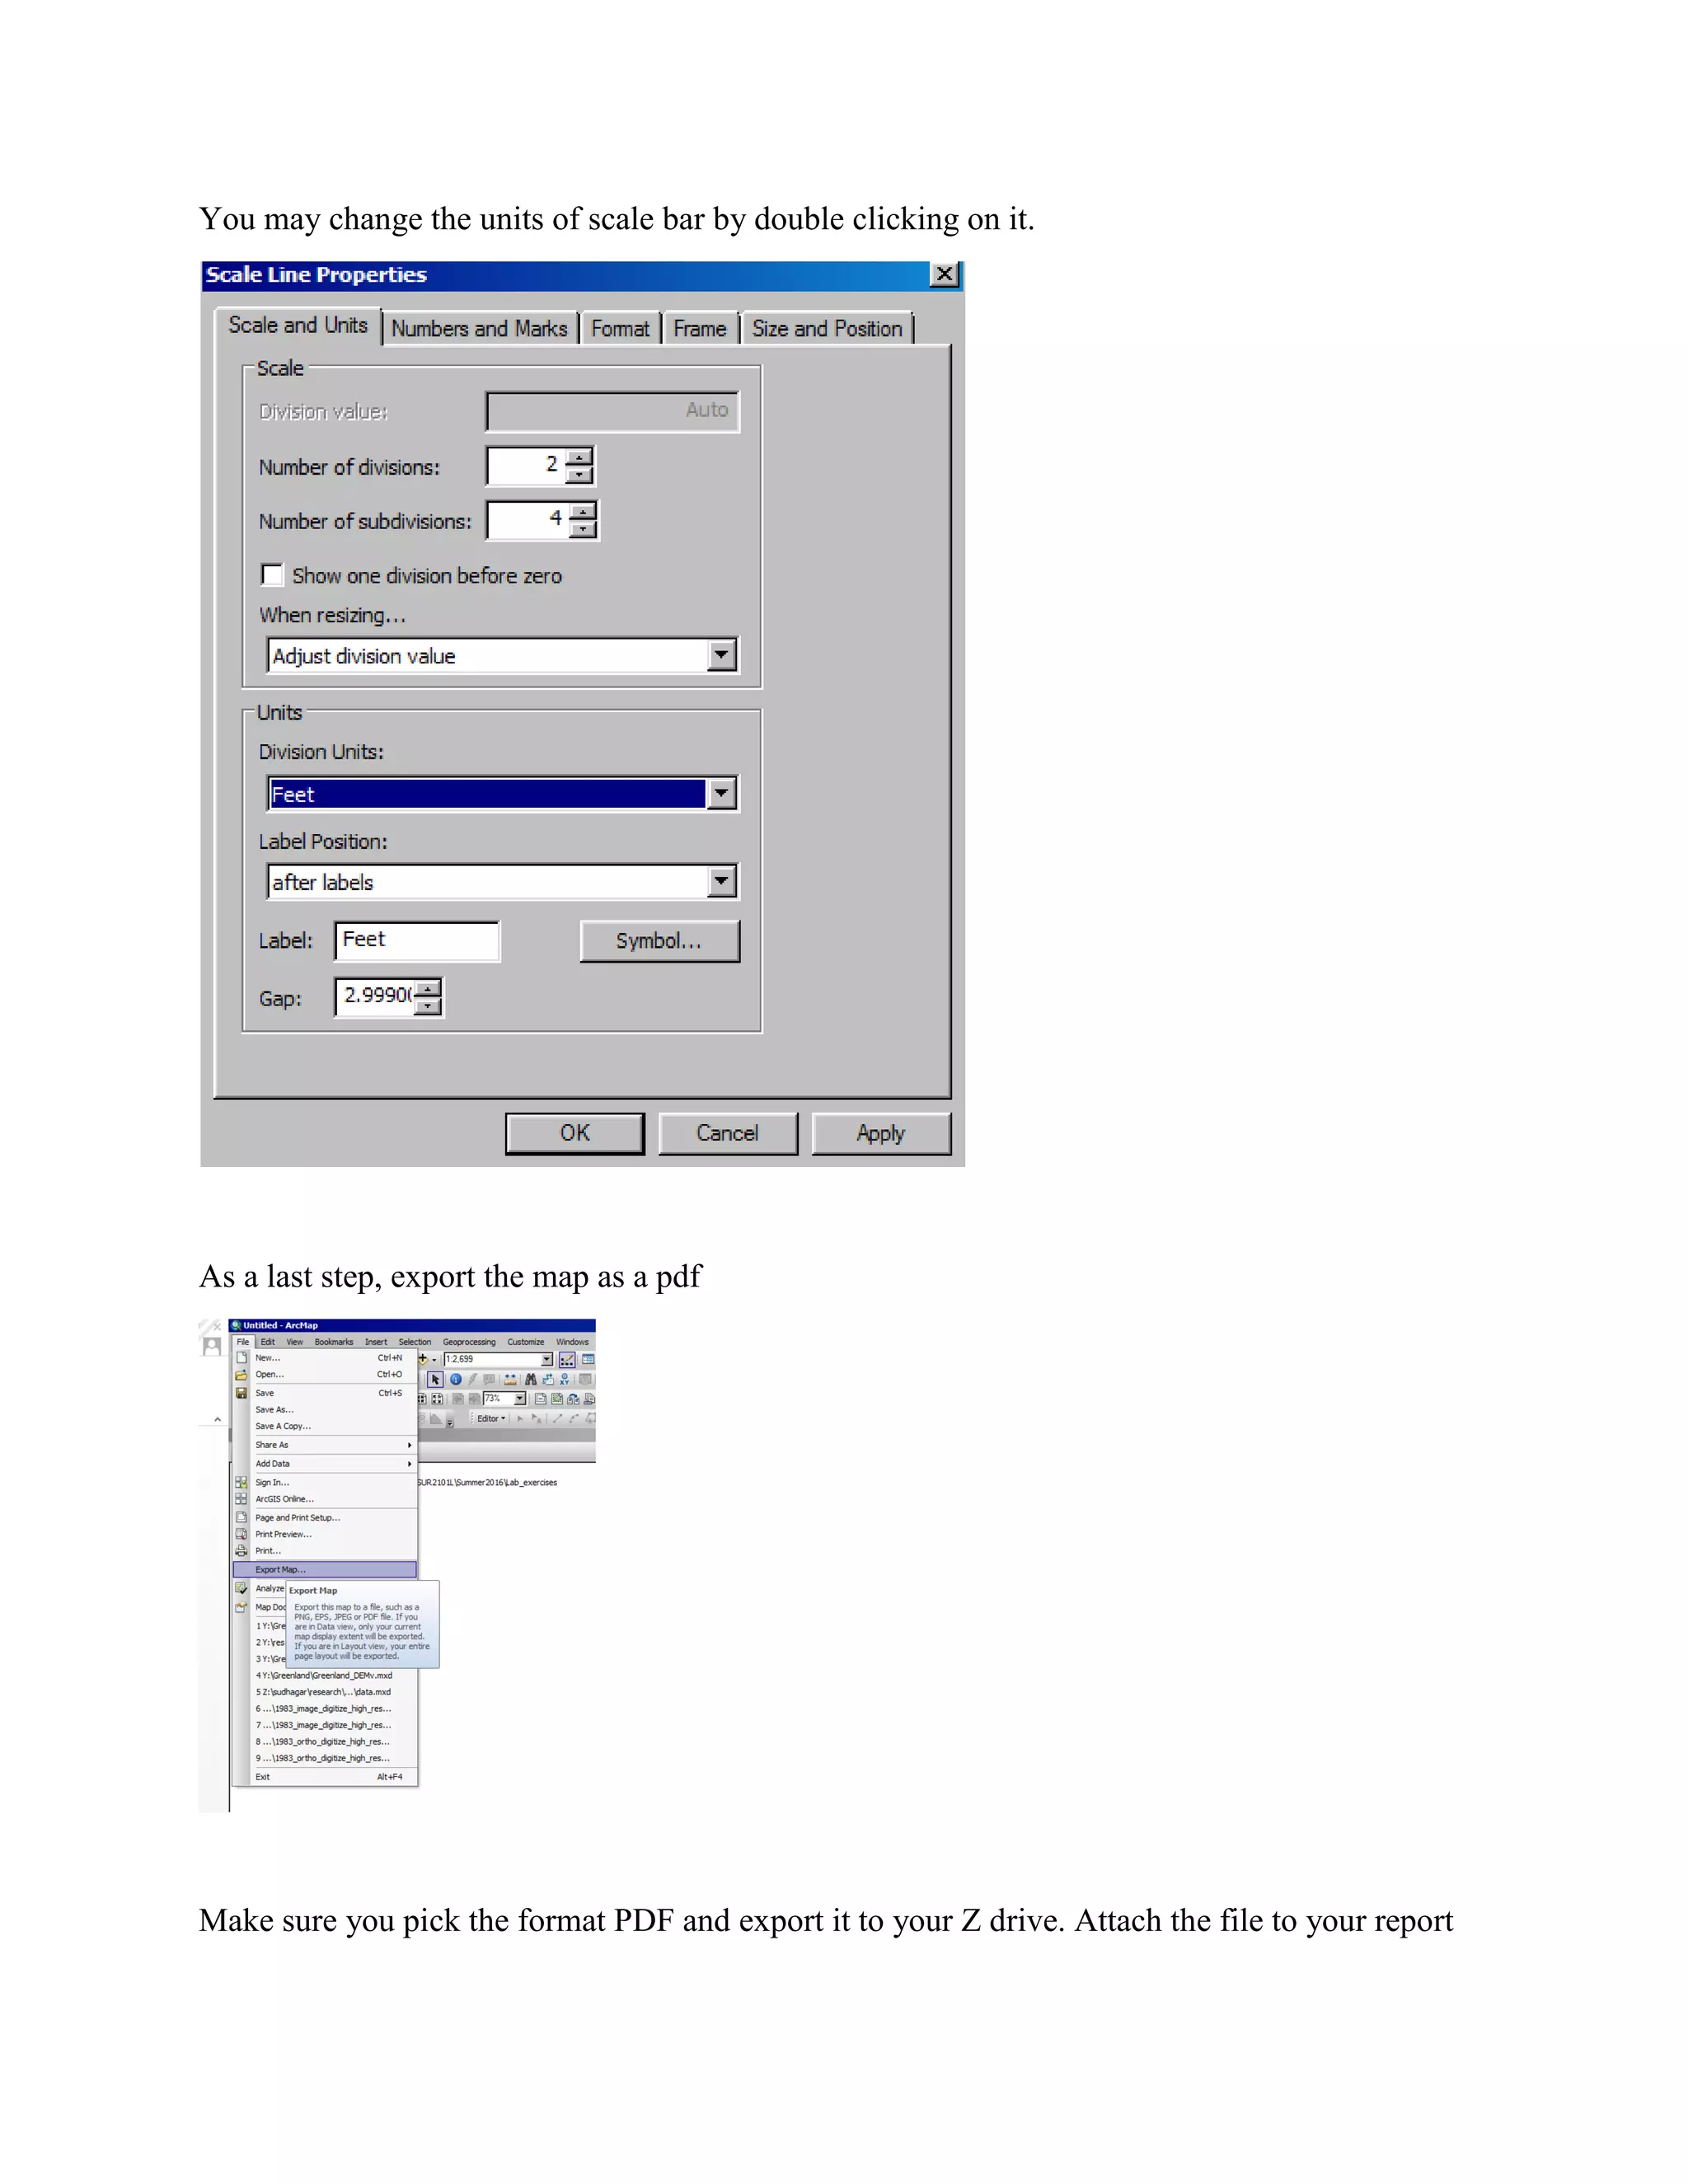
3. In ArcMap, students add the collected data, display XY data using the appropriate fields, and zoom to their points. They add labels, a title, scale bar, and north arrow before exporting the finished map as a PDF.