This document describes a tool developed to help field surveyors convert GPS data for use in a GIS unit. The tool was created using Visual Basic in Microsoft Excel to allow for easy conversion of latitude and longitude coordinates from GPS devices like the Explorist 400/500 and Garmin eTrex to UTM coordinates. It also generates feature codes, performs quality checks on the data, and helps monitor field tasks. Configuration steps are provided to set up the custom toolbar with macros for using the conversion, coding, and checking functions of the tool.
Instruction to MAPINFO
This course is intended to give a brief introduction to MAPINFO on the following aspects:
To get a knowledge of basic functions of MAPINFO and be familiar with normal operations of MAPINFO
To carry out network planning, optimization and map maintenance with MAPINFO
Agile Methodology Approach to SSRS Reporting. How to utilize principles from Agile project management process and utilize it for creating better SSRS reports.
This document contains screenshots and descriptions of various SQL Server Integration Services (SSIS), SQL Server Analysis Services (SSAS), SQL Server Reporting Services (SSRS), PerformancePoint, and SharePoint examples. It demonstrates features like data flows, transformations, cubes, dimensions, calculations, KPIs, stored procedures, reports, dashboards, filters, and publishing reports to SharePoint. The examples cover tasks, transformations, data integration, OLAP modeling, MDX queries, reports, and dashboard design.
This document provides an overview of the basic functions of LibreOffice Calc:
- It describes how to install and open LibreOffice Calc on Windows and the main interface elements.
- The work area is explained, including cells, rows, columns, and how to insert, delete or modify them.
- It covers entering and organizing data, using formulas and functions, and creating graphs from data.
- Various formatting options for cells and conditional formatting are also outlined.
Integration with Office Automation Applications - R.D.SivakumarSivakumar R D .
The document discusses how to integrate and share data between StarOffice applications. It provides instructions on how to insert a spreadsheet cell range into a text document so the data automatically updates. It also describes how to insert a text outline from a document into a presentation, with each heading becoming its own slide. Additionally, it explains how to copy and paste data between applications using drag and drop, and how to insert a database table into a text document.
Working with Star Office Base - R.D.SivakumarSivakumar R D .
The document discusses how to work with StarOffice Base including creating databases, tables, queries, filters and forms. The key steps are:
1. Open StarOffice Base to begin working. Create a new database or open an existing one.
2. Create tables by designing fields, data types, and a primary key. Enter data into the tables.
3. Create queries using the Query Wizard to filter and sort table data based on specified criteria.
4. Apply filters to tables to temporarily hide records that don't match filter conditions.
The document discusses customizing forms in a database system. It provides an overview of the form designer tool for modifying forms and databases. Key options in form design mode include modifying font settings, adding or removing rows and columns, and adjusting field properties like name, description, type, and lookup settings. When customizing is complete, the changes are saved and the form is refreshed.
Data > Consolidate provides a way to combine data from two or more ranges of cells into a new range while running one of several functions (such as Sum or Average) on the data. During consolidation, the contents of cells from several sheets can be combined into one place. The effect is that copies of the identified ranges are stacked with their top left corners at the specified result position, and the selected operation is used in each cell to calculate the result value.
Data Analysis
Creating subtotals
Sharing documents
Saving versions
Calc Macros
Itm310 problem solving #7 complete solutions correct answers keySong Love
ITM310 - Problem Solving #7 complete solutions correct answers key
Find the solution at
http://www.coursemerit.com/solution-details/15330/ITM310---Problem-Solving-7-complete-solutions-correct-answers-key
This document outlines the objectives and steps to create and manage a Microsoft Access 2007 database, including:
1) Creating a database file and designing tables, forms, queries, and reports to enter and display data
2) Populating tables with data and formatting fields
3) Designing forms and queries to view, enter, and extract specific data
4) Creating reports to output selected data
5) Properly closing and exiting the Access program and database
You can enter formulas in two ways, either directly into the cell itself, or at the input line. Either way, you need to start a formula with one of the following symbols: =, + or –. Starting with anything else causes the formula to be treated as if it were text.
Creating Formulas
Understanding Functions
Using regular expressions in functions
Using Pivot tables
The DataPilot dialog
This document provides an introduction to Microsoft Access, covering how to start Access, open and work with databases and their objects like tables and queries. It describes database concepts like records and fields, and how to navigate, edit, and format datasheets. The summary reviews how to open, edit, delete and select data in a table, as well as change layouts, print, and close databases in Access.
This document provides instructions for creating and working with databases in Microsoft Access. It explains that Access allows users to create, access, and manage databases on a computer. It then discusses how to start Access, create a new database using templates, and open existing database files. The document also covers how to create tables in Access using the datasheet and design views, and describes different data types and how to set field properties.
The document provides instructions for a database project involving creating tables, forms, queries, and reports in Microsoft Access. Students are asked to create tables to store supplier and product data, with a one-to-many relationship between them. Forms and queries are then developed to enter and extract data from these tables. Finally, a report is generated to outline products and suppliers sorted by state. The tasks guide students through the process of designing a basic relational database in Access.
For more course tutorials visit
www.newtonhelp.com
Excel Project 1 – MS Excel
Use the project description HERE to complete this activity. For a review of the complete rubric used in grading this exercise, click on the Assignments tab, then on the title "Excel Project 1." Click on Show Rubrics if the rubric is not already displayed.
This document provides an overview of creating and working with tables in Microsoft Access. It describes how to design a table by adding fields and setting their properties. Key points covered include data types, primary keys, field properties like format, validation and required fields. Navigation and editing features for working with table data are also summarized.
Tutorial for using SQL in Microsoft Accessmcclellm
SQL is a programming language used to manage data in relational databases. It allows users to insert, query, update and delete data from database tables. Microsoft Access is a common program that uses SQL to interact with its data tables, allowing users to run queries to retrieve certain records based on conditions. The document provides examples of SQL statements like SELECT, UPDATE, DELETE used in Microsoft Access and videos demonstrating how to execute them to select, modify and remove data from Access tables.
This document provides an overview of key concepts for the MS Access ECDL module, including tables, fields, primary keys, relationships, queries, forms, and reports. It explains how to create tables with fields, set primary keys, and establish relationships between tables. Queries, forms, and reports are also introduced. The document aims to prepare the reader for the tasks and knowledge required for the ECDL Access certification.
Here are the steps to create a blank Access database:
1. Click the Blank Database template under New in the starting window.
2. In the File New Database dialog box, type a name for the database (e.g. "MyDatabase") and select a save location.
3. Click Create.
This will create a new blank Access database with the specified name and save it in the selected location.
This document provides instructions for using an Excel dashboard to extract and visualize NPDES monitoring data submitted to the state of Wisconsin. The dashboard allows users to select a facility, start date, and initiate an Oracle query to retrieve the corresponding data set. A pivot chart is then refreshed to display trends in the data graphically. The pivot chart can be filtered and manipulated using Excel tools to explore relationships between parameters like BOD, TSS, flow rate, and phosphorus over time. The dashboard is intended to improve upon the existing data analysis program by providing enhanced data visualization capabilities.
Calc is the spreadsheet component of LibreOffice. You can enter data (usually numerical) in a spreadsheet and then manipulate this data to produce certain results.
Alternatively, you can enter data and then use Calc in a ‘What if...’ manner by changing some of the data and observing the results without having to retype the entire spreadsheet or sheet. Other features provided by Calc include:
What is Calc?
Starting a new Spreadsheet.
Saving Spreadsheets.
Entering data.
Editing data.
This document provides an overview of how to use Microsoft Access, a relational database management system. It discusses how Access allows for organized storage of data across multiple linked tables. It then outlines the basic steps for creating tables and entering data in Access, including defining fields, setting primary keys, and entering records. It also explains how to sort and search records, create relationships between tables, and design queries to extract specific data from the database. The document serves as a beginner's guide to getting started with the core functionality of Access.
1. Microsoft Access allows users to create and work with databases, tables, forms, queries, and reports. It provides tools for starting and exiting the program, creating and opening databases, and designing and manipulating tables, forms, queries, and reports.
2. Key features include creating and customizing tables with fields and records, entering and editing data, generating forms and reports from tables, and building queries to extract and calculate specific data.
3. Microsoft Access gives users flexibility in how they view and interact with different database components, allowing switching between design and data entry views, customizing properties and layouts, and printing finished reports.
The document describes two options for adding point data from a different coordinate system into a Civil 3D drawing:
Option 1 imports the points as a point cloud, which references rather than imports the points to keep file sizes smaller. It transforms both the coordinates and elevations.
Option 2 imports the points directly by first creating a new point file format that defines the source coordinate system. This transforms just the coordinates, not elevations, but adds the points directly to the drawing.
Both options have advantages and disadvantages regarding file size and what data is transformed. The best option depends on the specific data and needs of the project.
This document provides an overview of Microsoft Access and database concepts. It includes sections on getting started with Access, navigating the environment, database terms like tables, queries, forms and reports, and how to create and manage a database including adding tables, fields, records, relationships and running queries. The document aims to introduce users to key Access features and the basics of setting up and working with an Access database.
This PowerPoint presentation covers the basics of Microsoft Access 2010, including how to identify good database design, create tables and define fields, change table structures, add queries, forms, and reports, and save and close databases. It also discusses how to create databases using templates, organize objects in the navigation pane, add new tables to template databases, and print reports and tables. The overall objectives are to understand fundamental Access concepts and tasks.
Private placements programs.everything you wanted to know.2015 ilovepdf-compr...VICENTE PIQUERAS
This document discusses private placement programs (PPPs) and high yield investment programs. It provides information on understanding trading platforms that utilize qualified traders to purchase and sell investment-grade bank debentures. The document outlines the procedures to enter a PPP, including a personalized analysis, submitting required documentation like ID and proof of funds, conducting due diligence on assets, and options for blocking assets like using SWIFT messages or an administrative hold. It notes that once inquiries are completed, a program manager will contact the client within 48-72 hours.
This document explains private placement programs (PPOPs), also known as private placement opportunities or investment programs. PPOPs involve trading discounted debt instruments issued by banks in private markets. They exist to create money through debt and leverage large sums of money. Unlike normal trading markets, PPOPs operate through private contractual agreements between banks, traders, and exit buyers rather than open bidding. While they can generate profits, there are also significant risks of fraud due to lack of regulation and transparency.
The document discusses analyzing financial statements and ratios for a company and its competitor from 2008-2014. It includes an outline of financial statements, ratios, bonds and cash conversion cycle to be analyzed. It poses several questions about changes in key financial metrics over time and trends in ratios for the company, competitor and industry. Graphs are to be shown comparing changes in the three most significant ratios over 2008-2014 and a chart comparing all ratios in 2008 and 2014 for the company and competitor.
Fay Goulding summarizes her experience with various theatre production roles at Sheffield University from 2013 to present. She describes participating in over 60 hours of work with the university's theatre companies, including serving as a lighting designer, sound designer, and projection designer for multiple plays. She highlights gaining experience applying her creativity within the constraints and visions of directors. Goulding also summarizes a 12-hour online course taken from February to March 2015 about writing job applications and interviews, and managing her time amidst other commitments to complete the course. Finally, she summarizes her role as the chairperson of the School of English Student-Staff Committee from 2013-2014, including organizing an event and communicating with peers.
McDonald's is analyzing strategies to address declining US market share and product life cycle challenges. Two alternative strategies are expanding into the large and growing Asian markets of China and India, or offering healthier menu options. Quantitative analysis using the EFE, IFE, QSPM, and other matrices indicates expanding into Asia, specifically China and India, has the highest potential for long-term success due to factors like global brand recognition, cultural diversity, and large market growth opportunities. The recommended strategy is to continue franchise expansion in Asia while allowing some menu customization for local tastes.
E book.(english).how to invest in private placement programs-pppVICENTE PIQUERAS
This document provides information about investing in private placement programs and high yield investment programs. It discusses the procedures involved, including performing a personalized analysis and assessment of each client, submitting documentation, conducting due diligence, contacting a program manager, signing an execution agreement, working with a trading firm, expected yields, different investment models, buying and selling medium-term notes, selling medium-term notes, required partners and documentation, fraud detection, and contact information. The document is an index and guide for investors interested in these types of investment opportunities.
This thesis examines the health impacts of urban water supply on vulnerable communities in selected areas of Dhaka City, Bangladesh. It involves a field survey of households to collect data on water sources, sanitation access, hygiene practices and reported health issues. Water samples are collected and tested for quality. Meteorological data and health records on diarrhea are also analyzed. The study aims to identify relationships between water/sanitation access and health outcomes, and to estimate the economic costs of water-related diseases. Key findings will be used to evaluate current conditions and inform recommendations for improving access and health in vulnerable communities.
McDonald's market share in the US has been declining as the fast food industry grows slowly. To address this, McDonald's is considering two strategies: expanding into the growing Asian markets of China and India, or focusing on offering healthier menu options. A quantitative strategic planning matrix analysis determined that expanding into Asia, particularly China and India, would be the better long-term strategy due to the high potential for market growth in those countries.
Thyriod gland anatomy physiology and pathologysoolaawi
The thyroid gland is located in the neck below the larynx. It produces thyroid hormones like thyroxine (T4) and triiodothyronine (T3) which regulate metabolism. The thyroid is made up of follicles that contain colloid filled with thyroglobulin, which stores iodine and is used to produce the hormones. Hyperthyroidism occurs when there is too much thyroid hormone production, while hypothyroidism is a deficiency. Common conditions include Graves' disease and Hashimoto's thyroiditis.
The document discusses Just-in-Time (JIT) production. It defines JIT as a system that produces or acquires materials only as needed to minimize waste and costs. JIT was developed by Toyota and aims to eliminate overproduction and waste. The document outlines the purposes, objectives, advantages, disadvantages and characteristics of JIT manufacturing and services.
The document provides instructions for creating a census map by downloading census data from the US Census website, organizing it into a database file that can be joined to a census tract boundary shapefile, and defining the projection in order to map median household income by census tract. Key steps include selecting census variables of interest, converting the downloaded Excel file to a DBF format, downloading and defining the projection of a census tract boundary shapefile, and using a common identifier to join the census data to the tract boundaries.
Manual on GPS usage in Forest Management UnitsENPI FLEG
The document provides instructions for using the USGS Earth Explorer tool to search for and download Landsat satellite imagery. It describes how to register an account, search for images by location and date, apply additional filters, view search results, and download or order selected images. The steps include selecting the Landsat data set, setting search criteria like location, date range, and cloud cover, viewing thumbnail results on a map, selecting images, and downloading or ordering files for registered users.
1. The document describes the process for inputting data and calculating drought indices using the DMAP V2.0 tool. It involves importing data via Excel files or NetCDF files, selecting stations and variables, then calculating drought indices like SPI, PDSI, and KBDI.
2. The tool allows importing time series data for rainfall, temperature, soil moisture, and other variables to compute multiple drought indices. Data can be imported from Excel or NetCDF files by selecting stations, variables, and specifying formatting.
3. After inputting data, drought indices are calculated and can be visualized in plots. Severity thresholds can be customized, and drought start dates, durations, and magnitudes are outputted in a
Here are the steps to modify the Order table:
1. Open the Order table in Design view.
2. Select the PlacedBy field and press Delete.
3. Select the BillingDate field and drag it to the end of the table.
4. Click in the field list between CustomerNum and InvoiceAmt.
5. Select Yes/No from the data type dropdown and set the default value to No. Click OK.
6. Enter the new field name as Paid.
7. Add any test records in Datasheet view.
The document describes a project to design and implement a relational spatial database of university applicant data across the UK. It includes:
1) The initial data provided and database design process including entity relationship modeling and normalization.
2) The implementation of the geodatabase in 5 stages: table creation, data import, attribute domains/subtypes, relationship definitions, and topology rules.
3) Examples of 6 spatial and non-spatial queries run on the geodatabase to analyze applicant demographics.
Hw8Excel - Exercise 8 Mail Merge-2.docINFS 3250In Class Pro.docxadampcarr67227
This document provides instructions for an assignment involving mail merge and Excel macros. It includes 4 parts: 1) Creating a mail merge letter and recipient list, 2) Writing a macro to grade a quiz, 3) Writing a user-defined function to calculate profit, and 4) Writing macros to simulate a basic calculator. Students are instructed to complete the tasks, test their work, and submit the required Excel files. Formatting, buttons, and testing of the macros are also described.
This tutorial provides instructions for creating a fluid volume and mesh around a NACA 4314 airfoil and analyzing the flow in FLUENT. It describes how to generate data points defining the airfoil geometry, import these into DesignModeler to create the airfoil solid body, then use DesignModeler operations to subtract the airfoil from a larger fluid volume and slice the remaining volume. Instructions are given to label faces, insert edge sizing controls, and generate a mesh in Meshing before launching FLUENT for analysis.
This document provides an introduction to using Eikon Excel. It describes how to retrieve real-time data and generate basic tables using the <=RIC> and <=DI> functions. It also explains how to build custom formulas using the formula builder, screen for stocks, plot charts, and translate between ISIN and RIC codes. The key functions of Eikon Excel allow users to access real-time market data, build financial models and analyses, and generate reports directly in Microsoft Excel.
The document provides instructions for creating forms in Geopaparazzi using the HortonMachine application. It describes how to:
1. Create sections, tabs, and widgets like text fields, checkboxes, and dropdowns within the form builder application to design a custom survey form for university buildings.
2. Add fields for general information like name, faculty, and number of enrolled students.
3. Add additional tabs for structural details and images.
4. Populate dropdowns by specifying options in the form builder.
5. Designate certain fields like name as mandatory for the survey.
The form can then be exported and used to collect geospatial data on university buildings using the
The document provides instructions for running the DMAP software to analyze drought indices. It describes:
1. How to open an input Excel file, select the sheet, and assign variables such as date, temperature, and precipitation.
2. How to select drought indices like SPI on the "Drought Indices" tab, choose calculation frequency and time period, generate index values, export results to Excel, and plot the output.
3. How to calculate the severity and duration of drought events by setting index borders on the "Severity" panel and viewing the results table.
For more classes visit
www.snaptutorial.com
Excel Project 1 – MS Excel
Use the project description HERE to complete this activity. For a review of the complete rubric used in grading this exercise, click on the Assignments tab, then on the title "Excel Project 1." Click on Show Rubrics if the rubric is not already displayed.
This document provides an excerpt from the book "Microsoft Office Excel 2003 Programming Inside Out" which discusses how to create advanced user forms in Excel VBA. It describes building a user form to capture customer information from a worksheet. The form allows the user to enter or edit data, which is validated and stored in the worksheet. It also shows how to navigate between records using buttons and dynamically determine the last row of data. The form keeps track of changes separately until the user saves or cancels them.
IFSM 201 Possible Is Everything/newtonhelp.comlechenau70
For more course tutorials visit
www.newtonhelp.com
Excel Project 1 – MS Excel
Use the project description HERE to complete this activity. For a review of the complete rubric used in grading this exercise, click on the Assignments tab, then on the title "Excel Project 1." Click on Show Rubrics if the rubric is not already displayed.
For more classes visit
www.snaptutorial.com
Excel Project 1 – MS Excel
Use the project description HERE to complete this activity. For a review of the complete rubric used in grading this exercise, click on the Assignments tab, then on the title "Excel Project 1." Click on Show Rubrics if the rubric is not already displayed.
This document provides an overview of creating and managing database objects in Microsoft Access. It discusses:
1) The basic database objects like tables, queries, forms and reports and how they are used to store and display data.
2) How to create tables, set primary keys, add and modify fields, and create relationships between tables.
3) How to create other database objects like queries, forms and reports and customize their layout and formatting.
Microsoft Access is a powerful database program that allows users to create and manage databases. It has built-in features to help construct and view information through tables, queries, forms, and reports. Access breaks down databases into a hierarchy including the database file, tables, records, fields, and data types. Users can create databases from scratch or with a wizard, then enter and manipulate data by adding, updating, and deleting records in tables or forms. Relationships between tables can also be created by matching primary and foreign keys to bring information together across multiple tables.
The document discusses how to add new fields to forms in the Form Designer tool. It explains that new fields can be created if existing fields in the database do not meet needs. It provides details on selecting existing fields from a dropdown list, and on creating different types of new fields like text, numeric, date, and logical fields. It indicates that new fields can be customized and up to 254 fields can be added to each database.
This tutorial provides instructions for using the StatPlanet software to create interactive maps and visualizations. It discusses downloading and installing StatPlanet, importing shapefiles and data to create maps, different map types (choropleth, proportional symbol), customizing map features and options, and troubleshooting. The document aims to enable non-technical users to explore and communicate data through interactive maps and visualizations using StatPlanet.
For more course tutorials visit
www.newtonhelp.com
Excel Project 1 – MS Excel
Use the project description HERE to complete this activity. For a review of the complete rubric used in grading this exercise, click on the Assignments tab, then on the title "Excel Project 1." Click on Show Rubrics if the rubric is not already displayed.
Similar to Readme-GPS Data Conversion for GIS Unit (20)
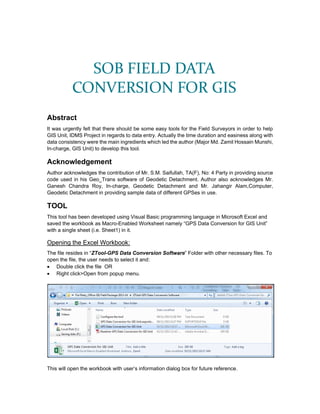
1. Abstract
It was urgently felt that there should be some easy tools for the Field Surveyors in order to help
GIS Unit, IDMS Project in regards to data entry. Actually the time duration and easiness along with
data consistency were the main ingredients which led the author (Major Md. Zamil Hossain Munshi,
In-charge, GIS Unit) to develop this tool.
Acknowledgement
Author acknowledges the contribution of Mr. S.M. Saifullah, TA(F), No: 4 Party in providing source
code used in his Geo_Trans software of Geodetic Detachment. Author also acknowledges Mr.
Ganesh Chandra Roy, In-charge, Geodetic Detachment and Mr. Jahangir Alam,Computer,
Geodetic Detachment in providing sample data of different GPSes in use.
TOOL
This tool has been developed using Visual Basic programming language in Microsoft Excel and
saved the workbook as Macro-Enabled Worksheet namely “GPS Data Conversion for GIS Unit”
with a single sheet (i.e. Sheet1) in it.
Opening the Excel Workbook:
The file resides in “ZTool-GPS Data Conversion Software” Folder with other necessary files. To
open the file, the user needs to select it and:
Double click the file OR
Right click>Open from popup menu.
This will open the workbook with user’s information dialog box for future reference.
SOB FIELD DATA
CONVERSION FOR GIS
2. Pressing “OK” will show “Sheet Name” dialog box in order to insert the six digit sheet name
with part name e.g. 78P05A_North by the user:
Pressing “OK” will be replacing “Sheet1” with 78P05A_NORTH:
If wrong name or blank space is left; it will remind the operator to name sheet with six digit
(e.g. 78P05A).
However, if user forgets or ignores the naming of the sheet; he has to name it afterwards by
selecting Sheet1>Right Click>Rename. It must be remembered that in coarse of time, this particular
naming convention will help the tool to generate an excel workbook with same map sheet name
(78P05A.xls) having number of worksheets along with part name (e.g. 78P05A_NORTH,
78P05A_SOUTH etc.) as explained in Make Data for GIS of “Monitor Task” section .
3. Configuring the Tool:
Initially an error will be shown describing the non-availability of toolbar/macro. To configure the
tool as different menu, following methods to be adhered:
Right Click>Customize the Ribbon… OR
File>Options>Excel Options opens> Customize Ribbon
Choose commands from>Macros
Select “Main Tabs” from Customize the Ribbon options.
Press Import/Export>Import customization file will open “File Open” dialog box.
Browse to “ZTool-GPS Data Conversion Software” Folder and select “GPS Data Conversion
for GIS Unit.exportedUI” .This will show the following dialog box.
4. Press Yes.
A new and separate tab as “SOB FIELD DATA (Custom)” in the main Menu will be created
along with other menus as seen here.
Select “GPS Data Conversion (Custom)” group name and expand it by clicking [+].
This will open subgroup items like Explorist 400/500, Garmin eTrex Legend/HCX/10.
o Select subgroup (e.g. Explorist 400/500)>Right Click>Rename OR Select
subgroup>Press Rename… button at the bottom.
o Copy the name [Note: This is done to use the same name for each subgroup items as
mentioned later]
o Cancel the “Rename” dialogbox.
o Press “Remove” will remove Explorist 400/500 from the “GPS Data Conversion
(Custom)” group name.
o Select “Explorist_Click” from Macros and press “Add”. This will again add the
Explorist_Click in the subgroup name with default symbol image as seen here.
Tab Name
Group Name
Subgroup Name
5. o Right Click on subgroup (here Explorist_Click )>Rename
o Replace “Explorist_Click “ by pasting “Explorist 400/500” in the Display name box or
rewrite the same.
o Choose the image and press “OK”
Continue for each group and its associated subgroup using macros. The final look from initial
setup will be:
Dismiss the dialog box “Excel Options” by pressing “OK”. A new tab with following images will
be created as seen below:
6. SOB FIELD DATA Tab
Tab Description:
It comprises following groups/sections:
GPS Data Conversion.
Code Generation.
Quality Checks.
Monitor Task.
Help.
Data Description:
To use the buttons of those groups, the operator has to copy the GPS downloaded data from the
respective excel file which has been generated directly from GPS while downloading the data or
while using download software of respective GPS. The data then should be pasted in “A1” cell of
“GPS Data Conversion for GIS Unit” excel file. The sample data from both Explorist 400/500 and
Garmin eTrex Legend/HCX/10 could be seen here in Figure:1 and Figure:2 respectively:
Figure: 1 Downloaded Data from Epxlorist 400/500
Figure: 2 Downloaded Data from Garmin eTrex Legend/HCX/10
GPS Data Conversion:
Operator has to press either of the buttons of this group in order to convert Latitude and Longitude
data of WGS84 system to Northing and Easting of BUTM2010 system:
Explorist 400/500: Press this button while using data of Explorist GPS.
Garmin eTrex Legend/HCX/10: Press this button while using data of Garmin GPS.
Output: GIS Field Attribute Collection Form (Figure:3) will be created and all the latitudes and
longitudes in degree minute decimal of Explorist 400/500 or degree minute second decimal of
eTrex Legend/HCX/10 of WGS84 will be converted to Easting and Northing in meter of
BUTM2010 instantly. There will be four elements namely Record Code, Serial No, Easting and
Northing filled with GPS data. On the other hand operator has to fill F_Name and Remarks (if
any) column of Field Attribute Form.
Figure: 3 GIS Field Attribute Collection Form with Converted Data
7. Action Needed: Surveyors/Camp Officer to arrange the filling of F_Name and Remarks from
prepared hardcopy.
Code Generation:
After filling up F_Name and Remarks, pressing “Feature Code” will generate F_Type and F_Code
instantly as seen in the Figure:4 below:
Figure: 4 Filled Up GIS Field Attribute Collection Form with Necessary Data
Quality Checks:
This section deals with necessary quality checks on the filled up form of Figure: 5. The checks are
shown below:
Inconsistent Plotting: This will identify the data falling outside the neat line of a particular
map sheet of 1:25000 scale. The point which will fall out of the neat line, its “Easting” or/and
“Northing” will be colored to red basing on the data. Surveyor should check its GPS data
properly. This may be due to bad reading taken during field survey or GPS might have
malfunctioned during data taking or even surveyor makes error during manual data entry. This
tool has got approximate accuracy up to ±2 cm on the ground.
This tool must not be pressed till F_Code and Type has been generated.
Figure: 5 Result of Inconsistent Plotting Check
Blank Data: Pressing this will identify the data which lacks in “F_Name” i.e. no feature name
has been collected. Collecting specific information is one of the main reasons for field survey.
Hence feature name must not be forgotten to collect. . It should be remembered that F_Type
i.e. feature type has connection with “F_Name”. Feature name (e.g. Biral Jhuri Government
Primary School) and feature type (e.g. Primary School) are not same. While the former is more
specific in nature, the later shows the generic type of feature. To make it more clear, there may
be 10 to 20 primary schools in a particular sheet but more than one primary school with same
name are rarely observed. However where "F_Name" is not available,"Feature_Type" should
be written instead, because this field MUST NOT be left vacant.
Figure: 6 Result of Blank Data Check
Missing Data: Pressing this will identify the data which lacks in “Record Code”. Fill "Record
Code" column of the form with the given1 to239 entries in the "GIS FIELD ATTRIBUTE TABLE-
1:25,000". Firstly, the Surveyor needs to look for "FeatureType" in the Attribute Table and write
down its associated "Record Code" in this form. ANY MISTAKE WILL LEAD TO CHANGE OF
8. FEATURE CLASS. "Serial No" must not be prefixed by any text (e.g.Write1instead of F-01 or
S-1 etc.).
Figure: 7 Result of Missing Data Check
Wrong F_Code: Pressing this will identify the data where F_Type does not match with
F_Name . It often happens when Surveyor forgets to write exact F_Code. These will be in
different fill color to show emphasis of use of F_Code.
Figure: 8 Result of Wrong F_Code Check
Show All Data: Pressing will show all the data those were already filtered by the above checks.
This should be done after correcting all the data and to have a final visual check on the full
data.
Monitor Task:
It helps operator to monitor his/her task smoothly.
Show Task Tracker: Pressing will open a new sheet with various personal data entry
information. Opening other sheet will deactivate or hide it.
Figure: 9 Show Task Tracker
Make Data for GIS: Pressing this will pick relevant information as recorded and paste it in the
different file with same Map Sheet name.
Figure: 10 Make Data for GIS
9. This file resides on the Drive where this “GPS Data Conversion for GIS Unit” excel file resides in
a folder namely “FieldData-For GIS”.
Figure: 11 Location of GPS Data for GIS Unit
Help:
Record Code: Pressing for the first time will show the “Record Code” reference with respect to
“F_Code” and “F_Type” for operator to correct their entered data. Pressing second time will
hide the reference.
Figure: 12 Show F_Code Help
Read Me: Pressing this will open the “Readme-GPS Data Conversion for GIS Unit” file.
GENERAL ADVICES
Camp Officer/Surveyor/Operator/User should study this prior to use the tool carefully.
Configure the tool properly before using it.
Major Md. Zamil Hossain Munshi
Deputy Director (Survey)
Officer In-charge
No: 1 Cartography Office & GIS Unit
05 November 2013
SPECIAL NOTE
This software may not run without configuration of each tool residing in the tab “SOB FIELD DATA”
even after coping and pasting this file to any Computers. Please configure your computer with the
help of configuration process as explained in Configuring the Tool or by above signed developer
prior to use it properly.