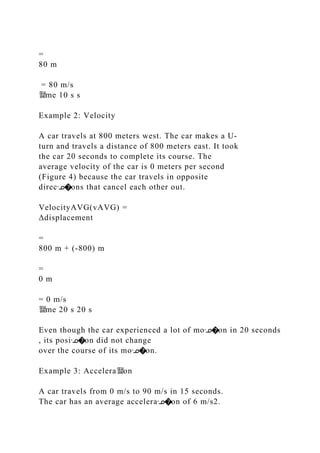
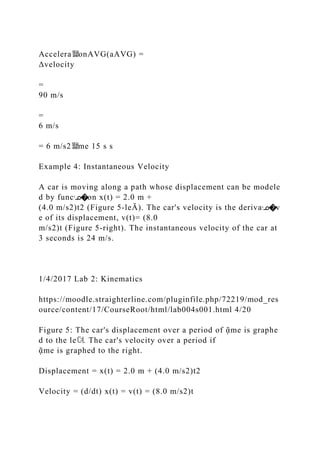
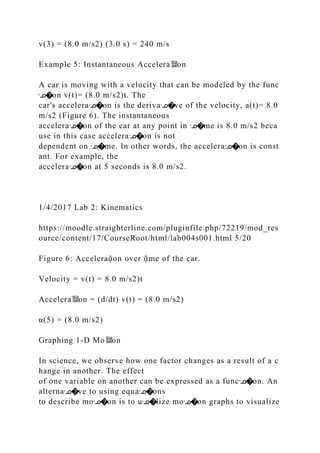
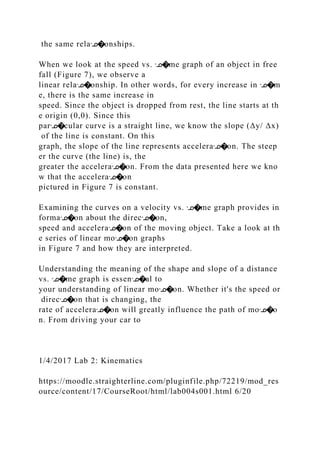
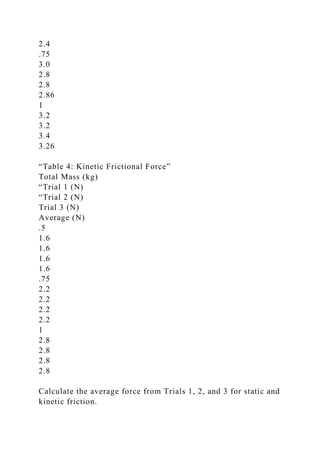
Lab 2/Lab 2- Kinematics.pdf
1/4/2017 Lab 2: Kinematics
https://moodle.straighterline.com/pluginfile.php/72219/mod_resource/content/17/CourseRoot/html/lab004s001.html 1/20
Learning Objec뙕ves
Disᣊ�nguish between scalar and vector quanᣊ�ᣊ�es
Apply kinemaᣊ�c equaᣊ�ons to 1‐D and projecᣊ�le moᣊ�on
Predict posiᣊ�on, velocity, and acceleraᣊ�on vs. ᣊ�me graphs
Calculate average and instantaneous velocity or acceleraᣊ�on
Determine that x and y components are independent of each other
Relate velocity, radius, and ᣊ�me period to uniform circular moᣊ�on.
Explain the direcᣊ�on of acceleraᣊ�on during uniform circular moᣊ�on
1‐D Kinema뙕cs
1‐D kinemaᣊ�cs occurs when an object travels in
one dimension and can be described using words,
equaᣊ�ons and graphs. Linear mo뙕on describes
how an object will move horizontally or verᣊ�cally
with constant acceleraᣊ�on, how an object will
1/4/2017 Lab 2: Kinematics
https://moodle.straighterline.com/pluginfile.php/72219/mod_resource/content/17/CourseRoot/html/lab004s001.html 2/20
Figure 1: Pool balls in moᾷon demonstrate
1‐D kinemaᾷcs.
Figure 2: Line secant to the path of the
object.
travel if dropped from the side of a cliff, and the
path it will follow if thrown straight up into the air.
Keep in mind the moᣊ�on of an object is relaᣊ�ve to
the viewer. Even though you do not feel like you
are in moᣊ�on right now, you are on planet earth
that has rotaᣊ�onal moᣊ�on in addiᣊ�on to orbital
moᣊ�on around the sun. In almost all cases here
moᣊ�on will be relaᣊ�ve to the Earth.
Scalar and Vector Quan뙕뙕es
In physics, quanᣊ�ᣊ�es can be scalar or vector. The
difference between the two lies in direcᣊ�on.
Scalar quanᣊ�ᣊ�es include magnitudes, which are numerical measurements. The distance an
object has traveled or the speed of an object is a scalar quanᣊ�ty. Scalars do not take direcᣊ�on
into consideraᣊ�on and can be described with only a number and a unit. For example,
somebody might say the temperature outside is 70°F. Seventy is the magnitude, and
Fahrenheit is the unit; there is no direcᣊ�on associated with the quanᣊ�ty. Vector quanᣊ�ᣊ�es, on
the other hand, include magnitude and direcᣊ�on. The displacement from an object's iniᣊ�al
posiᣊ�on, velocity, and acceleraᣊ�on are vector quanᣊ�ᣊ�es. The direcᣊ�on of vectors can be
described as being in the posiᣊ�ve direcᣊ�on, in the negaᣊ�ve direcᣊ�on, north, south, east, west,
leĀ, right, up, down, etc. One might describe an airplane's velocity as 450 miles per hour due
west where both magnitude and direcᣊ�on are given. It is important to disᣊ�nguish between
scalar and vector quanᣊ�ᣊ�es when trying to understand kinemaᣊ�cs.
Speed, Velocity, and Accelera뙕on
You may be familiar with speed outside of the physics classroom. When you drive in a car you
are traveling a distance over a certain amount of ᣊ�me: a speed. How then is velocity different
from speed? Velocity (v) is a vector quanᣊ�ty described as the rate at which an object's
posiᣊ�on changes divided by the ᣊ�me the ...
The document discusses motion, including:
1. Defining displacement and distance travelled.
2. Calculating speed using the equation speed = distance/time.
3. Distinguishing between speed and velocity, with velocity having both magnitude and direction.
Distance is a scalar quantity that refers to how far an object has traveled, while displacement is a vector quantity referring to the shortest distance between initial and final positions. Speed is the distance traveled per unit time, while velocity is a vector quantity referring to the rate of change of an object's position and includes direction. Acceleration refers to the rate of change of an object's velocity. It can be calculated using the change in velocity over the change in time.
- Displacement is the change in position of an object over time and is a vector quantity. It indicates both the distance and direction moved.
- Speed is the distance traveled per unit time and is a scalar quantity. It does not indicate direction.
- Velocity is speed with direction and is therefore a vector quantity. It indicates both how fast an object is moving as well as the direction of motion.
- Acceleration is the rate of change of velocity with time. It measures how velocity is changing and can therefore be positive, negative, or zero. Acceleration is a vector quantity.
The document provides learning objectives and concepts related to kinematics including displacement, speed, velocity, acceleration, and equations of motion. The key points are:
1. It defines important kinematics terms like displacement, speed, velocity, acceleration and describes how to represent motion using words, diagrams, graphs and equations.
2. Graphs of distance-time and velocity-time are introduced and it is explained that their slopes provide speed and acceleration respectively.
3. Equations of motion that apply to objects with constant acceleration in a straight line are given along with examples of how to use them to solve problems.
4. Free fall and projectile motion are described and representations using velocity-time graphs are shown
This document provides an overview of key concepts in kinematics including:
1) Kinematics deals with concepts of motion without considering forces, while dynamics considers the effects of forces on motion.
2) Displacement, speed, velocity, acceleration, and equations of motion for constant acceleration are introduced.
3) Applications include analyzing the motion of falling bodies and interpreting position-time and velocity-time graphs.
This document provides an overview of physics concepts related to motion and vectors, including:
1) Definitions of key terms like velocity, acceleration, displacement, distance, scalars and vectors. Equations for calculating average and instantaneous velocity and acceleration are presented.
2) Discussion of frames of reference, different types of motion problems (free fall, projectile motion, etc.), and how to apply kinematic equations for constant acceleration.
3) Explanations of vector concepts like addition of vectors graphically and using trigonometry, projectile motion, and perpendicular independence of horizontal and vertical components of motion.
The document discusses kinematics concepts including distance, displacement, speed, velocity, and acceleration. It defines distance as the total length of a path traveled and displacement as the straight-line distance between initial and final positions. Speed is the distance traveled per unit time and is a scalar quantity, while velocity is displacement per unit time and has both magnitude and direction. Acceleration is the rate of change of velocity with respect to time and occurs when a force acts on an object. Formulas for average and instantaneous velocity and acceleration are presented for motion with constant acceleration. Examples apply these concepts to problems involving cars, runners, airplanes, and balls on inclines.
The document discusses various kinematic concepts related to mechanics including:
1. Displacement, speed, velocity, and acceleration are defined. Displacement is a vector quantity while distance is a scalar.
2. Graphs of position, velocity, and acceleration over time can be used to represent motion. The area under a velocity-time graph relates to displacement.
3. Equations for constant acceleration motion relate variables like displacement, initial/final velocities, time, and acceleration. Motion under gravity on Earth is an example of constant acceleration.
This document provides an overview of kinematics, the study of motion without considering causes. It defines fundamental kinematic concepts like position, displacement, velocity, acceleration and describes how to analyze motion using equations and graphs. Key topics covered include constant acceleration, free fall near Earth's surface, and graphical analysis of motion. The document is intended to help students understand and study the concepts of kinematics.
This document defines key concepts in kinematics including reference frames, average and instantaneous speed and velocity, acceleration, equations of motion, scalar and vector quantities, vector addition and subtraction, and product of vectors. It also discusses projectile motion, motion under gravity, and conditions for equilibrium. Key concepts covered include inertial frames, definitions of average speed, velocity, and acceleration, equations of motion with constant acceleration, vector addition and subtraction using triangle and parallelogram laws, dot and cross products of vectors, and projectile motion equations.
This document discusses key concepts in kinematics including:
- Kinematics is the study of motion without considering causes. It focuses on rectilinear or straight-line motion.
- Displacement is a vector quantity that describes the shortest distance between initial and final positions, while distance is a scalar quantity describing the actual path traveled.
- Uniform motion occurs when equal displacements happen in equal time intervals, resulting in a straight line on a position-time graph. Non-uniform motion has acceleration.
1. The document discusses various concepts related to one-dimensional motion including position, distance, displacement, speed, velocity, and acceleration.
2. It defines key terms like displacement as the change in position of an object, velocity as a vector quantity that includes both speed and direction, and acceleration as the rate of change of velocity with respect to time.
3. Examples and equations are provided to calculate quantities like average speed, average velocity, and instantaneous velocity from distance-time graphs or data tables.
This document discusses the difference between scalar and vector quantities in mechanics. It defines a scalar quantity as one that can be described by magnitude alone, such as mass, length, and time. A vector quantity requires both magnitude and direction to be fully described, such as velocity. Speed is defined as the rate of change of distance over time and is a scalar, while velocity is the rate of change of displacement over time and is a vector, as it includes both magnitude and direction. Examples are provided of speed, such as Usain Bolt's running speed, and velocity, such as a cricket ball being hit at an angle.
This document summarizes key concepts about acceleration, velocity, and motion graphs. It defines acceleration as the rate of change of velocity and describes how to calculate average acceleration using motion diagrams. Positive and negative acceleration are explained using examples. Velocity-time graphs are introduced and it is noted that slope represents acceleration and area under the curve indicates displacement. Equations for motion with constant acceleration are derived, including relationships between position, velocity, acceleration, and time. Finally, free fall under the influence of gravity is discussed, noting Galileo's findings, the definition of gravitational acceleration g, and how velocity and position change over time in free fall situations.
A New Method For Solving Kinematics Model Of An RA-02IJERA Editor
The kinematics miniature are established for a 4 DOF robotic arm. Denavit-Hartenberg (DH) convention and the
product of exponential formula are used for solving kinematic problem based on screw theory. For acquiring
simple matrix for inverse kinematics a new simple method is derived by solving problems like robot base
movement, actuator restoration. Simulations are done by using MATlab programming for the kinematics
exemplary.
Important Helpful Physics Notes/Formula--Must Seeanicholls1234
The document discusses key physics concepts related to motion including:
- Speed is distance traveled over time. Velocity includes direction of motion.
- The slope of a distance-time graph represents speed. The area under a velocity-time graph represents distance traveled.
- Forces can cause objects at rest to accelerate or objects in motion to speed up, slow down, or change direction depending on whether the net force is zero or non-zero. Acceleration depends on the net force applied and the object's mass.
The document discusses acceleration and related concepts:
- Acceleration is the change in velocity per unit of time and is a vector quantity. It results from an applied force and is proportional to the force's magnitude.
- Velocity is speed in a given direction, while speed is the distance traveled per time and does not consider direction.
- Average acceleration is calculated as the change in velocity divided by the time interval. Instantaneous acceleration is the slope of the velocity-time graph at an instant.
- Examples demonstrate calculating average speed and acceleration from initial and final velocities and time intervals. Direction and signs of displacement, velocity, and acceleration must be considered carefully.
This document provides an introduction to kinematics, including definitions of key terms like speed, velocity, acceleration and their relationships. It discusses how to calculate average speed and uniform acceleration. Graphs are presented as useful tools, including distance-time and speed-time graphs. Motion under conditions like constant acceleration, non-uniform acceleration and free fall are also examined. Readers are assigned questions to assess their understanding of basic kinematics concepts covered.
1) Derivatives relate the rates of change of position, velocity, and acceleration. Velocity is the derivative of position and measures rate of change of displacement. Acceleration is the derivative of velocity and measures the rate of change of velocity.
2) The Mean Value Theorem states that for a continuous function over an interval, there exists at least one point where the slope of the tangent line equals the slope of the secant line between the endpoints.
3) A function's derivatives provide information about the behavior of the original function. The first derivative relates to slope and critical points where the function is increasing/decreasing. The second derivative indicates points of inflection where the concavity changes.
College Physics 1st Edition Etkina Solutions ManualHowardRichsa
This document contains a chapter from the textbook "College Physics" by Etkina, Gentile, and Van Heuvelen. It includes multiple choice and conceptual questions about kinematics concepts like displacement, velocity, acceleration. It also includes practice problems asking students to draw motion diagrams and choose reference frames. The key concepts covered are scalar and vector quantities, relationships between displacement, velocity and acceleration, and using graphs to represent motion.
This document provides an overview of differentiation and derivatives. It defines the derivative as the instantaneous rate of change of a quantity with respect to another. The process of finding derivatives is called differentiation. Isaac Newton and Gottfried Leibniz developed the fundamental theorem of calculus in the 17th century. Derivatives have many applications across various sciences such as physics, biology, economics, and chemistry. They are used to calculate velocity, acceleration, population growth rates, marginal costs/revenues, reaction rates, and more.
Christian Kasumo gave a presentation at the ZAME Annual Provincial Conference on teaching kinematics. He defined key kinematics concepts like displacement, velocity, acceleration, and discussed common student difficulties. He recommended teaching kinematics through real-world examples, group work, and activities using software like Geogebra to help students understand graphs and equations of motion. He concluded by thanking the organizers and Mulungushi University for their support.
Distance is how far an object travels from its starting point, while displacement includes direction of motion. Speed is how fast an object moves, while velocity includes both speed and direction. Acceleration is a change in velocity over time. Distance-time graphs show how distance changes with time, and can indicate if an object has constant or changing velocity. Velocity-time graphs show how velocity changes with time, and can show if an object has constant, increasing, or decreasing acceleration. Both graphs can be used to analyze an object's motion based on its regions.
This document discusses key concepts relating to motion, including distance, time, speed, and their relationships. It aims to help students understand and apply these concepts using spreadsheets and graphs. Specifically, it explains that distance, speed, and time are inversely proportional, and provides formulas to calculate these values given two of the variables. The document also demonstrates how to represent motion graphically using distance-time and speed-time graphs, and how to interpret features of these graphs like slope, acceleration, and deceleration. Students are instructed to apply these concepts by plotting graphs in Excel and completing an assignment on Edmodo by the due date.
This document contains notes from a physics class discussing kinematics graphs. It includes examples of how to interpret distance vs. time, velocity vs. time, and acceleration vs. time graphs. It also provides practice problems asking students to draw and analyze different graph types based on given motion information.
This document introduces key concepts of 1-D kinematics including:
1) Distance refers to the total path traveled while displacement refers to the change in position from initial to final point.
2) Kinematics describes motion without considering causes, and 1-D kinematics refers to motion in a straight line.
3) Graphs can distinguish between distance and displacement, with displacement being the straight line segment between initial and final points.
4) Key concepts such as average speed, average velocity, acceleration, and free fall are introduced along with relevant equations and demonstrations.
This document provides an introduction to 1-dimensional kinematics, including distance, displacement, average speed, average velocity, acceleration, and position-time and velocity-time graphs. It defines key terms like distance, displacement, speed, velocity, acceleration, and discusses the relationships between these quantities. Examples and practice problems are provided to illustrate concepts like the difference between distance and displacement, calculating average speed and velocity, determining acceleration from graphs, and using kinematic equations.
Physique et Chimie de la Terre Physics and Chemistry of the .docxLacieKlineeb
Physique et Chimie de la Terre / Physics and Chemistry of the Earth 2022 / 2023
Homework
Physics of the Earth
Deadline : 10th of november
The Herglotz-Wiechert method and
Earth’s mantle seismic velocities profiles
The goal of this problem is to build a model of the P and S wave velocity profiles in the Mantle,
from travel times tables build from observations. To do this, we will use the Herglotz-Wiechert method,
a method developed by Gustav Herglotz and Emil Wiechert at the beginning of the twentieth century.
We consider a seismic ray going from point S to point A, as depicted on figure 1. We denote by ∆
the angular distance of travel (i.e. the angle ŜCA), and by T (∆) the travel time of the seismic wave
as a function of angular distance. We recall that in spherical geometry the ray parameter is defined as
p = r sin i(r)
V (r) , (1)
and is constant along a given ray. Here r is the distance from the center of the Earth, i(r) is the
incidence angle (i.e. the angle between the ray and the vertical direction at a given r), and V (r) is the
wave velocity. We denote by R = 6371 km the radius of the Earth.
∆
d∆
R
p
p + dp
i
A
A’B
S
C
rb
Figure 1 – Two rays coming from the same source S with infinitesimally different ray parameters p and p + dp. Their
angular distances of travel are ∆ and ∆+ d∆, and their travel-times are T and T + dT . The line going through points A
and B is perpendicular to both rays.
1 Constant velocity model
Let us first assume that the wave velocity V does not vary with depth.
1. Draw on a figure the ray going from a source S to a point A of the surface, without any reflexion.
This ray could represent either the P or S phase.
2. Find the expression of the travel time T along this ray as a function of ∆.
3. Find the expression of the incidence angle i of the ray at point A as a function of the epicentral
distance ∆, and then show that the ray parameter is given by
p = R
V
cos
∆
2
. (2)
1/3
Physique et Chimie de la Terre / Physics and Chemistry of the Earth 2022 / 2023
2 Linking p to T and ∆
We now turn to a more realistic model and allow for radial variations of the waves velocities.
4. By considering two rays coming from the same source with infinitesimally different ray parameters
p and p + dp, and travel times T and T + dT (Figure 1a), demonstrate that
p = dT
d∆
. (3)
Hints : (1) Since the two rays are very close, the arcs connecting A to A’, A to B, and B to A’
can be approximated as straight lines. (2) Show first that the segment AB is part of a wavefront.
What does it imply for the times of arrivals at points A and B ?
5. Check that the expressions of p and T found for the constant velocity model are consistent with
eq. (3).
3 Travel time curves and estimate of the p(∆) curves
You will find on Chamillo a file containing travel time tables obtained from the global Earth’s seis-
mological model ak135 (either a text file, AK135tables.txt, or an Excel spreadsheet, AK135tables.xlsx).
The f.
PART B Please response to these two original posts below. Wh.docxsmile790243
PART B
Please response to these two original posts below. When
responding to these posts, please either expand the
thought, add additional insights, or respectfully disagree
and explain why. Remember that we are after reasons
and arguments, and not simply the statement of
opinions.
Original Post 1
Are human lives intrinsically valuable? If so, in virtue of what? (Is
it our uniqueness, perhaps, or our autonomy, or something else?)
To begin, I would like to remind us that being intrinsically valuable
means having values for just being us and nothing else. I believe
that human lives are intrinsically valuable in virtue of our
uniqueness. As a bio nerd, I would like to state the fact that there
are a lot of crossover events during meiosis, which create trillions
of different DNA combinations. Hence, from a biological
standpoint, without considering other aspects, being you is
already valuable because you are that one sperm that won the
race and got fertilized. On a larger scale, there are hardly two
people whose look and behaviors are the same in the same
family, unless they are identical twins. However, identical twins
still act differently and have differences (such as fingerprints).
Since we are raised in different families, we are taught different
things and have different cultures. In general, we all have
different genetic information, appearances, personalities, senses
of humor, ambitions, talents, interests and life experiences. These
characteristics make up our “unique individual value” and make
us so unique and irreplaceable.
I would also love to discuss how our diversities enrich and
contribute to society, but that would be a talk about our extrinsic
values.
Original Post 2
Are human lives intrinsically valuable? If so, in virtue of what? (Is
it our uniqueness, perhaps, or our autonomy, or something else?)
I believe that human lives are intrinsically valuable due to a
number of reasons. Firstly, human lives aren’t replaceable. You
can’t replace a human being with another just like you can
replace a broken laptop with brand new one. Part of the reason
why we tend to think this way is that we were nurtured with the
notion that there is, indeed, a special value to human life. This
could be in virtue of our uniqueness-- the fact that we are
sentient and capable of complex thoughts and emotions
separates us from any other species on this planet. From a
scientific standpoint, this is also one of the reasons as to why
humans became the dominant species in today’s age.
Moreover, human lives aren’t disposable. I think this is largely due
to us humans having the ability to empathize with others. We
understand that it’s morally inappropriate to take the life of
another individual even if they’re complete strangers because
they’re another human being like us who has their own thoughts,
values, memories, and stories. In a way, we have a strong
emotional connection to our own species. As .
Part C Developing Your Design SolutionThe Production Cycle.docxsmile790243
Part C Developing Your Design
Solution
The Production Cycle
Within the four stages of the design workflow there are two distinct parts.
The first three stages, as presented in Part B of this book, were described
as ‘The Hidden Thinking’ stages, as they are concerned with undertaking
the crucial behind-the-scenes preparatory work. You may have completed
them in terms of working through the book’s contents, but in visualisation
projects they will continue to command your attention, even if that is
reduced to a background concern.
You have now reached the second distinct part of the workflow which
involves developing your design solution. This stage follows a production
cycle, commencing with rationalising design ideas and moving through to
the development of a final solution.
The term cycle is appropriate to describe this stage as there are many loops
of iteration as you evolve rapidly between conceptual, practical and
technical thinking. The inevitability of this iterative cycle is, in large part,
again due to the nature of this pursuit being more about optimisation rather
than an expectation of achieving that elusive notion of perfection. Trade-
offs, compromises, and restrictions are omnipresent as you juggle ambition
and necessary pragmatism.
How you undertake this stage will differ considerably depending on the
nature of your task. The creation of a relatively simple, single chart to be
slotted into a report probably will not require the same rigour of a formal
production cycle that the development of a vast interactive visualisation to
be used by the public would demand. This is merely an outline of the most
you will need to do – you should edit, adapt and participate the steps to fit
with your context.
There are several discrete steps involved in this production cycle:
Conceiving ideas across the five layers of visualisation design.
Wireframing and storyboarding designs.
Developing prototypes or mock-up versions.
219
Testing.
Refining and completing.
Launching the solution.
Naturally, the specific approach for developing your design solution (from
prototyping through to launching) will vary hugely, depending particularly
on your skills and resources: it might be an Excel chart, or a Tableau
dashboard, an infographic created using Adobe Illustrator, or a web-based
interactive built with the D3.js library. As I have explained in the book’s
introduction, I’m not going to attempt to cover the myriad ways of
implementing a solution; that would be impossible to achieve as each task
and tool would require different instructions.
For the scope of this book, I am focusing on taking you through the first
two steps of this cycle – conceiving ideas and wireframing/storyboarding.
There are parallels here with the distinctions between architecture (design)
and engineering (execution) – I’m effectively chaperoning you through to
the conclusion of your design thinking.
To fulfil this, Part C presents a detailed breakdown of the many design
.
More Related Content
Similar to Lab 2Lab 2- Kinematics.pdf142017 Lab 2 Kinematicsh.docx
This document provides an overview of kinematics, the study of motion without considering causes. It defines fundamental kinematic concepts like position, displacement, velocity, acceleration and describes how to analyze motion using equations and graphs. Key topics covered include constant acceleration, free fall near Earth's surface, and graphical analysis of motion. The document is intended to help students understand and study the concepts of kinematics.
This document defines key concepts in kinematics including reference frames, average and instantaneous speed and velocity, acceleration, equations of motion, scalar and vector quantities, vector addition and subtraction, and product of vectors. It also discusses projectile motion, motion under gravity, and conditions for equilibrium. Key concepts covered include inertial frames, definitions of average speed, velocity, and acceleration, equations of motion with constant acceleration, vector addition and subtraction using triangle and parallelogram laws, dot and cross products of vectors, and projectile motion equations.
This document discusses key concepts in kinematics including:
- Kinematics is the study of motion without considering causes. It focuses on rectilinear or straight-line motion.
- Displacement is a vector quantity that describes the shortest distance between initial and final positions, while distance is a scalar quantity describing the actual path traveled.
- Uniform motion occurs when equal displacements happen in equal time intervals, resulting in a straight line on a position-time graph. Non-uniform motion has acceleration.
1. The document discusses various concepts related to one-dimensional motion including position, distance, displacement, speed, velocity, and acceleration.
2. It defines key terms like displacement as the change in position of an object, velocity as a vector quantity that includes both speed and direction, and acceleration as the rate of change of velocity with respect to time.
3. Examples and equations are provided to calculate quantities like average speed, average velocity, and instantaneous velocity from distance-time graphs or data tables.
This document discusses the difference between scalar and vector quantities in mechanics. It defines a scalar quantity as one that can be described by magnitude alone, such as mass, length, and time. A vector quantity requires both magnitude and direction to be fully described, such as velocity. Speed is defined as the rate of change of distance over time and is a scalar, while velocity is the rate of change of displacement over time and is a vector, as it includes both magnitude and direction. Examples are provided of speed, such as Usain Bolt's running speed, and velocity, such as a cricket ball being hit at an angle.
This document summarizes key concepts about acceleration, velocity, and motion graphs. It defines acceleration as the rate of change of velocity and describes how to calculate average acceleration using motion diagrams. Positive and negative acceleration are explained using examples. Velocity-time graphs are introduced and it is noted that slope represents acceleration and area under the curve indicates displacement. Equations for motion with constant acceleration are derived, including relationships between position, velocity, acceleration, and time. Finally, free fall under the influence of gravity is discussed, noting Galileo's findings, the definition of gravitational acceleration g, and how velocity and position change over time in free fall situations.
A New Method For Solving Kinematics Model Of An RA-02IJERA Editor
The kinematics miniature are established for a 4 DOF robotic arm. Denavit-Hartenberg (DH) convention and the
product of exponential formula are used for solving kinematic problem based on screw theory. For acquiring
simple matrix for inverse kinematics a new simple method is derived by solving problems like robot base
movement, actuator restoration. Simulations are done by using MATlab programming for the kinematics
exemplary.
Important Helpful Physics Notes/Formula--Must Seeanicholls1234
The document discusses key physics concepts related to motion including:
- Speed is distance traveled over time. Velocity includes direction of motion.
- The slope of a distance-time graph represents speed. The area under a velocity-time graph represents distance traveled.
- Forces can cause objects at rest to accelerate or objects in motion to speed up, slow down, or change direction depending on whether the net force is zero or non-zero. Acceleration depends on the net force applied and the object's mass.
The document discusses acceleration and related concepts:
- Acceleration is the change in velocity per unit of time and is a vector quantity. It results from an applied force and is proportional to the force's magnitude.
- Velocity is speed in a given direction, while speed is the distance traveled per time and does not consider direction.
- Average acceleration is calculated as the change in velocity divided by the time interval. Instantaneous acceleration is the slope of the velocity-time graph at an instant.
- Examples demonstrate calculating average speed and acceleration from initial and final velocities and time intervals. Direction and signs of displacement, velocity, and acceleration must be considered carefully.
This document provides an introduction to kinematics, including definitions of key terms like speed, velocity, acceleration and their relationships. It discusses how to calculate average speed and uniform acceleration. Graphs are presented as useful tools, including distance-time and speed-time graphs. Motion under conditions like constant acceleration, non-uniform acceleration and free fall are also examined. Readers are assigned questions to assess their understanding of basic kinematics concepts covered.
1) Derivatives relate the rates of change of position, velocity, and acceleration. Velocity is the derivative of position and measures rate of change of displacement. Acceleration is the derivative of velocity and measures the rate of change of velocity.
2) The Mean Value Theorem states that for a continuous function over an interval, there exists at least one point where the slope of the tangent line equals the slope of the secant line between the endpoints.
3) A function's derivatives provide information about the behavior of the original function. The first derivative relates to slope and critical points where the function is increasing/decreasing. The second derivative indicates points of inflection where the concavity changes.
College Physics 1st Edition Etkina Solutions ManualHowardRichsa
This document contains a chapter from the textbook "College Physics" by Etkina, Gentile, and Van Heuvelen. It includes multiple choice and conceptual questions about kinematics concepts like displacement, velocity, acceleration. It also includes practice problems asking students to draw motion diagrams and choose reference frames. The key concepts covered are scalar and vector quantities, relationships between displacement, velocity and acceleration, and using graphs to represent motion.
This document provides an overview of differentiation and derivatives. It defines the derivative as the instantaneous rate of change of a quantity with respect to another. The process of finding derivatives is called differentiation. Isaac Newton and Gottfried Leibniz developed the fundamental theorem of calculus in the 17th century. Derivatives have many applications across various sciences such as physics, biology, economics, and chemistry. They are used to calculate velocity, acceleration, population growth rates, marginal costs/revenues, reaction rates, and more.
Christian Kasumo gave a presentation at the ZAME Annual Provincial Conference on teaching kinematics. He defined key kinematics concepts like displacement, velocity, acceleration, and discussed common student difficulties. He recommended teaching kinematics through real-world examples, group work, and activities using software like Geogebra to help students understand graphs and equations of motion. He concluded by thanking the organizers and Mulungushi University for their support.
Distance is how far an object travels from its starting point, while displacement includes direction of motion. Speed is how fast an object moves, while velocity includes both speed and direction. Acceleration is a change in velocity over time. Distance-time graphs show how distance changes with time, and can indicate if an object has constant or changing velocity. Velocity-time graphs show how velocity changes with time, and can show if an object has constant, increasing, or decreasing acceleration. Both graphs can be used to analyze an object's motion based on its regions.
This document discusses key concepts relating to motion, including distance, time, speed, and their relationships. It aims to help students understand and apply these concepts using spreadsheets and graphs. Specifically, it explains that distance, speed, and time are inversely proportional, and provides formulas to calculate these values given two of the variables. The document also demonstrates how to represent motion graphically using distance-time and speed-time graphs, and how to interpret features of these graphs like slope, acceleration, and deceleration. Students are instructed to apply these concepts by plotting graphs in Excel and completing an assignment on Edmodo by the due date.
This document contains notes from a physics class discussing kinematics graphs. It includes examples of how to interpret distance vs. time, velocity vs. time, and acceleration vs. time graphs. It also provides practice problems asking students to draw and analyze different graph types based on given motion information.
This document introduces key concepts of 1-D kinematics including:
1) Distance refers to the total path traveled while displacement refers to the change in position from initial to final point.
2) Kinematics describes motion without considering causes, and 1-D kinematics refers to motion in a straight line.
3) Graphs can distinguish between distance and displacement, with displacement being the straight line segment between initial and final points.
4) Key concepts such as average speed, average velocity, acceleration, and free fall are introduced along with relevant equations and demonstrations.
This document provides an introduction to 1-dimensional kinematics, including distance, displacement, average speed, average velocity, acceleration, and position-time and velocity-time graphs. It defines key terms like distance, displacement, speed, velocity, acceleration, and discusses the relationships between these quantities. Examples and practice problems are provided to illustrate concepts like the difference between distance and displacement, calculating average speed and velocity, determining acceleration from graphs, and using kinematic equations.
Physique et Chimie de la Terre Physics and Chemistry of the .docxLacieKlineeb
Physique et Chimie de la Terre / Physics and Chemistry of the Earth 2022 / 2023
Homework
Physics of the Earth
Deadline : 10th of november
The Herglotz-Wiechert method and
Earth’s mantle seismic velocities profiles
The goal of this problem is to build a model of the P and S wave velocity profiles in the Mantle,
from travel times tables build from observations. To do this, we will use the Herglotz-Wiechert method,
a method developed by Gustav Herglotz and Emil Wiechert at the beginning of the twentieth century.
We consider a seismic ray going from point S to point A, as depicted on figure 1. We denote by ∆
the angular distance of travel (i.e. the angle ŜCA), and by T (∆) the travel time of the seismic wave
as a function of angular distance. We recall that in spherical geometry the ray parameter is defined as
p = r sin i(r)
V (r) , (1)
and is constant along a given ray. Here r is the distance from the center of the Earth, i(r) is the
incidence angle (i.e. the angle between the ray and the vertical direction at a given r), and V (r) is the
wave velocity. We denote by R = 6371 km the radius of the Earth.
∆
d∆
R
p
p + dp
i
A
A’B
S
C
rb
Figure 1 – Two rays coming from the same source S with infinitesimally different ray parameters p and p + dp. Their
angular distances of travel are ∆ and ∆+ d∆, and their travel-times are T and T + dT . The line going through points A
and B is perpendicular to both rays.
1 Constant velocity model
Let us first assume that the wave velocity V does not vary with depth.
1. Draw on a figure the ray going from a source S to a point A of the surface, without any reflexion.
This ray could represent either the P or S phase.
2. Find the expression of the travel time T along this ray as a function of ∆.
3. Find the expression of the incidence angle i of the ray at point A as a function of the epicentral
distance ∆, and then show that the ray parameter is given by
p = R
V
cos
∆
2
. (2)
1/3
Physique et Chimie de la Terre / Physics and Chemistry of the Earth 2022 / 2023
2 Linking p to T and ∆
We now turn to a more realistic model and allow for radial variations of the waves velocities.
4. By considering two rays coming from the same source with infinitesimally different ray parameters
p and p + dp, and travel times T and T + dT (Figure 1a), demonstrate that
p = dT
d∆
. (3)
Hints : (1) Since the two rays are very close, the arcs connecting A to A’, A to B, and B to A’
can be approximated as straight lines. (2) Show first that the segment AB is part of a wavefront.
What does it imply for the times of arrivals at points A and B ?
5. Check that the expressions of p and T found for the constant velocity model are consistent with
eq. (3).
3 Travel time curves and estimate of the p(∆) curves
You will find on Chamillo a file containing travel time tables obtained from the global Earth’s seis-
mological model ak135 (either a text file, AK135tables.txt, or an Excel spreadsheet, AK135tables.xlsx).
The f.
Similar to Lab 2Lab 2- Kinematics.pdf142017 Lab 2 Kinematicsh.docx (20)
PART B Please response to these two original posts below. Wh.docxsmile790243
PART B
Please response to these two original posts below. When
responding to these posts, please either expand the
thought, add additional insights, or respectfully disagree
and explain why. Remember that we are after reasons
and arguments, and not simply the statement of
opinions.
Original Post 1
Are human lives intrinsically valuable? If so, in virtue of what? (Is
it our uniqueness, perhaps, or our autonomy, or something else?)
To begin, I would like to remind us that being intrinsically valuable
means having values for just being us and nothing else. I believe
that human lives are intrinsically valuable in virtue of our
uniqueness. As a bio nerd, I would like to state the fact that there
are a lot of crossover events during meiosis, which create trillions
of different DNA combinations. Hence, from a biological
standpoint, without considering other aspects, being you is
already valuable because you are that one sperm that won the
race and got fertilized. On a larger scale, there are hardly two
people whose look and behaviors are the same in the same
family, unless they are identical twins. However, identical twins
still act differently and have differences (such as fingerprints).
Since we are raised in different families, we are taught different
things and have different cultures. In general, we all have
different genetic information, appearances, personalities, senses
of humor, ambitions, talents, interests and life experiences. These
characteristics make up our “unique individual value” and make
us so unique and irreplaceable.
I would also love to discuss how our diversities enrich and
contribute to society, but that would be a talk about our extrinsic
values.
Original Post 2
Are human lives intrinsically valuable? If so, in virtue of what? (Is
it our uniqueness, perhaps, or our autonomy, or something else?)
I believe that human lives are intrinsically valuable due to a
number of reasons. Firstly, human lives aren’t replaceable. You
can’t replace a human being with another just like you can
replace a broken laptop with brand new one. Part of the reason
why we tend to think this way is that we were nurtured with the
notion that there is, indeed, a special value to human life. This
could be in virtue of our uniqueness-- the fact that we are
sentient and capable of complex thoughts and emotions
separates us from any other species on this planet. From a
scientific standpoint, this is also one of the reasons as to why
humans became the dominant species in today’s age.
Moreover, human lives aren’t disposable. I think this is largely due
to us humans having the ability to empathize with others. We
understand that it’s morally inappropriate to take the life of
another individual even if they’re complete strangers because
they’re another human being like us who has their own thoughts,
values, memories, and stories. In a way, we have a strong
emotional connection to our own species. As .
Part C Developing Your Design SolutionThe Production Cycle.docxsmile790243
Part C Developing Your Design
Solution
The Production Cycle
Within the four stages of the design workflow there are two distinct parts.
The first three stages, as presented in Part B of this book, were described
as ‘The Hidden Thinking’ stages, as they are concerned with undertaking
the crucial behind-the-scenes preparatory work. You may have completed
them in terms of working through the book’s contents, but in visualisation
projects they will continue to command your attention, even if that is
reduced to a background concern.
You have now reached the second distinct part of the workflow which
involves developing your design solution. This stage follows a production
cycle, commencing with rationalising design ideas and moving through to
the development of a final solution.
The term cycle is appropriate to describe this stage as there are many loops
of iteration as you evolve rapidly between conceptual, practical and
technical thinking. The inevitability of this iterative cycle is, in large part,
again due to the nature of this pursuit being more about optimisation rather
than an expectation of achieving that elusive notion of perfection. Trade-
offs, compromises, and restrictions are omnipresent as you juggle ambition
and necessary pragmatism.
How you undertake this stage will differ considerably depending on the
nature of your task. The creation of a relatively simple, single chart to be
slotted into a report probably will not require the same rigour of a formal
production cycle that the development of a vast interactive visualisation to
be used by the public would demand. This is merely an outline of the most
you will need to do – you should edit, adapt and participate the steps to fit
with your context.
There are several discrete steps involved in this production cycle:
Conceiving ideas across the five layers of visualisation design.
Wireframing and storyboarding designs.
Developing prototypes or mock-up versions.
219
Testing.
Refining and completing.
Launching the solution.
Naturally, the specific approach for developing your design solution (from
prototyping through to launching) will vary hugely, depending particularly
on your skills and resources: it might be an Excel chart, or a Tableau
dashboard, an infographic created using Adobe Illustrator, or a web-based
interactive built with the D3.js library. As I have explained in the book’s
introduction, I’m not going to attempt to cover the myriad ways of
implementing a solution; that would be impossible to achieve as each task
and tool would require different instructions.
For the scope of this book, I am focusing on taking you through the first
two steps of this cycle – conceiving ideas and wireframing/storyboarding.
There are parallels here with the distinctions between architecture (design)
and engineering (execution) – I’m effectively chaperoning you through to
the conclusion of your design thinking.
To fulfil this, Part C presents a detailed breakdown of the many design
.
PART A You will create a media piece based around the theme of a.docxsmile790243
PART A:
You will create a media piece based around the theme of “alternative facts.
Fake News:
Create a
series of 3
short, “fake news” articles or news videos. They should follow a specific theme. Make sure to have a clear understanding of WHY your fake news is being created (fake news is used by people, groups, companies, etc to convince an unsuspecting audience of something. It’s supposed to seem real, but the motivation behind it is to deceive. As part of this option, consider what your motivations are for your deception).
Part A: should be around 750 words for written tasks (or 250 for each 3 part task)
PART B:
The focus for this assignment is to demonstrate a
clear understanding of media conventions
, as well as
purpose
and
audience
. Therefore, along with your media product, you’ll also be required to submit a short
reflection
detailing why you created your product and for whom it was intended. You must discuss and analyze the elements within your media product (including why & how you used the persuasive techniques of ethos, logos and pathos) as well as the other elements of media you used and why.
.
Part 4. Implications to Nursing Practice & Implication to Patien.docxsmile790243
Part 4. Implications to Nursing Practice & Implication to Patient Outcomes
Provide a paragraph summary addressing the topics implications to nursing practice and patient outcomes. This section is NOT another review of the literature or introduction of new topics related to the PICOT question.
You may find if helpful to begin each topic with -
Nurses need to know …
Important patient outcomes include …
Example
– please note this is an older previous students work and so some references are older than 5 years.
Be sure to provide the PICOT question to begin this post.
PICOT Question:
P=Patient Population
I=Intervention
C=Comparison
O=Outcome
T=Time (duration):
In patients in the hospital, (P)
how does frequently provided patient hand washing (I)
compared with patient initiated hand washing (C)
affect hospital acquired infection (O)
within the hospital stay (T)
Implications to Nursing Practice & Patient Outcomes
Nurses need to know that they play a significant role in the reduction of hospital acquired infection by ensuring by health care workers and patients wash hands since nurses have the most interactions with patients. Implementing hand hygiene protocol with patients can enhance awareness and decrease healthcare associated infection (HAI). Both nurses and patients need to know that HAI is associated with increased morbidity and mortality as well cost of treatment and length of hospital stay. Nurses and patients also need to know that most HAI is preventable. Gujral (2015) notes that proper hand hygiene is the single most important, simplest, and least expensive means of reducing prevalence of HAI and the spread of antimicrobial resistance. Nurse and patient hand washing plays a vital role in decreasing healthcare costs and infections in all settings.
References
Gujral, H. (2015.) Survey shows importance of hand washing for infection prevention. American Nurse Today, 10 (10), 20. Retrieved from hEp://www.nursingworld.org/AmericanNurseToday
.
PART AHepatitis C is a chronic liver infection that can be e.docxsmile790243
PART A
Hepatitis C is a chronic liver infection that can be either silent (with no noticeable symptoms) or debilitating. Either way, 80% of infected persons experience continuing liver destruction. Chronic hepatitis C infection is the leading cause of liver transplants in the United States. The virus that causes it is blood borne, and therefore patients who undergo frequent procedures involving transfer of blood are particularly susceptible to infection. Kidney dialysis patients belong to this group. In 2008, a for-profit hemodialysis facility in New York was shut down after nine of its patients were confirmed as having become infected with hepatitis C while undergoing hemodialysis treatments there between 2001 and 2008.
When the investigation was conducted in 2008, investigators found that 20 of the facility’s 162 patients had been documented with hepatitis C infection at the time they began their association with the clinic. All the current patients were then offered hepatitis C testing, to determine how many had acquired hepatitis C during the time they were receiving treatment at the clinic. They were considered positive if enzyme-linked immunosorbent assay (ELISA) tests showed the presence of antibodies to the hepatitis C virus.
Health officials did not test the workers at the hemodialysis facility for hepatitis C because they did not view them as likely sources of the nine new infections. Why not?
Why do you think patients were tested for antibody to the virus instead of for the presence of the virus itself?
Ref.: Cowan, M. K. (2014) (4th Ed.). Microbiology: A Systems Approach, McGraw Hill
PART B
Summary:
Directions for the students: There are 4 essay questions. Please be sure to complete all of them with thorough substantive responses. Current APA Citations are required for all responses.
1. Precisely what is microbial death?
2. Why does a population of microbes not die instantaneously when exposed to an antimicrobial agent?
3. Explain what is wrong with this statement: “Prior to vaccination, the patient’s skin was sterilized with alcohol.” What would be a more correct wording?
4. Conduct additional research on the use of triclosan and other chemical agents in antimicrobial products today. Develop an opinion on whether this process should continue, providing evidence and citations to support your stance.
.
Part A post your answer to the following question1. How m.docxsmile790243
Potential negative reactions from others to an adolescent questioning their sexual identity or gender role could negatively impact their social environment, behavior, and self-esteem. As social workers, we can play a role in creating a supportive environment for these adolescents by educating families and communities, advocating for inclusive policies, and providing counseling and resources to help adolescents accept themselves and develop coping strategies.
PART BPlease response to these two original posts below..docxsmile790243
PART B
Please response to these two original posts below. When responding to
these posts, please either expand the thought, add additional insights, or
respectfully disagree and explain why. Remember that we are after reasons
and arguments, and not simply the statement of opinions.
Original Post 1
"What is moral relativism? Why might people be attracted to it? Is
it plausible?"
First of all, moral relativism is the view that moral truths are
subjective and depend on each individual's standpoints. Based
on this, everyone's moral view is legitimate. This can be attracted
because it sounds liberating and there is no need to argue for a
particular position. Moral relativism seems convincing in some
cases. For example, some people are okay with giving money to
homeless people, thinking that it's good to provide for the people
in need. Some people, on the other hand, claim that they can
work to satisfy their own needs. Moral relativism works well in
these cases because they all seem legitimate. However, there are
cases that moral relativism does not seem reasonable. For
example, child sacrifice in some cultures seems cruel and
uncivilized to most people. Hence, moral relativism is not
absolutely true.
Original Post 2
“Is your death bad for you, specifically, or only (at most) for others? Why
might someone claim that it isn’t bad for you?”
I'd start off by acknowledging what the two ancient philosophers,
Lucretius and Epicurus, outlined about death. They made the
point that death isn't necessarily bad for you since no suffering
takes place and that you yourself don't realize your own death. In
this way, one could make the claim that death isn't intrinsically
bad for you.
Another perspective I wanted to add was the influence of death
(both on you and others around you). Specifically, the event of
death itself may not be bad for you, but the idea of impending
death could impact one's life. Some may live freely, totally care-
free, accepting of death and enjoy life in the moment. Others may
be frightened by the idea of death that they live in constant fear
and hence death causing their mental health to take its toll. In
this way, I'd argue that death could, in fact, be bad for you. One
common reason for being afraid of death is the fear of being
forgotten. Not to mention the death of an individual certainly
affects others; death doesn't affect one's life but also all that is
connected to it. Focusing back to the point, it's clear that the
very idea of death directly affects the concerned individual. The
fact that those who live in fear of death are looking for legacies
and footprints to leave after they leave this world is telling of how
death could be arguably bad for you before it even happens.
PART A
Pick one or more questions below and write a substantive post
with >100 words. Please try to provide evidence(s) to support
your idea(s).
Questions:
• Do we have a duty to work out whe.
Part A (50 Points)Various men and women throughout history .docxsmile790243
Part A (50 Points):
Various men and women throughout history have made important contributions to the development of statistical science. Select any one (1) individual from the list below and write a 2 page summary of their influence on statistics. Be specific in detail to explain the concepts they developed and how this advanced our understanding and application of statistics.
Florence Nightingale
Francis Galton
Thomas Bayes
Part B (50 Points):
Select any one statistical concept you learned in this course and explain how it can be applied to our understanding of the Covid-19 pandemic (2 pages). You should use a specific example and include at least one diagram to illustrate your answer.
Please note: Your work must be original and not copied directly from other sources. No citations are needed. Be sure to submit this assignment in Blackboard on the due date specified.
.
This document discusses urinary tract infections (UTIs). It begins with a matching exercise identifying structures of the urinary system. The second part addresses UTIs in more detail. It defines a UTI, discusses the microorganisms that cause UTIs and where they enter the body. It also explains common signs and symptoms of UTIs, as well as diagnostic tests and treatments. The document concludes by noting that UTIs are more common in women and describes some ways women can reduce their risk.
Part A Develop an original age-appropriate activity for your .docxsmile790243
The document describes developing two original age-appropriate activities for preschoolers. The first activity uses either Froebel's cube gift, parquetry gift, or Lincoln Logs and identifies two skills it develops. The second activity promotes the same skills but is based on the Montessori method. The summary describes each activity and notes two key differences between them.
Part 3 Social Situations2. Identify multicultural challenges th.docxsmile790243
Part 3: Social Situations
2. Identify multicultural challenges that your chosen individual may face as a recent
refugee.
• What are some of the issues that can arise for someone who has recently
immigrated to a new country?
• Explain how these multicultural challenges could impact your chosen individual’s
four areas of development?
3. Suggest plans of action or resources that you feel should be provided to this family to
assist them in proper develop
Part 3: Social Situations
• Proposal paper which identifies multicultural challenges that your chosen individual may face as a recent refugee.
• Suggested plan of action and/or resources which should be implemented to address the multicultural challenges.
• 2-3 Pages in length
• APA Formatting
• Submission will be checked for plagiaris
.
Part A (1000 words) Annotated Bibliography - Create an annota.docxsmile790243
Part A
(1000 words): Annotated Bibliography - Create an annotated bibliography that focuses on ONE particular aspect of current Software Engineering that face a world with different cultural standards. At least seven (7) peer-reviewed articles must be used for this exercise.
Part B
(3000 words):
Research Report
- Write a report of the analysis and synthesis using the
(Part A
) foundational
Annotated Bibliography
.
Part C (500 words): Why is it important to try to minimize complexity in a software system.
Part D (500 words): What are the advantages and disadvantages to companies that are developing software products that use cloud servers to support their development process?
Part E (500 words): Explain why each microservice should maintain its own data. Explain how data in service replicas can be kept consistent?
.
Part 6 Disseminating Results Create a 5-minute, 5- to 6-sli.docxsmile790243
Part 6: Disseminating Results
Create a 5-minute, 5- to 6-slide narrated PowerPoint presentation of your Evidence-Based Project:
· Be sure to incorporate any feedback or changes from your presentation submission in Module 5.
· Explain how you would disseminate the results of your project to an audience. Provide a rationale for why you selected this dissemination strategy.
Points Range: 81 (81%) - 90 (90%)
The narrated presentation accurately and completely summarizes the evidence-based project. The narrated presentation is professional in nature and thoroughly addresses all components of the evidence-based project.
The narrated presentation accurately and clearly explains in detail how to disseminate the results of the project to an audience, citing specific and relevant examples.
The narrated presentation accurately and clearly provides a justification that details the selection of this dissemination strategy that is fully supported by specific and relevant examples.
The narrated presentation provides a complete, detailed, and specific synthesis of two outside resources related to the dissemination strategy explained. The narrated presentation fully integrates at least two outside resources and two or three course-specific resources that fully support the presentation.
Written Expression and Formatting—Paragraph Development and Organization:
Paragraphs make clear points that support well-developed ideas, flow logically, and demonstrate continuity of ideas. Sentences are carefully focused—neither long and rambling nor short and lacking substance. A clear and comprehensive purpose statement and introduction is provided which delineates all required criteria.
Points Range: 5 (5%) - 5 (5%)
Paragraphs and sentences follow writing standards for flow, continuity, and clarity.
A clear and comprehensive purpose statement, introduction, and conclusion is provided which delineates all required criteria.
Written Expression and Formatting—English Writing Standards:
Correct grammar, mechanics, and proper punctuation.
Points Range: 5 (5%) - 5 (5%)
Uses correct grammar, spelling, and punctuation with no errors.
Evidenced Based Change
Leslie Hill
Walden University
Introduction/PurposeChange is inevitable.Health care organizations need change to improve.There are challenges that need to be addressed(Baraka-Johnson et al. 2019).Challenges should be addressed using evidence-based research.These changes enhance professionalism therefore improving quality of care and quality of life.The purpose of this paper is to identify an existing problem in health care and suggest a change idea that would be effective in addressing the problem. The paper also articulates risks associated with the change process, how to distribute the change information and how to implement change successfully.
Organizational CultureThe Organization is a hospice facilityOffers end of life care for pain and symptom managementThe health care providers cu.
Part 3 Social Situations • Proposal paper which identifies multicul.docxsmile790243
Part 3: Social Situations • Proposal paper which identifies multicultural challenges that your chosen individual may face as a recent refugee. • Suggested plan of action and/or resources which should be implemented to address the multicultural challenges. • 2-3 Pages in length • APA Formatting • Submission will be checked for plagiarism
Part 3: Social Situations 2. Identify multicultural challenges that your chosen individual may face as a recent refugee. • What are some of the issues that can arise for someone who has recently immigrated to a new country? • Explain how these multicultural challenges could impact your chosen individual’s four areas of development? 3. Suggest plans of action or resources that you feel should be provided to this family to assist them in proper development.
.
Part 3 Social Situations 2. Identify multicultural challenges that .docxsmile790243
Part 3: Social Situations 2. Identify multicultural challenges that your chosen individual may face as a recent refugee. • What are some of the issues that can arise for someone who has recently immigrated to a new country? • Explain how these multicultural challenges could impact your chosen individual’s four areas of development? 3. Suggest plans of action or resources that you feel should be provided to this family to assist them in proper development.
Part 3: Social Situations • Proposal paper which identifies multicultural challenges that your chosen individual may face as a recent refugee. • Suggested plan of action and/or resources which should be implemented to address the multicultural challenges. • 2-3 Pages in length • APA Formatting • Submission will be checked for plagiarism
.
Part 2The client is a 32-year-old Hispanic American male who c.docxsmile790243
Part 2
The client is a 32-year-old Hispanic American male who came to the United States when he was in high school with his father. His mother died back in Mexico when he was in school. He presents today to the PMHNPs office for an initial appointment for complaints of depression. The client was referred by his PCP after “routine” medical work-up to rule out an organic basis for his depression. He has no other health issues except for some occasional back pain and “stiff” shoulders which he attributes to his current work as a laborer in a warehouse. the “Montgomery- Asberg Depression Rating Scale (MADRS)” and obtained a score of 51 (indicating severe depression). reports that he always felt like an outsider as he was “teased” a lot for being “black” in high school. States that he had few friends, and basically kept to himself. He also reports a remarkably diminished interest in engaging in usual activities, states that he has gained 15 pounds in the last 2 months. He is also troubled with insomnia which began about 6 months ago, but have been progressively getting worse. He does report poor concentration which he reports is getting in “trouble” at work.
· Decision #1: start Zoloft 25mg orally daily
· Which decision did you select?
· Why did you select this decision? Support your response with evidence and references to the Learning Resources.
· What were you hoping to achieve by making this decision? Support your response with evidence and references to the Learning Resources.
· Explain any difference between what you expected to achieve with Decision #1 and the results of the decision. Why were they different?
· Decision #2: Client returns to clinic in four weeks, reports a 25% decrease in symptoms but concerned over the new onset of erectile dysfunction
*add Augmentin Wellbutrin IR 150mg in the morning
· Why did you select this decision? Support y our response with evidence and references to the Learning Resources.
· What were you hoping to achieve by making this decision? Support your response with evidence and references to the Learning Resources.
· Explain any difference between what you expected to achieve with Decision #2 and the results of the decision. Why were they different?
· Decision #3: Client returns to clinic in four weeks, Client stated that depressive symptoms have decreased even more and his erectile dysfunction has abated
· Client reports that he has been feeling “jittery” and sometimes “nervous”
*change to Wellbutrin XL 150mg daily
· Why did you select this decision? Support your response with evidence and references to the Learning Resources.
· What were you hoping to achieve by making this decision? Support your response with evidence and references to the Learning Resources.
· Explain any difference between what you expected to achieve with Decision #3 and the results of the decision. Why were they different?
Explain how ethical considerations might impact your treatment plan and communication with clients.
Conclusion.
Part 2For this section of the template, focus on gathering deta.docxsmile790243
Part 2:
For this section of the template, focus on gathering details about common, specific learning disabilities. These disabilities fall under the IDEA disability categories you researched for the chart above. Review the textbook and the topic study materials and use them to complete the chart.
Learning Disability Definition Characteristics Common Assessments for Diagnosis Potential Effect on Learning and Other Areas of Life Basic Strategies for Addressing the Disability
Attention Deficit Hyperactivity Disorder (ADHD)
Auditory Processing Disorder (APD)
Dyscalculia
Dysgraphia
Dyslexia
Dysphasia/Aphasia
Dyspraxia
Language Processing Disorder (LPD)
Non-Verbal Learning Disabilities
Visual Perceptual/Visual Motor Deficit
.
Part 2 Observation Summary and Analysis • Summary paper of observat.docxsmile790243
Part 2: Observation Summary and Analysis • Summary paper of observation findings for each area of development and connection to the observed participant. • Comprehensive description of the observed participant. • Analyzed observation experience with course material to determine whetherthe participant is developmentally on track for each area of development. • 4 Pages in length • APA Formatting • Submission will be checked for plagiarism
Part 2: Observation Summary and Analysis 1. Review and implement any comments from your instructor for Part 1: Observation. 2. Describe the participant that you observed. • Share your participant’s first name (can be fictional name if participant wants to remain anonymous), age, physical attributes, and you initial impressions. 3. Analyze your observation findings for each area of development (physical, cognitive, social/emotional, and spiritual/moral). • Explain how your observations support the 3-5 bullets for each area of development that you identified in your Development Observation Guidefrom Part 1: Observation. • Explain whether or not your participant is developmentally on track for each area of development. 4. What stood out the most to you about the observation? 5. Include at least 2 credible sources
.
Part 2 Observation Summary and Analysis 1. Review and implement any.docxsmile790243
Part 2: Observation Summary and Analysis 1. Review and implement any comments from your instructor for Part 1: Observation. 2. Describe the participant that you observed. • Share your participant’s first name (can be fictional name if participant wants to remain anonymous), age, physical attributes, and you initial impressions. 3. Analyze your observation findings for each area of development (physical, cognitive, social/emotional, and spiritual/moral). • Explain how your observations support the 3-5 bullets for each area of development that you identified in your Development Observation Guidefrom Part 1: Observation. • Explain whether or not your participant is developmentally on track for each area of development. 4. What stood out the most to you about the observation? 5. Include at least 2 credible sources
Part 2: Observation Summary and Analysis • Summary paper of observation findings for each area of development and connection to the observed participant. • Comprehensive description of the observed participant. • Analyzed observation experience with course material to determine whetherthe participant is developmentally on track for each area of development. • 4-6 Pages in length • APA Formatting • Submission will be checked for plagiarism
.
Part 2Data collectionfrom your change study initiative,.docxsmile790243
Part 2:
Data collection
from your change study initiative, sample, method, display of the results of the data itself, process, and method of analysis (graphs, charts, frequency counts, descriptive statistics of the data, narrative)
Part 3: Interpretation of the results of the Data
Collection and
Analysis, address likely resistance, and provide recommendations for continuing
the study
or evaluating your change study/initiative.
.
it describes the bony anatomy including the femoral head , acetabulum, labrum . also discusses the capsule , ligaments . muscle that act on the hip joint and the range of motion are outlined. factors affecting hip joint stability and weight transmission through the joint are summarized.
How to Fix the Import Error in the Odoo 17Celine George
An import error occurs when a program fails to import a module or library, disrupting its execution. In languages like Python, this issue arises when the specified module cannot be found or accessed, hindering the program's functionality. Resolving import errors is crucial for maintaining smooth software operation and uninterrupted development processes.
This presentation includes basic of PCOS their pathology and treatment and also Ayurveda correlation of PCOS and Ayurvedic line of treatment mentioned in classics.
Assessment and Planning in Educational technology.pptxKavitha Krishnan
In an education system, it is understood that assessment is only for the students, but on the other hand, the Assessment of teachers is also an important aspect of the education system that ensures teachers are providing high-quality instruction to students. The assessment process can be used to provide feedback and support for professional development, to inform decisions about teacher retention or promotion, or to evaluate teacher effectiveness for accountability purposes.
Exploiting Artificial Intelligence for Empowering Researchers and Faculty, In...Dr. Vinod Kumar Kanvaria
Exploiting Artificial Intelligence for Empowering Researchers and Faculty,
International FDP on Fundamentals of Research in Social Sciences
at Integral University, Lucknow, 06.06.2024
By Dr. Vinod Kumar Kanvaria
A workshop hosted by the South African Journal of Science aimed at postgraduate students and early career researchers with little or no experience in writing and publishing journal articles.
A review of the growth of the Israel Genealogy Research Association Database Collection for the last 12 months. Our collection is now passed the 3 million mark and still growing. See which archives have contributed the most. See the different types of records we have, and which years have had records added. You can also see what we have for the future.
Physiology and chemistry of skin and pigmentation, hairs, scalp, lips and nail, Cleansing cream, Lotions, Face powders, Face packs, Lipsticks, Bath products, soaps and baby product,
Preparation and standardization of the following : Tonic, Bleaches, Dentifrices and Mouth washes & Tooth Pastes, Cosmetics for Nails.
A Strategic Approach: GenAI in EducationPeter Windle
Artificial Intelligence (AI) technologies such as Generative AI, Image Generators and Large Language Models have had a dramatic impact on teaching, learning and assessment over the past 18 months. The most immediate threat AI posed was to Academic Integrity with Higher Education Institutes (HEIs) focusing their efforts on combating the use of GenAI in assessment. Guidelines were developed for staff and students, policies put in place too. Innovative educators have forged paths in the use of Generative AI for teaching, learning and assessments leading to pockets of transformation springing up across HEIs, often with little or no top-down guidance, support or direction.
This Gasta posits a strategic approach to integrating AI into HEIs to prepare staff, students and the curriculum for an evolving world and workplace. We will highlight the advantages of working with these technologies beyond the realm of teaching, learning and assessment by considering prompt engineering skills, industry impact, curriculum changes, and the need for staff upskilling. In contrast, not engaging strategically with Generative AI poses risks, including falling behind peers, missed opportunities and failing to ensure our graduates remain employable. The rapid evolution of AI technologies necessitates a proactive and strategic approach if we are to remain relevant.
हिंदी वर्णमाला पीपीटी, hindi alphabet PPT presentation, hindi varnamala PPT, Hindi Varnamala pdf, हिंदी स्वर, हिंदी व्यंजन, sikhiye hindi varnmala, dr. mulla adam ali, hindi language and literature, hindi alphabet with drawing, hindi alphabet pdf, hindi varnamala for childrens, hindi language, hindi varnamala practice for kids, https://www.drmullaadamali.com
1. Lab 2/Lab 2- Kinematics.pdf
1/4/2017 Lab 2: Kinematics
https://moodle.straighterline.com/pluginfile.php/72219/mod_res
ource/content/17/CourseRoot/html/lab004s001.html 1/20
Learning Objec뙕ves
Disᣊ�nguish between scalar and vector quanᣊ�ᣊ�es
Apply kinemaᣊ�c equaᣊ�ons to 1‐D and projecᣊ�le moᣊ�on
Predict posiᣊ�on, velocity, and acceleraᣊ�on vs. ᣊ�me graph
s
Calculate average and instantaneous velocity or acceleraᣊ�on
Determine that x and y components are independent of each oth
er
Relate velocity, radius, and ᣊ�me period to uniform circular m
oᣊ�on.
Explain the direcᣊ�on of acceleraᣊ�on during uniform circula
r moᣊ�on
1‐D Kinema뙕cs
1‐D kinemaᣊ�cs occurs when an object travels in
one dimension and can be described using words,
equaᣊ�ons and graphs. Linear mo뙕on describes
how an object will move horizontally or verᣊ�cally
with constant acceleraᣊ�on, how an object will
2. 1/4/2017 Lab 2: Kinematics
https://moodle.straighterline.com/pluginfile.php/72219/mod_res
ource/content/17/CourseRoot/html/lab004s001.html 2/20
Figure 1: Pool balls in moᾷon demonstrate
1‐D kinemaᾷcs.
Figure 2: Line secant to the path of the
object.
travel if dropped from the side of a cliff, and the
path it will follow if thrown straight up into the air.
Keep in mind the moᣊ�on of an object is relaᣊ�ve to
the viewer. Even though you do not feel like you
are in moᣊ�on right now, you are on planet earth
that has rotaᣊ�onal moᣊ�on in addiᣊ�on to orbital
moᣊ�on around the sun. In almost all cases here
moᣊ�on will be relaᣊ�ve to the Earth.
Scalar and Vector Quan뙕뙕es
In physics, quanᣊ�ᣊ�es can be scalar or vector. The
difference between the two lies in direcᣊ�on.
Scalar quanᣊ�ᣊ�es include magnitudes, which are numerical
measurements. The distance an
object has traveled or the speed of an object is a scalar quanᣊ�
ty. Scalars do not take direcᣊ�on
into consideraᣊ�on and can be described with only a number a
nd a unit. For example,
somebody might say the temperature outside is 70°F. Seventy is
the magnitude, and
Fahrenheit is the unit; there is no direcᣊ�on associated with th
e quanᣊ�ty. Vector quanᣊ�ᣊ�es, on
3. the other hand, include magnitude and direcᣊ�on. The displace
ment from an object's iniᣊ�al
posiᣊ�on, velocity, and acceleraᣊ�on are vector quanᣊ�ᣊ�e
s. The direcᣊ�on of vectors can be
described as being in the posiᣊ�ve direcᣊ�on, in the negaᣊ�v
e direcᣊ�on, north, south, east, west,
leĀ, right, up, down, etc. One might describe an airplane's veloc
ity as 450 miles per hour due
west where both magnitude and direcᣊ�on are given. It is impo
rtant to disᣊ�nguish between
scalar and vector quanᣊ�ᣊ�es when trying to understand kine
maᣊ�cs.
Speed, Velocity, and Accelera뙕on
You may be familiar with speed outside of the physics classroo
m. When you drive in a car you
are traveling a distance over a certain amount of ᣊ�me: a speed
. How then is velocity different
from speed? Velocity (v) is a vector quanᣊ�ty described as the
rate at which an object's
posiᣊ�on changes divided by the ᣊ�me the object is in moᣊ�
on. Furthermore, the rate of change
in velocity plays an important role in physics. Accelera뙕on repr
esents the rate of change of an
object's velocity over ᣊ�me.
Speed, Average Velocity, and Average Accelera뙕on
Before we define speed, velocity, and acceleraᣊ�on, it is
important to disᣊ�nguish between distance and
displacement. Distance is how much “ground” an
object has covered; whereas, displacement is how far
an object has moved from its original posiᣊ�on. The
total change in an object's distance over ᣊ�me is
referred to as average speed. Distance and speed are
4. scalar quanᣊ�ᣊ�es. The average change in an object's
displacement over ᣊ�me is referred to as average
velocity, and the average change in an object's velocity
over ᣊ�me is referred to as average acceleraᣊ�on.
Displacement, velocity, and acceleraᣊ�on, as menᣊ�oned
before, are vector quanᣊ�ᣊ�es. When you are calculaᣊ�ng
the average velocity or acceleraᣊ�on of an object, you
1/4/2017 Lab 2: Kinematics
https://moodle.straighterline.com/pluginfile.php/72219/mod_res
ource/content/17/CourseRoot/html/lab004s001.html 3/20
Figure 3: Diagram showing the average
speed of a car. Speed is scalar.
Figure 4: Diagram showing the velocity of a
car.
are actually finding the slope of the line secant to the path betw
een the two points in ᣊ�me
(Figure 2).
Example 1: Speed
A car travels a distance of 800 meters over a ᣊ�me of
10 seconds. The car has an average speed of 80
meters per second (Figure 3).
Speed AVG =
distance
=
800 m
5. =
80 m
= 80 m/s
뙕me 10 s s
Example 2: Velocity
A car travels at 800 meters west. The car makes a U‐
turn and travels a distance of 800 meters east. It took
the car 20 seconds to complete its course. The
average velocity of the car is 0 meters per second
(Figure 4) because the car travels in opposite
direcᣊ�ons that cancel each other out.
VelocityAVG(vAVG) =
Δdisplacement
=
800 m + (‐800) m
=
0 m
= 0 m/s
뙕me 20 s 20 s
Even though the car experienced a lot of moᣊ�on in 20 seconds
, its posiᣊ�on did not change
over the course of its moᣊ�on.
Example 3: Accelera뙕on
A car travels from 0 m/s to 90 m/s in 15 seconds.
The car has an average acceleraᣊ�on of 6 m/s2.
6. Accelera뙕onAVG(aAVG) =
Δvelocity
=
90 m/s
=
6 m/s
= 6 m/s2뙕me 15 s s
Example 4: Instantaneous Velocity
A car is moving along a path whose displacement can be modele
d by funcᣊ�on x(t) = 2.0 m +
(4.0 m/s2)t2 (Figure 5‐leĀ). The car's velocity is the derivaᣊ�v
e of its displacement, v(t)= (8.0
m/s2)t (Figure 5‐right). The instantaneous velocity of the car at
3 seconds is 24 m/s.
1/4/2017 Lab 2: Kinematics
https://moodle.straighterline.com/pluginfile.php/72219/mod_res
ource/content/17/CourseRoot/html/lab004s001.html 4/20
Figure 5: The car's displacement over a period of ᾷme is graphe
d to the le뎌. The car's velocity over a period if
ᾷme is graphed to the right.
Displacement = x(t) = 2.0 m + (4.0 m/s2)t2
Velocity = (d/dt) x(t) = v(t) = (8.0 m/s2)t
7. v(3) = (8.0 m/s2) (3.0 s) = 240 m/s
Example 5: Instantaneous Accelera뙕on
A car is moving with a velocity that can be modeled by the func
ᣊ�on v(t)= (8.0 m/s2)t. The
car's acceleraᣊ�on is the derivaᣊ�ve of the velocity, a(t)= 8.0
m/s2 (Figure 6). The instantaneous
acceleraᣊ�on of the car at any point in ᣊ�me is 8.0 m/s2 beca
use in this case acceleraᣊ�on is not
dependent on ᣊ�me. In other words, the acceleraᣊ�on is const
ant. For example, the
acceleraᣊ�on at 5 seconds is 8.0 m/s2.
1/4/2017 Lab 2: Kinematics
https://moodle.straighterline.com/pluginfile.php/72219/mod_res
ource/content/17/CourseRoot/html/lab004s001.html 5/20
Figure 6: Acceleraᾷon over ᾷme of the car.
Velocity = v(t) = 8.0 m/s2)t
Accelera뙕on = (d/dt) v(t) = (8.0 m/s2)
α(5) = (8.0 m/s2)
Graphing 1‐D Mo뙕on
In science, we observe how one factor changes as a result of a c
hange in another. The effect
of one variable on another can be expressed as a funcᣊ�on. An
alternaᣊ�ve to using equaᣊ�ons
to describe moᣊ�on is to uᣊ�lize moᣊ�on graphs to visualize
8. the same relaᣊ�onships.
When we look at the speed vs. ᣊ�me graph of an object in free
fall (Figure 7), we observe a
linear relaᣊ�onship. In other words, for every increase in ᣊ�m
e, there is the same increase in
speed. Since the object is dropped from rest, the line starts at th
e origin (0,0). Since this
parᣊ�cular curve is a straight line, we know the slope (Δy/ Δx)
of the line is constant. On this
graph, the slope of the line represents acceleraᣊ�on. The steep
er the curve (the line) is, the
greater the acceleraᣊ�on. From the data presented here we kno
w that the acceleraᣊ�on
pictured in Figure 7 is constant.
Examining the curves on a velocity vs. ᣊ�me graph provides in
formaᣊ�on about the direcᣊ�on,
speed and acceleraᣊ�on of the moving object. Take a look at th
e series of linear moᣊ�on graphs
in Figure 7 and how they are interpreted.
Understanding the meaning of the shape and slope of a distance
vs. ᣊ�me graph is essenᣊ�al to
your understanding of linear moᣊ�on. Whether it's the speed or
direcᣊ�on that is changing, the
rate of acceleraᣊ�on will greatly influence the path of moᣊ�o
n. From driving your car to
1/4/2017 Lab 2: Kinematics
https://moodle.straighterline.com/pluginfile.php/72219/mod_res
ource/content/17/CourseRoot/html/lab004s001.html 6/20
9. shooᣊ�ng a gun, these concepts apply to many situaᣊ�ons enc
ountered in everyday life. Explore
the world around you and see how many applicaᣊ�ons of linear
moᣊ�on you can idenᣊ�fy!
Figure 7: Linear moᾷon graphs.
The Kinema뙕c Equa뙕ons
When you are at a red light and the light turns green, you hit the
gas acceleraᣊ�ng your car up
to the speed limit. During the period of ᣊ�me your foot is on th
e gas, your acceleraᣊ�on is close
to constant. This is the case for many different types of moᣊ�o
n. From interpreᣊ�ng the 1‐D
moᣊ�on graphs, acceleraᣊ�on is equal to the slope of velocity
versus ᣊ�me graphs: a = dv/dt.
Uᣊ�lizing calculus, the first kinemaᣊ�c equaᣊ�on can be der
ived using the following process:
(dv/dt) = a
(dv) = a ∙ dt
Integrate both sides of the equaᣊ�on.
∫ dv = ∫ a ∙ dt
∫ dv = a ∫ dt
If a is constant, it comes out of the integral.
v = at + C
The constant of integraᣊ�on is equal to the iniᣊ�al velocity at
ᣊ�me zero. The resulᣊ�ng equaᣊ�on
10. is the first kinemaᣊ�c equaᣊ�on.
vf = vo + at
1/4/2017 Lab 2: Kinematics
https://moodle.straighterline.com/pluginfile.php/72219/mod_res
ource/content/17/CourseRoot/html/lab004s001.html 7/20
Another integraᣊ�on results in the next kinemaᣊ�c equaᣊ�on
.
df = do + vot + ½at
2
These equaᣊ�ons are used to solve for the instantaneous posiᣊ
�on, velocity, or acceleraᣊ�on of
an object. They each relate two different variables and are sum
marized as the following:
df = d0 + v0t + ½ at
2 Relates distance and 뙕me
vf = v0 + at Relates velocity and 뙕me
vr
2= v0
2 + 2ad Relates velocity and displacement
where:
d is displacement which is equal to df ‐ d0
t is the amount of ᣊ�me the object is in moᣊ�on (s)
11. vf is the final velocity (m/s)
v0 is the iniᣊ�al velocity (m/s)
a is the acceleraᾷon (m/s2)
d0 is the iniᾷal posiᾷon (m)
df is the final posiᾷon (m))
Many equaᣊ�ons can be derived from the general equaᣊ�ons t
o find the above variables under
different condiᣊ�ons as long as all variables except the one bei
ng solved for are known. Let's
take a look at some examples. If the iniᣊ�al velocity of the obj
ect is equal to 0 m/s and iniᣊ�al
posiᣊ�on is equal to 0 m, the kinemaᣊ�c equaᣊ�ons simplify
to:
vf = at
df = ½ at
2
The following equaᣊ�on is useful to find the displacement an o
bject travels when gravity is the
only force acᣊ�ng on the object and the ᣊ�me is known. The a
cceleraᣊ�on of gravity, g, on earth
is about 9.8 m/s2:
d = ½ gt2
Click to Run
http://phet.colorado.edu/sims/moving-man/moving-man_en.jnlp
1/4/2017 Lab 2: Kinematics
12. https://moodle.straighterline.com/pluginfile.php/72219/mod_res
ource/content/17/CourseRoot/html/lab004s001.html 8/20
Figure 8: Skydivers experience free‐fall. To reduce the
effects of air resistance, skydivers orient their bodies
perpendicular to the ground. By doing this, they are
able to reach a terminal velocity of about 120 mph!
Accelera뙕on and Gravity
Gravity causes objects to accelerate
downward when falling. In reality, air
resistance decreases the effects of gravity on
the acceleraᣊ�ng objects unᣊ�l it balances the
force of gravity and there is no longer a
change in velocity — when the object reaches
its terminal velocity (Figure 8). However, when
we study linear moᣊ�on, it is convenient to
neglect air resistance and focus only on the
acceleraᣊ�on due to gravity (g), a state called
freefall. In all cases of free fall, g (9.8 m/s2) is
the acceleraᣊ�on due to the force of gravity
that can act in a posiᣊ�ve way by increasing the
speed of the object or negaᣊ�vely by
decreasing the speed. Thus, for every second
of free fall there is a change in velocity of approximately 10 m/
s. This leads us to the equaᣊ�on
for the acceleraᣊ�on of a falling object:
vf = gt
where v is the final velocity (m/s), g is the acceleraᣊ�on due to
gravity (9.8 m/s2), and t is the
elapsed ᣊ�me (s). Thus, velocity is a funcᣊ�on both of acceler
aᣊ�on and of how long the object is
acted on by that force.
13. Gravity is also responsible for slowing down an object thrown s
traight up into the air and
acceleraᣊ�ng it back to Earth. In fact, the object reaches a poin
t of zero velocity before it
changes direcᣊ�ons. This characterisᣊ�c behavior is typical o
f all mass in the presence of
gravity.
? Did You Know...
Physics is the study of how the world works. Currently, all
physics has been described by the interacᾷon of parᾷcles
in space at a certain ᾷme. We refer to this arena for
parᾷcles to interact and collide with each other "space‐
ᾷme". Recently, physicist a new kind of geometric shape
called the amplituhedron was discovered to simplify
calculaᾷons for colliding parᾷcles. Could this be the end
of "space‐ᾷme"?
Pictured to right: Amplituhedron
1/4/2017 Lab 2: Kinematics
https://moodle.straighterline.com/pluginfile.php/72219/mod_res
ource/content/17/CourseRoot/html/lab004s001.html 9/20
2‐D Kinema뙕cs
1/4/2017 Lab 2: Kinematics
https://moodle.straighterline.com/pluginfile.php/72219/mod_res
14. ource/content/17/CourseRoot/html/lab004s001.html 10/20
Projec뙕le mo뙕on takes into consideraᣊ�on objects that are mo
ving in two direcᣊ�ons at the
same ᣊ�me. Unlike linear moᣊ�on which only considers one d
irecᣊ�on, projecᣊ�le moᣊ�on
acknowledges both horizontal and verᣊ�cal moᣊ�on. Think ab
out two‐dimensional (2‐D)
moᣊ�on as two, independent, one‐dimensional (1‐D) moᣊ�ons
. The path of an object with
projecᣊ�le moᣊ�on can be described as curved. This is where
the concept of vectors comes into
play.
Vectors
As you learned previously, a quanᣊ�ty that
conveys informaᣊ�on about magnitude only is
called a scalar quanᣊ�ty. Vectors, like velocity,
describe magnitude and direcᣊ�on. Along with
detailing informaᣊ�on about the path of
moᣊ�on, vectors are also useful in physics
because they can be separated into
components.
An object with projecᣊ�le moᣊ�on has a velocity
that can be represented by a diagonal vector.
In Figure 9, the vector is labeled V. Vector V
can be resolved (broken down) into an
equivalent set of horizontal (x‐direcᣊ�on) and
verᣊ�cal (y‐direcᣊ�on) components, which are at
right angles to each other. The addiᣊ�on of the
components results in the magnitude of the
15. 1/4/2017 Lab 2: Kinematics
https://moodle.straighterline.com/pluginfile.php/72219/mod_res
ource/content/17/CourseRoot/html/lab004s001.html 11/20
Figure 9: A vector can be broken down into
horizontal and verᾷcal components.
vector.
Calcula뙕ng the x‐component of a Vector
cosθ = Vx
V
Vx = V (cosθ)
Calcula뙕ng the y‐component of a
Vector
sinθ = Vy
V
Vy = V (sinθ)
Calcula뙕ng Magnitude and Direc뙕on
Unit Vectors
Unit vectors are helpful when describing direcᣊ�on for proble
ms that are in two or more
dimensions. They provide informaᣊ�on about the components
of a vector and have a
magnitude of 1. The unit vector î is directed in the posiᣊ�ve x‐
direcᣊ�on, and the unit vector ĵ is
directed in the posiᣊ�ve y‐direcᣊ�on. To describe vectors by
components, one can use unit
vectors, as shown below.
16. Rx = Rxî
Rx describes the enᣊ�re x‐component of the vector, and Rx des
cribed the magnitude of the x‐
component.
Ry = Ryĵ
Combining the x‐ and y‐ components we can find the vector R:
R = Rx + Ry
R = Rxî + Ryĵ
1/4/2017 Lab 2: Kinematics
https://moodle.straighterline.com/pluginfile.php/72219/mod_res
ource/content/17/CourseRoot/html/lab004s001.html 12/20
Figure 10: The path of a projecᾷle in the absence of
air resistance is a perfect parabola. The horizontal
component of velocity is 10 m/s throughout the
object's moᾷon.
Posi뙕on Vectors
To describe an object's locaᣊ�on in space, we use the posiᣊ�o
n vector. It is the vector that
points from the origin to the object's posiᣊ�on in space at one i
nstant. The posiᣊ�on vector can
be wriĀen using unit vectors.
r = xî + yĵ
17. Just as we learned in 1‐D Kinemaᣊ�cs, an object's posiᣊ�on, a
verage velocity, instantaneous
velocity, average acceleraᣊ�on, and instantaneous acceleraᣊ�
on are all important in describing
an object's moᣊ�on through space. In 1‐D Kinemaᣊ�cs averag
e velocity was found by taking the
change in the object's displacement over a period of ᣊ�me. Thi
s is very similar to average
velocity in 2‐D Kinemaᣊ�cs. Instead of using the change in the
object's displacement, we use
the change in the object's posiᣊ�on vector over a certain amou
nt of ᣊ�me.
Instantaneous velocity in 1‐D Kinemaᣊ�cs was found by taking
the derivaᣊ�ve of the object's
displacement. For 2‐D Kinemaᣊ�cs, instead of displacement, w
e take the derivaᣊ�ve of the
object's posiᣊ�on vector in 2 dimensions.
Average acceleraᣊ�on in 2‐D Kinemaᣊ�cs is virtually the sam
e as it is in 1‐D Kinemaᣊ�cs. We take
the change in the object's velocity vector over a certain amount
of ᣊ�me.
Projec뙕le Mo뙕on
Typically, a projec뙕le is any object which,
once projected, conᣊ�nues in moᣊ�on by its
own inerᣊ�a and is influenced only by the
downward force of gravity. This may seem
counter‐intuiᣊ�ve since the object is moving
both horizontally and verᣊ�cally, but gravity
(an applied force) acts only on the verᣊ�cal
moᣊ�on of the object. The term iner뙕a
describes an object's resistance to external
18. forces which could affect its moᣊ�on (both
velocity or direcᣊ�onality). When there are no
external forces acᣊ�ng upon an object, it will
conᣊ�nue to travel in a straight line at a
constant, linear velocity.
As shown in Figure 10, the projecᣊ�le with horizontal and ver
ᣊ�cal moᣊ�on assumes a
characterisᣊ�c parabolic trajectory due to the effects of gravity
on the verᣊ�cal component of
1/4/2017 Lab 2: Kinematics
https://moodle.straighterline.com/pluginfile.php/72219/mod_res
ource/content/17/CourseRoot/html/lab004s001.html 13/20
? Did You Know...
Cannons on Navy ba᧻le
ships can fire at objects
that are farther than
fi뎌een miles away. The
curvature of the Earth
makes it impossible to
see that far in the
distance. That means
that the cannons fire
projecᾷles at objects
they cannot physically
see!
moᣊ�on. If air resistance is neglected, there are no horizontal f
orces acᣊ�ng upon the projecᣊ�le,
and thus no horizontal acceleraᣊ�on. It might seem surprising,
19. but a projecᣊ�le moves at the
same horizontal speed no maĀer how long it falls!
Since projecᣊ�le moᣊ�on can be resolved into two independe
nt direcᣊ�ons, 1‐D kinemaᣊ�c
equaᣊ�ons can be applied to both components of the moᣊ�on
separately. The kinemaᣊ�c
equaᣊ�ons will allow you to solve for different aspects of a pr
ojecᣊ�le's flight, its height
(verᣊ�cal), range (horizontal), and ᣊ�me of flight. Applying 1
‐D kinemaᣊ�cs results in two sets of
equaᣊ�ons for 2‐D moᣊ�on:
Height Range
yf = v0,yt ‐ 1/2gt
2 xf = v0,xt
vf,y = v0,y ‐ gt
vf,y
2= v0,y
2 ‐ 2gy
The x and y subscripts for velocity
refer to the component of velocity
in the x and y direcᣊ�on. These two
sets of equaᣊ�ons (height and
range) also incorporate ᣊ�me
because the ᣊ�me of flight for the
projecᣊ�le moᣊ�on is the same for both the verᣊ�cal and hor
izontal moᣊ�ons. Noᣊ�ce that there
is only one equaᣊ�on for range, while there are three equaᣊ�o
ns for height! This is due to the
fact there is no acceleraᣊ�on in the horizontal direcᣊ�on. You
20. may oĀen be required to find the
ᣊ�me of flight using the height equaᣊ�ons in order to determi
ne the range of the projecᣊ�le.
Click to Run
http://phet.colorado.edu/sims/motion-2d/motion-2d_en.jnlp
1/4/2017 Lab 2: Kinematics
https://moodle.straighterline.com/pluginfile.php/72219/mod_res
ource/content/17/CourseRoot/html/lab004s001.html 14/20
Figure 11: With air resistance, the trajectory looks like
a "squashed" parabola, and the range of the object's
flight is noᾷceably affected.
Launch Angle
If the projecᣊ�le is fired at an angle, the range
is a funcᣊ�on of the iniᣊ�al launch angle, θ, the
launch velocity and the force of gravity. Using
algebra, you can derive the following
expression from the kinemaᣊ�cs equaᣊ�ons:
R = v2 sin(2θ)
g
It is important to remember that in many
cases, air resistance is not negligible (Figure
11) and affects both the horizontal and verᣊ�cal
components of velocity. When the effect of air
resistance is significant, the range of the projecᣊ�le is reduced
and the path the projecᣊ�le
21. follows is not a true parabola.
1/4/2017 Lab 2: Kinematics
https://moodle.straighterline.com/pluginfile.php/72219/mod_res
ource/content/17/CourseRoot/html/lab004s001.html 15/20
Circular Mo뙕on
1/4/2017 Lab 2: Kinematics
https://moodle.straighterline.com/pluginfile.php/72219/mod_res
ource/content/17/CourseRoot/html/lab004s001.html 16/20
Figure 12: Diagram of the relaᾷonship between ᾷme
period, velocity and radius during circular moᾷon.
Imagine you are driving in a car with the steering wheel turned
so that the car follows the
path of a perfect circle. If the speedometer read the same speed
the whole ᣊ�me, the moᣊ�on
of the car would be described as uniform circular mo뙕on.
Uniform Circular Mo뙕on
Uniform circular moᣊ�on is the moᣊ�on of an
object in a circle with constant speed, when
the object covers the same distance in each
instant of ᣊ�me.
Recall that the average speed is equal to the
distance traveled divided by the ᣊ�me. For one
22. revoluᣊ�on in a circle the distance traveled is
equal to the circumference of a circle. The
ᣊ�me to make one revoluᣊ�on is called a period.
The equaᣊ�on to find the average speed of an object traveling i
n uniform circular moᣊ�on is:
Vavg = 2πr
T
where T is the ᣊ�me period, and r is the radius of the circular p
ath the object travels. As the
radius increases, velocity increases. For example, imagine four
spherical objects moving in a
uniform circular path around a staᣊ�onary point (Figure 12). E
ach ball has the same ᣊ�me
period because they move around the circle in the same amount
of ᣊ�me, but the speed at
1/4/2017 Lab 2: Kinematics
https://moodle.straighterline.com/pluginfile.php/72219/mod_res
ource/content/17/CourseRoot/html/lab004s001.html 17/20
Figure 13: The change in velocity (Δv) is shown
in the small diagram to the right, and is the
sum of the two velocity vectors v1 and v2.
which each ball moves differs. As the radius gets larger, the spe
ed also increase in order to
cover greater distance in the same amount of ᣊ�me as the other
objects.
? Did You Know...
23. The word centripetal stems from the La뙕n meaning "toward cen
ter".
Centripetal Accelera뙕on
Newton's First Law states that an object in
moᣊ�on will stay in moᣊ�on unless acted on by
an external force. Figure 13 depicts an object
moving in a circular moᣊ�on at a constant
speed. We see that the direcᣊ�on of the
velocity vector is changing as the object
travels around the circular path. Therefore,
there must be an acceleraᣊ�on causing the
mass to change direcᣊ�on. What is the
direcᣊ�on of this acceleraᣊ�on? Average
acceleraᣊ�on is calculated by dividing the
change in velocity by ᣊ�me, so the acceleraᣊ�on is in the sam
e direcᣊ�on as the change in
velocity which is toward the center of the circle! This acceleraᣊ
�on is called centripetal
accelera뙕on. No maĀer what two velocity vectors you choose, t
he acceleraᣊ�on vector is
always perpendicular to the tangenᣊ�al velocity toward the cen
ter of rotaᣊ�on. Thus, an object
in circular moᣊ�on can always be thought of as acceleraᣊ�ng
toward the center of the circle,
even though the radius of rotaᣊ�on remains constant. The mag
nitude of centripetal
acceleraᣊ�on can be expressed in terms of the linear velocity a
nd the radius of rotaᣊ�on:
ac = v
2
R
24. The force causing centripetal acceleraᣊ�on is just large enough
to keep the object in its circular
path. This centripetal force for uniform circular moᣊ�on alters
the direcᣊ�on the object is
traveling in, but not the speed. Just like linear moᣊ�on, force i
s a measure of the mass in
moᣊ�on mulᣊ�plied by its acceleraᣊ�on. The magnitude of t
he force is related to the
acceleraᣊ�on of the object through the following relaᣊ�onshi
ps based on Newton's Second Law
of Moᣊ�on:
Click to Run
http://phet.colorado.edu/sims/rotation/rotation_en.jnlp
1/4/2017 Lab 2: Kinematics
https://moodle.straighterline.com/pluginfile.php/72219/mod_res
ource/content/17/CourseRoot/html/lab004s001.html 18/20
Figure 14: Swings at an amusement park
exhibit a circular path of moᾷon (white line).
Figure 15: Banked turns keep
cyclists from being pushed off a
track.
Let's analyze a real world example of centripetal
moᣊ�on. The seats on a swinging ride at an
amusement park twirl around the rotaᣊ�ng central
pole, and their moᣊ�on is described as a circle (Figure
14). The seats are connected to a chain, which
25. provides an (inward) centripetal force to keep the
swings from flying off in a straight line. Increasing the
velocity of rotaᣊ�on forces the chain out at a wider
angle to the point where the horizontal component of
its tension provides the necessary centripetal force
inward. Meanwhile, the verᣊ�cal component of the
tension must balance out the force of gravity
downward.
If you have ever been on a rotaᣊ�ng merry‐go‐round, you
have probably felt as if something is pulling toward the
outside edges, forcing you to hold onto the bar to keep you
from falling off. A common word that is oĀen used when
discussing circular moᣊ�on is centrifugal force (center fleeing)
,
which is the "ficᣊ�ᣊ�ous" force that seems to push a rotaᣊ�n
g
object away from the center of rotaᣊ�on. The aspects of this
"force" are really a misconcepᣊ�on: what you are feeling is the
centripetal force exerted by the bar to keep you from
traveling in a direcᣊ�on tangent to the rotaᣊ�on. The
centrifugal force is "felt" when the bar pulls you inward,
giving you the impression that a force is pushing you
outward. If you let go of the merry‐go‐round, your inerᣊ�a
(remember Newton's First Law) will keep you moving in a
direcᣊ�on tangent to the rotaᣊ�on (which is a straight line in
the direcᣊ�on of your velocity at that very moment), not
outward. To prevent this from occurring during sports
involving circular tracks and even on highways, the turns are ba
nked or inclined. This bank
provides a normal force on the object, which is perpendicular to
the track surface. The
horizontal component of the normal force plus the horizontal co
mponent of the force of
fricᣊ�on between the ᣊ�res and track are the source of centrip
26. etal force inward. If the angle of
the track and the speed of the vehicle are just right, no sideways
fricᣊ�on forces are required
to turn on the track (Figure 15).
Angular Mo뙕on
Consider a mass moving at a constant speed in a circular
path. Since the mass is not moving in a straight line, its
posiᣊ�on is described as the angle, θ, from the x‐axis or
angular posi뙕on (Figure 16). Angular posiᣊ�on is
1/4/2017 Lab 2: Kinematics
https://moodle.straighterline.com/pluginfile.php/72219/mod_res
ource/content/17/CourseRoot/html/lab004s001.html 19/20
Figure 16: A dark gray mass is moving in
a circular path at radius, R, and has
traveled an arc length of l.
expressed in radians (instead of degrees) and is related
to arc length, l, and the radius, R, of a circular path.
Rθ(rad) = l
Angular posiᣊ�on is posiᣊ�ve when measured
counterclockwise and negaᣊ�ve when measured
clockwise.
The arc length of a complete circle is equal to the
circumference (2Πr) and there are 360° in a complete
circle. Therefore, you can convert back and forth
27. between degrees and radians using the equaᣊ�on:
360° = 2πr rad
In linear moᣊ�on, velocity is an object's change in posiᣊ�on
divided by the ᣊ�me the object is in moᣊ�on:
△ d / △t
In circular moᣊ�on, angular velocity is the amount of rotaᣊ�o
n or revoluᣊ�on per unit of ᣊ�me.
Average angular velocity, ωavg, is the number of radians per se
cond (rad/s) over a period of
ᣊ�me and instantaneous angular velocity, ω, is the number or r
adians over an infinitesimal
period of ᣊ�me:
Average: ωavg = △ϑ / △t
Instantaneous: ω = dθ / dt
Average angular velocity can also be calculated by measuring th
e period of mo뙕on, P, which
is the amount of ᣊ�me it takes an object to make one full revol
uᣊ�on. Angular velocity is
mathemaᣊ�cally related to period as:
ωavg = 2πr / P
When an object rotates at a fixed radius, R, its linear velocity at
a given instant is always
tangent to its circle of rotaᣊ�on. For this reason, the term tang
enᣊ�al velocity refers to the
linear velocity of a rotaᣊ�ng object (as opposed to angular vel
ocity). A tangent line is one that
touches the circle at one point, but never intersects it. Therefore
29. Lab 2/Lab2Kinematics.docx - Copy.docx
Lab 2 Kinematics PHY250L”
Student Name:
Kit Code (located on the lid of your lab kit): AC-65CS487
“Pre-Lab Questions”
1. “What is the acceleration of a ball that is vertically tossed up
when it reached its maximum height?”
0
“
2. “The displacement of a particle as it varies with time is given
by the equation
x(t) = (10.0 m/s) t + (2.50 m/s²) t². Find the particle’s
instantaneous velocity and instantaneous acceleration at t = 4.00
seconds.”
Click here to enter text.
3. “What does a positive and negative slope represent for a
velocity vs. time graph?”
This exemplifies an increase when positive and a decrease when
negative of an object's velocity in respect to time.
4. “You know that a car moves with a velocity that can be
modeled as v(t)= 4.0 m/s + (1.2 m/s²)t and that at t = 0 the car
has a displacement of 5.00 meters from the origin. What is the
position of the car at t = 4.0 seconds?”
Click here to enter text.
5. “Derive the second kinematic equation by integration of the
first kinematic equation. Then derive the third kinematic
equation by using algebra to combine the first and second
kinematic equations.”
Click here to enter text.
“Experiment 1: Distance of Free Fall”
30. “Table 1: Washer Free Fall Data”
“Trail”
“Drop Height (m)”
“Time (s)”
“1”
4.2 Meters
1.0
“2”
.88
“3”
.95
“Average”
.9433
“Description of Auditory Observations of Equally Spaced Hex
Nuts:” Consistent sound
“Description of Auditory Observations of Unequally Spaced
Hex Nuts:” Inconsistent sound
“Post-Lab Questions”
1. “Record your hypothesis from Step 1 here. Use evidence from
your results to explain if your hypothesis was supported or not.”
Varying distances will have a direct correlation with time. The
shorter the distance the smaller the value of time will be. Vise
versa also applies, the longer the distance, the larger the value
of time will be. I have observed this during the first exercise.
2. “What was the difference between the noise patterns for
equally spaced hex nuts compared to the unequally spaced hex
nuts?”
The equally spaced hex nuts gave off a consistent sound pattern,
31. while the inconsistently spaced hex nuts were the opposite, and
let off a sporadic sound pattern.
3. “If the noise patterns were different, explain why. If they
were similar, explain why.”
The sound was different on the unequally spaced nuts, due to
the less distance in between each nut. This cause a shorter time
period in which there wasn’t any sound produced, until the next
nut hit the floor.
4. “Using the time it took a single hex nut to reach the pan,
calculate the height from which it was dropped. Is this accurate
compared to your known height? Explain your conclusion.”
The time in which I had used the stopwatch to calculate the
drop distance was 1 second flat. This gave me a calculation of
4.9 Meters, or roughly 16 ft. In comparison to the actual
measurement of 13.9 ft or 4.2 meters, this is very close.
5. “A student ran this experiment, and instead of dropping the
hex nut, he threw it. This gave the nut a velocity of v(t) = (12
m/s²)t + 5 m/s. What is the hex nut’s displacement as a function
of time if its position at t = 0 seconds is 0 meters? If the hex nut
dropped 1.2 meters, how long did it take for the nut to reach the
ground?”
Click here to enter text.
“Experiment 2: Distance Traveled by a Projectile”
“Pre-Lab Questions”
1. “In one of your experiments, you will roll a marble down a
ramp to provide an initial horizontal velocity. Suppose you start
the marble at rest (v˳= 0 m/s) and it travels a distance of, d,
down the ramp. Use 1-D kinematics to predict the velocity of
the ball (vᶠ) at the bottom of the ramp. Hint: the acceleration of
the ball down the ramp is 9.81*sin(θ) m/s² where θ is the angle
of the ramp. Record your answer in variables (you will calculate
the velocity with magnitudes when you perform the
32. experiment).”
Click here to enter text.
2. “Use the kinematic equations to derive a general equation for
the time it takes a ball dropped from rest at vertical height, h, to
reach the ground. Use this to write a general equation for the
distance travelled by a projectile that is rolling off a table of
height, h, with a horizontal speed of V˳ₓ.” Click here to enter
text.
3. “Prove that launching a projectile at 45° provides the largest
range. Write the range as a function of θ. Take the derivative of
the range with respect to θ and find the maximum angle.”
Click here to enter text.
4. “A butterfly flies along with a velocity vector given by v =
(a-bt²) Î + (ct) ĵ where a=1.4 m/s, b=6.2 m/s³, and c=2.2 m/s².
When t= 0 seconds, the butterfly is located at the origin.
Calculate the butterfly’s position vector and acceleration vector
as functions of time. What is the y-coordinate as it flies over x
= 0 meters after t = 0 seconds?”
Click here to enter text.
“Data:”
“Table 1: Range and Velocity of Projectile at Ramp Distance 1”
“Ramp Incline (degrees):” 25
“Ramp Distance (m):”33.5
“Trial”
“Measured Distance (m)”
“1”
42.5
“2”
41.5
“3”
41.
“4”
42.25
33. “Average”
41.8
“Table 2: Range and Velocity of Projectile at Ramp Distance 2”
“Ramp Distance (m):” 28.5
“Trial”
“Measured Distance (m)”
“1”
35.8
“2”
37
“3”
37.6
“4”
36.5
“Average”
36.7
“Table 3: Range and Velocity of Projectile at Ramp Distance 3”
“Ramp Distance (m): “23.5
“Trial”
“Measured Distance (m)”
“1”
32.5
“2”
32.5
“3”
33.3
“4”
33.5
“Average”
32.95
“Post-Lab Questions:”
5. “Use your predictions of velocity and range from the Pre-Lab
Questions and the data recorded from your experiment to
34. complete Table 4.”
“Table 4: Velocity and Range Data for all Ramp Distances”
Ramp Distance (m)
Calculated velocity (m/s)
Predicted Range (m)
Average Actual Range (m)
Percent Error
Click here to enter text.
6. “How do your predictions compare to the observed data?
Explain at least two reasons for differences.”
Click here to enter text.
7. “If you were to fire a paintball pellet horizontally and at the
same time drop the same type of paintball pellet you fired from
the paintball gun, which pellet would hit the ground first and
why is this so?”
They would both come into contact with the ground at the same
exact time. They both experience the same amount of downward
air resistance, therefore they both are approaching the ground at
the same exact rate.
35. 8. “A marble slides down a wacky ramp with a velocity given
by v = (0.5t²-3.0t) Î + (0.33t³-0.6t) ĵ. At t = 3 seconds the
particle is shot off the ramp and behaves like a projectile. What
is the magnitude of the velocity of the marble when it leaves the
ramp? What is the marble’s acceleration vector while it is on
the ramp? If the marble falls for 6 seconds when it is shot off
the ramp at a 45° angle, what will be its displacement in the x-
direction?”
Click here to enter text.
“Insert photo of your experimental setup with your name clearly
visible in the background:”
“Experiment 3: Squeeze Rocket™ Projectiles”
“Table 5: Projectile Data for Rockets and Different Launch
Angles”
Launch Velocity (m/s)
Initial Angle
Time (s)
Average Time (s)
Predicted Range (m)
Actual Range (m)
Average Range (m)
Range % Error
0.5
“90°”
1.34
1.42
1
.67
.905
40. 2
2.48
48
60
1.22
2
2.25
25
60
1.36
2
2.1
10
“Post-Lab Questions:”
1. “Which angle provides the greatest range? Which provides
the least? Based on your results, which angle should give you
the greatest ranged for projectile motion?”
The lower the angle the further the range as exemplified by the
data. The angle at which the projectile is launched has a direct
41. result on the distance at which it will travel.
2. “What role does air resistance play in affecting your data?”
Air resistance plays a huge role in the above data because of the
mass of the object itself. If the projectile had been more dense I
wouldn’t see the projectile sidewind as much as it did, however
it would take a bit more initial force to launch the projectile.
3. “Discuss any additional sources of error, and suggest how
these errors could be reduced if you were to redesign the
experiment.”
As stated above I would use an object more dense in structure,
due to the motion at which the projectile traveled during the
experiment this leaves room for some inconsistencies.
4. “How could kickers on a football team use their knowledge of
physics to better their game? List at least two other examples in
sports or other applications where this information would be
important or useful.”
A kicker on a football game could use knowledge of what angle
to kick the football at to make a precise kick in the field goal,
this way he could find exactly at what power and angle to kick
the ball at for the desired distance to the field goal. Another
practical use would be in golf. Having the ability to gauge
power, and angle for the desired distance in order make it onto
the putting green, or even a hole in one could be powerful.
5. “A student buys a high powered toy rocket gun and tries to
do this experiment. He decides to shoot the first rocket with an
initial angle of 0 degrees. The student knows that the rocket has
an initial velocity of 5 m/s when he shoots it off of the 3 meter
high table. The toy gun is able to give the rocket a horizontal
acceleration of (2.1 m/s³)t in the same direction as the initial
velocity. The vertical acceleration, directed downwards, is g.
Assume air resistance can be ignored. What is the horizontal
42. displacement of the student’s toy rocket?”
3 meters
“Experiment 4: Balancing Centripetal Force”
“Pre-Lab Questions:”
1. “In this lab, you will be rotating a mass on one side of a
string that is balanced by a second mass on the other end of the
string (Figure 5). Apply Newton’s Second Law of Motion to
mass 1, m₁, and mass 2, m₂, to solve for the period of mass 1.
Hint: assume m₁ = 4m₂. How is the centripetal force on m₁
related to the force of gravity on m₂.”
The centripetal force negates and counteracts the forces of
gravity on the end with more washers.
2. “Draw a free body diagram and solve for the centripetal
acceleration in terms of θ and g for one person riding on the
amusement ride in Figure 3.”
Click here to enter text.
3. “The wheel of fortune is 2.6 meters in diameter. A contestant
gives the wheel an initial velocity of 2 m/s. After rotating 540
degrees, the wheel comes to a stop. What is the angular
acceleration of the wheel?”
Click here to enter text.
4. “The angle that a spoke on a bicycle wheel has rotated
behaves according to function θ(t) = at² + bt where a = 0.6
rad/s² and b = 0.3 rad/s. Find the angular velocity of the spoke
as a function of time and the angular acceleration as a function
of time. Then find the instantaneous angular velocity and the
instantaneous angular acceleration at t = 3 seconds.”
Click here to enter text.
“Data:”
“Table 1: Rotational Data”
Radius (m)
Time per 15 revolutions (s)
43. “Period (s)”
Expected Value
Percent Error (%)
“0.25”
5.96
.397
.5
10.3
“0.40”
7.6
.51
.75
24
“0.15”
4.94
.33
.4
7
“Post-Lab Questions:”
5. “Compare your measured data to your predicted values with a
percent error calculation. Explain any difference with an error
analysis.”
Click here to enter text.
6. “Draw a circle to represent the path taken by your rotating
mass. Place a dot on the circle to represent your rotating
washer. Add a straight line from the dot to the center of the
circle, representing the radius of rotation (the string). Now label
the direction of the tangential velocity and the centripetal
force.”
Insert photo of the circle with your name clearly visible in the
background:
7. “Use your data to calculate the average velocity, angular
velocity, and centripetal acceleration for the mass in each
44. radius.”
Click here to enter text.
8. “Refer to the picture in Figure 3 again (picture in Pre-Lab
question #2). Before the apparatus begins to spin, the wires
connecting the swings to the top of the structure will be
completely vertical. Once the apparatus begins to spin the
swings move outward radially, but also upwards vertically.
From where does the force causing this vertical acceleration
come?”
Click here to enter text.
9. “Refer to the picture in Figure 3. Imagine that the swings are
rotating around the center with a constant speed, and the wire
connecting the swings to the center pole is at a 45 degree angle.
The angular velocity of the center pole is then doubled. Does
this mean that the chairs’ velocities will increase by a factor of
two, less than two, or more than two? Explain your reasoning.”
Click here to enter text.
10. “A uniform disc is rotating around a frictionless, vertical
axle that passes through its center has as radius of R=0.300m
and a mass of 25.0 kg. The disc rotates according to θ(t) = (2.20
rad/s²) t² + (5.63 rad/s) t. When the wheel has rotated 0.200 rev,
what is the resultant linear acceleration of any point on the
disc?”
Click here to enter text.
Lab 3/Lab 3- Newton's Laws.pdf
1/4/2017 Lab 3: Newton's Laws
https://moodle.straighterline.com/pluginfile.php/72226/mod_res
ource/content/5/CourseRoot/html/lab006s001.html 1/5
45. Learning Objec᧻ves
Formulate the law of iner᧻a
Relate force and accelera᧻on
Apply ac᧻on and reac᧻on pairs to forces
Draw and explain free body diagrams
Apply Newton's 2nd Law to the Atwood Machine
Introduc᧻on
The laws of physics that we know today were discovered and ha
ve been studied for centuries.
In the fourth century B.C. Aristotle proposed the general belief
that a force causes a constant
velocity. In addi᧻on to Aristotle, Isaac Newton, famous for his
Laws of Mo᧻on, based his work
on the discoveries and experiments of Galileo and Johannes Kep
ler. In order to reduce the
plague from spreading through the college where Newton was a
fellow, it was temporarily
closed. During this closure, Newton spent a few years in rela᧻v
e isola᧻on where he started to
1/4/2017 Lab 3: Newton's Laws
https://moodle.straighterline.com/pluginfile.php/72226/mod_res
ource/content/5/CourseRoot/html/lab006s001.html 2/5
Figure 1: The moĕon of moon as predicted
by Newton's First Law should follow the
46. doĥed path. Since the moon does not
follow the predicted path, there must be a
force acĕng on it.
formulate ideas on mathema᧻cs and physics. Newton was trying
to figure out what objects in
orbit and objects falling toward the Earth have in common. The
answer actually required a
new type of math: calculus! Newton formulated quan᧻ta᧻ve ex
plana᧻ons for the mo᧻on of
falling objects, orbi᧻ng objects, pulley systems, and much more
. These ideas were able to
explain all types of mo᧻on and can be broken down into three b
asic laws.
Force
While force can be described as a push or a pull, it is
more clearly defined as an ac᧻on that causes an object
to change its mo᧻on. Force is what causes the direc᧻on
of an object's velocity to change. Therefore, a net force
ac᧻ng on an object causes accelera᧻on.
Newton's First Law of Mo᧻on
Newton's First Law of Mo᧻on states that an object will
maintain its state of mo᧻on un᧻l acted upon by an
external force. In other words, an object will remain at
rest or move at a constant velocity un᧻l an outside
force acts upon it (Figure 1). Newton's First Law is also
called the Law of Iner᧻a. Iner᧻a is an object's tendency
to resist changes in mo᧻on (speed or direc᧻on). Ma台�er
has this property whether it is at rest or in mo᧻on.
When a net force on an object is applied, the object will acceler
ate in the direc᧻on of that
47. force. If the net force on the object equals zero then there will n
ot be a change in its
accelera᧻on. When discussing net force, the vector sum of the f
orces, the resultant, must be
examined.
The movement of planets around the sun is an example of iner᧻
a. Planets have a lot of mass,
and therefore a great amount of iner᧻a ‐ it takes a huge force to
accelerate a planet in a new
direc᧻on. The pull of gravity from the sun keeps the planets in
orbit; if the sun were to
suddenly disappear, the planets would con᧻nue at a constant sp
eed in a straight line,
shoo᧻ng off into space!
Vector Addi᧻on
Unlike addi᧻on of scalars, vector addi᧻on requires a geometric
al process where the tail of the
second vector is placed at the ᧻p of the first vector, �en refe
rred to as the tail to ᧻p method.
If an object is acted upon by force A and then by force B, it is s
ame as the object undergoing a
single force C (Figure 2). This value is known as the resultant o
r vector sum.
A + B = C
1/4/2017 Lab 3: Newton's Laws
https://moodle.straighterline.com/pluginfile.php/72226/mod_res
ource/content/5/CourseRoot/html/lab006s001.html 3/5
48. Figure 2: The addiĕon of vectors A and B to get
the resultant vector C.
Vectors can be broken up into components by using the proper᧻
es of right triangles
(discussed in Lab 5: 2‐D Kinema᧻cs and Projec᧻le Mo᧻on), an
d it offers a more general way
of adding vectors than the tail to ᧻p method. The x‐components
of each vector can be added
together, and the y‐components of each vector can be added tog
ether. Once we have both
the x‐ and y‐components, we can solve for the magnitude of the
vector by using the formula
|a| = √ax
2 + ay
2, for a general vector a. To get the direc᧻on of the vector you
can use Θ = tan‐
1 (ay/ax). This gives you the resultant of the forces ac᧻ng upon
an object. Finding the
resultant force, also known as the net force, is very important fo
r solving problems involving
Newton's Laws.
Mass vs. Weight
Newton observed a special rela᧻onship between mass and iner᧻
a. Mass is �en confused
with weight, but the difference is crucial in physics. While mass
is the measure of how much
ma台�er is in an object (how much stuff is there), weight is a m
easure of the force experienced
by an object due to gravity. Thus, weight is rela᧻ve to your loc
a᧻on. Your weight differs at the
Earth's core, the summit of Mount Everest, and especially in out
49. er space, when compared to
the Earth's surface. Conversely, mass remains constant in all the
se loca᧻ons. Mathema᧻cally,
weight, w, is the mass, m, of an object mul᧻plied by its acceler
a᧻on due to gravity, g:
w = mg
Newton's Second Law of Mo᧻on
Click to Run
http://phet.colorado.edu/sims/forces-and-motion-basics/forces-
and-motion-basics_en.jnlp
1/4/2017 Lab 3: Newton's Laws
https://moodle.straighterline.com/pluginfile.php/72226/mod_res
ource/content/5/CourseRoot/html/lab006s001.html 4/5
Newton also noted that the greater an object's mass, the more it
resisted changes in mo᧻on.
Therefore, he concluded that mass and iner᧻a are directly propo
r᧻onal: when mass
increases, iner᧻a increases. This predic᧻on produced Newton's
Second Law of Mo᧻on, an
expression for how an object will accelerate based on its mass a
nd the net force applied to
the object. This law can be summarized by the equa᧻on:
ΣF = ma
where ΣF is the sum of all forces ac᧻ng on the object, m is its
mass and a is its accelera᧻on.
The kilogram (kg) is the standard measurement for mass, and m
50. eter/second/second (m/s2) is
the standard measurement for accelera᧻on. The standard measur
ement for force is the
Newton, where 1 N = 1 kg∙m/s2. Comparing this equa᧻on to the
first one (w = mg) helps
reinforce the difference between mass and force (such as weight
).
Free body diagrams (as seen in Figure 3) are a useful tool for so
lving problems related to
Newton's Second Law of Mo᧻on. They allow you to iden᧻fy an
d draw all of the forces ac᧻ng
on an object. Objects can be represented by simple shapes like c
ircles and squares. Forces are
represented by solid arrows. It is helpful to visualize the net for
ce ac᧻ng on an object by
labeling all objects and forces included in the free body diagram
.
Since force and accelera᧻on are both vector quan᧻᧻es, Newton
's Second Law can be wri台�en
as a vector equa᧻on.
ΣF = ma
It can also be broken up into x‐ and y‐ components (for three di
mensional problems there is
also a z‐component).
ΣFx = max
ΣFy = may
Figure 3: Free body diagram of a block hanging form a beam by
a string.
51. Newton's Third Law of Mo᧻on
Newton's Third Law of Mo᧻on states that for
every ac᧻on (force) there is an equal and
1/4/2017 Lab 3: Newton's Laws
https://moodle.straighterline.com/pluginfile.php/72226/mod_res
ource/content/5/CourseRoot/html/lab006s001.html 5/5
Figure 3: Newton's Third Law of Moĕon explains why
you move backwards when you throw a ball on ice.
opposed reac᧻on. Imagine standing on an ice
ska᧻ng rink and holding a ball (Figure 3).
Ini᧻ally you are not moving. You throw a ball
and as you do, you start to move backwards
on the ice. When you exerted a force on the
ball it exerted a force on you equal in
magnitude and opposite in direc᧻on. Even
when you walk, you push against the ground,
and it pushes right back!
Newton's three laws of mo᧻on govern the
rela᧻onship of forces and accelera᧻on. There are many applica
᧻ons of Newton's Laws in your
everyday life. To get that last bit of ketchup from the bo台�le, y
ou shake the bo台�le upside‐
down, and quickly stop it (with the lid). Consider riding in a car
. Have you ever experienced
iner᧻a while rapidly accelera᧻ng? Thousands of lives are saved
every year by seatbelts, which
are safety restraints that protect against the iner᧻a that propels
a person forward when a car
53. 5. “An object is acted upon by a force that can be modeled by
F(t) = 5.6 N î + 2.4 N ĵ. The object has a mass of 3.0 kg and
starts at rest. Calculate the velocity v(t) as a function of time.”
Click here to enter text.
“Experiment 1: Graphing Linear Motion”
“Table 1: Motion of Water Observations”
“Motion”
“Observations”
“a”
water sloshed to one side
“b”
Water eventually remained at rest
“c”
Water sloshed to the left and then to the right
“d”
water sloshed forwards
“Table 2: Observations After Flicking Notecard Off of Cup”
“Trial”
“Observations”
“1”
Washer dropped to the bottom of the cup
“2”
Washer dropped to the bottom of the cup
“3”
Washer dropped to the bottom of the cup
“4”
Washer dropped to the bottom of the cup
“5”
Washer dropped to the bottom of the cup
“Post-Lab Questions”
1. “Explain how your observations of the water and washer
demonstrate Newton’s law of inertia.”
For the washer, the only force acting upon it is gravity, and
54. friction. The friction moved the washer slightly in the direction
the index card flew, but gravity overtook and brought the
washer to the bottom of the cup. For the water, the only forces
acting on the body of water was gravity and the edges of the
container.
2. “Draw a free body diagram of your containers of water from
the situation in Part 1 Step 4d. Draw arrows for the force of
gravity, the normal force (your hand pushing up on the
container), and the stopping force (your hand accelerating the
container as you stop). What is the direction of the water’s
acceleration?” Forward
“Insert photo of diagram with your name clearly visible in the
background:”
3. “Can you think of any instances when you are driving or
riding in a car that is similar to this experiment? Describe two
instances where you feel forces in a car in terms of inertia.”
When the brakes are applied abruptly. Your body remains in
motion as the vehicle slows down causing you to feel
constrained when the seatbelt slows your body down.
4. “You and your friend both preform 3b of Part 1 of this
experiment. You walk at 0.5 m/s, but your friend walks at 1.5
m/s. Which container of water will experience a greater net
force?”
My friends container will experience greater net force due to
the higher amount of intertia
“Experiment 2: Newton’s Third Law and Force Pairs”
“Table 3: Force on Stationary Springs”
“Force on Stationary 10 N Spring Scale (N)”
5
“Force on Stationary 5N Spring Scale (N)”
5
55. “Table 4: Spring Scale Force Data”
“Suspension Set Up”
“Force (N) on 10 N Spring Scale”
“Force (N) on 5 N Spring Scale”
“0.5 kg Mass on 10 N Spring Scale”
.5
“0.5 kg Mass with String on 10 N Spring Scale”
.5
“0.5 kg mass, string and 5 N Spring Scale on 10 N spring scale”
.8
.7
“0.5 kg mass, string and 5 N Spring Scale on 10 N spring scale
on Pulley”
.6
.7
“Post-Lab Questions”
1. “How did the magnitude of the forces on both spring scales
compare after you moved the 10 N spring scale?”
The forces acted upon each scale were the same.
2. “How did the magnitude of the forces on both spring scales
compare after you move the 5 N spring scale?”
The forces acted upon each scale were the same.
3. “Use Newton’s Third Law to explain your observations in
Questions 1 and 2.”
For each action there is an equal and opposite reaction. So each
force applied reacted to each scale equally.
4. “Compare the force on the 10 N spring scale when it was
directly attached to the 0.5 kg mass and when there was a string
between them.”
56. there was no difference in the amount of force, however there
was a slight increase due to the mass of the string itself.
5. “Compare the force on two spring scales in Steps 5 and 6.
What can you conclude about the tension in a strong?”
Tension on a string will eventually reach the point where it’s
taught, and hold the amount of weight that is applied to it.
6. “Olympic spring Usain Bolt set the world record in the 100
meter dash with a time of 9.58 seconds. The physics behind his
performance are impressive. Physicists have modeled his
position as a function of time to be as follows:”
“where A=110 m/s, B=12.2 m/s, k=0.9 1/s. Using this
information, find his acceleration when t = 0 seconds. If his
mass was 86 kg at the time of the race, what was his force at t =
0 seconds. What was the force from the ground on Bolt at t = 0
seconds?”
Click here to enter text.
“Insert photo of your experimental setup with your name clearly
visible in the background:”
“Experiment 3: Newton’s Third Law and Force Pairs”
“Table 5: Motion Data”
“Mass of 15 Washers (kg)”
.040
“Average of Mass of Washer (kg)”
.00266
“Procedure 1”
“Height (m):” .365
“Trial”
“Time(s)”
“1”
1.25
“2”
57. 1.13
“3”
1.09
“4”
1.06
“5”
1.31
“Average”
1.17
“Average Acceleration (m/s²)”
.266
“Procedure 2”
“Height (m):” .365
“Trial”
“Time(s)”
“1”
.78
“2”
.69
“3”
.66
“4”
.72
“5”
.65
“Average”
.7
“Average Acceleration (m/s²)”
.744
“Post-Lab Questions”
1. “Draw a free body diagram for M₁ and M₂ in Procedure 2.
Draw force arrows for the force due to gravity acting on both
masses (Fᵍ₁ and Fᵍ₂) and the force of tension (Fᵀ). Also draw
arrows indicating the direction of acceleration, a.”
58. “Insert photo of diagram with your name clearly visible in the
background:”
2. “Use Newton’s Second Law to write an equation for each of
the free body diagrams you drew in Question 1. Be sure to use
the correct signs to agree with your drawings. Solve these four
equations for the force of tension (Fᵀ). Your answer should be
written in variable form.”
Click here to enter text.
3. “Set the two resulting expressions for the force of tension
equal to one another (as long as the string does not stretch, the
magnitude of the acceleration in each equation is the same).
Replace Fᵍ₁ and Fᵍ₂ with M₁ and M₂, respectively. Solve the
resulting equation for a. Then, go back to Questions 2 and solve
for the Fᵀ.”
Click here to enter text.
4. “Calculate the acceleration for the two sets of data you
recorded and compare these values to those obtained by
measuring distance and time using percent error. What factors
may cause discrepancies between the two values?”
Click here to enter text.
5. “Calculate the tension in the string for the falling washers.
From these two values, and the one where the masses were
equal, what trend do you observe in the tension in the string as
the acceleration increases? Show all calculations.”
Click here to enter text.
6. “Using the theoretical acceleration found in Question 4 for
Procedure 1, find the velocity of the block as a function of time
by integration.”
Click here to enter text.
59. Lab 4/Lab 4- Friction.pdf
1/4/2017 Lab 4: Friction
https://moodle.straighterline.com/pluginfile.php/71010/mod_res
ource/content/5/CourseRoot/html/lab007s001.html 1/5
Learning Objec᧻ves
Explore and explain the difference between sta᧻c and kine᧻c fr
ic᧻on
Determine the dependence of the force of fric᧻on on the normal
force
Apply the force of fric᧻on to objects on an incline
Introduc᧻on
Newton's Laws of Mo᧻on can help iden᧻fy forces ac᧻ng on ob
jects that can not be seen with
the unaided eye and would go unno᧻ced without them. Fric᧻on
al force and normal force are
two forces that can be inferred from an object's mo᧻on or lack t
hereof.
Normal Force
1/4/2017 Lab 4: Friction
https://moodle.straighterline.com/pluginfile.php/71010/mod_res
60. ource/content/5/CourseRoot/html/lab007s001.html 2/5
Figure 1: Free body diagram
of an object at rest.
Figure 2: Surfaces have microscopic imperfec笕�ons
that contribute to fric笕�on.
When you place a book on a table, why doesn't it fall through
the table? The force due to gravity (Fg = mg) never stops
pulling down on the object, yet it remains sta᧻onary on the
table. Newton's Second Law states the net force on an object
must be zero if the object is at rest. Therefore, there must be
another force ac᧻ng on the object that is opposing the force
of gravity. We call this force the normal force (Figure 1).
Similar to tension, normal force is also passive and will only
push back as hard as the applied force. Another important
characteris᧻c is that the normal force only pushes (applies a
force) perpendicular to its surface.
Fric᧻on
Newton's First Law states that an object in
mo᧻on will remain in that state of mo᧻on
un᧻l an outside force acts on it. If you roll a
ball across the floor or slide a book across a
table, you will see them eventually come to
rest. Similar to normal force and gravity, there
seems to be another force at play that stops
the rolling ball. The force that opposes the
direc᧻on of mo᧻on and causes objects to come to rest is called
fric᧻onal force. Fric᧻on exits
between two solid surfaces no maᘀ er how smooth they may see
m to the naked eye. If you
zoom in on the surfaces, you will observe microscopic bumps th
61. at impede the mo᧻on of an
object (Figure 2). Unlike the normal force, the fric᧻onal force a
lways acts parallel to the
surface.
1/4/2017 Lab 4: Friction
https://moodle.straighterline.com/pluginfile.php/71010/mod_res
ource/content/5/CourseRoot/html/lab007s001.html 3/5
Sta᧻c vs. Kine᧻c Fric᧻on
An object does not always move when you exert a horizontal for
ce. For example, have you
ever tried pushing a car that has broken down and not been able
to get it in mo᧻on? Sta᧻c
fric᧻on keeps an object at rest. If you push with a greater force
and the mass s᧻ll has not
changed posi᧻on, sta᧻c fric᧻on increases. Once you push hard
enough to put the car in
mo᧻on, you have overcome the maximum amount that sta᧻c fri
c᧻on can push back. Sta᧻c
fric᧻on can be modeled by the inequality Ff ≤ μsFN, where Ff i
s the force of fric᧻on, μs is the
coefficient of sta᧻c fric᧻on, and FN is the normal force. The le
ss than or equal to sign
indicates that the force of sta᧻c fric᧻on can range from zero to
a maximum value. The mass
will begin to move on the surface once the applied force is great
er than μsFN,.
Once the object starts to move, an external force must be applie
d in order to keep the object
moving to overcome fric᧻on due to an object sliding over a surf
62. ace. This type of fric᧻on is
called kine᧻c fric᧻on. The equa᧻on for kine᧻c fric᧻on is Ff =
μkFN where μk is the coefficient
of kine᧻c fric᧻on. No᧻ce that this is an equa᧻on and not an in
equality. As long as a mass is
sliding across a surface, the force due to kine᧻c fric᧻on will st
ay the same. In order for a mass
to speed up, the applied force must be greater than the fric᧻ona
l force, otherwise it will slow
down. In order to maintain a constant velocity, the applied force
must be equal to the force of
kine᧻c fric᧻on.
1/4/2017 Lab 4: Friction
https://moodle.straighterline.com/pluginfile.php/71010/mod_res
ource/content/5/CourseRoot/html/lab007s001.html 4/5
Figure 4: The coordinate axis is 笕�lted so that the x‐axis is
parallel to the surface upon which the object is in mo笕�on.
Figure 3: With the help of gravity,
skiers can overcome the force of
sta笕�c fric笕�on.
Fric᧻on on Inclines
The accelera᧻on of objects on inclines is due to gravity, yet
the accelera᧻on points along the surface of the incline. When
you ski, the gravita᧻onal force on you is able to overcome the
force of sta᧻c fric᧻on and allow you to move along the incline
of the mountain (Figure 3). When solving physics problems
with objects on an incline, it is o᧻�en beneficial to ᧻lt the
64. 2. “Applying Newton’s Second Law and the equation for static
friction (F = μsN)₁ prove that the coefficient of static friction
(μs) is related to the minimum angle, θ, that causes the block to
slip (Figure 5) by the equation μs = tan(θ).”
When the angle (theta) is increased, friction is lessened due to
lesser normal force, causing the block to slide faster.
3. “A person applied a horizontal force to a crate of mass, m,
that caused the crate to move at a constant velocity (Figure 6).
Show that the relationship between the applied force and the
normal force is FA = μFN.”
Applied force and frictional force are equal. The relationship is
true because the scenario states that there is a constant velocity.
“Experiment 1: Static Friction and Mass on an Inclined Plane”
“Table 1: Wooden Block Incline Data” “Table 2:
Metal Washer Incline Data”
“Trial”
“Angle”
“1”
20
“2”
23
“3”
21
“4”
22
“5”
20
“Trial”
“Angle”
“1”
30
“2”
33
65. “3”
32
“4”
30
“5”
31
“Post-Lab Questions”
1. “Using the result from Pre-Lab Question 2, calculate the
coefficient of friction for each angle in Table 1 and Table 2.
Find the average value for the coefficient of friction for wood
and metal on cardboard.”
Click here to enter text.
2. “Comment on your coefficients of static friction for wood
and metal. If they are different, why do you think they are
different? If they are the same, why do you think they are the
same?”
Click here to enter text.
“Experiment 2: Static Friction vs. Kinetic Friction”
“Table 3: Peak Static Frictional Force”
Total Mass (kg)
Trial 1 (N)
Trial 2 (N)
Trial 3 (N)
Average (N)
.5
2.6
2.4
2.2
66. 2.4
.75
3.0
2.8
2.8
2.86
1
3.2
3.2
3.4
3.26
“Table 4: Kinetic Frictional Force”
Total Mass (kg)
“Trial 1 (N)
“Trial 2 (N)
Trial 3 (N)
Average (N)
.5
1.6
1.6
1.6
1.6
.75
2.2
2.2
2.2
2.2
1
2.8
2.8
2.8
2.8
Calculate the average force from Trials 1, 2, and 3 for static and
kinetic friction.
67. Record the averages in Tables 5 and Table 6.
Average Applied Force (N)
Normal Force (N)
Click here to enter text.
Average Applied Force (N)
Normal Force (N)
Click here to enter text.
“Table 5: Static Frictional Force”
Table 6: Kinetic Frictional Force
“Post-Lab Questions”
1. “From the result from Pre-Lab Question 3, the relationship
between the applied force and the normal force is FA = μFN.
When the data for applied force vs normal force is plotted, the
slope of the graph is equal to the coefficient of friction. Plot
68. graphs of average force vs normal force from the data in Table
5 and Table 6.”
Please draw a diagram to include on this document.
“Insert photo of diagram with your name clearly visible in the
background:””
“Insert photo of experimental setup with your name clearly
visible in the background:””
Lab 5/Lab 5- Conservation of Energy Material.pdf
1/4/2017 Lab 5: Conservation of Energy
https://moodle.straighterline.com/pluginfile.php/72232/mod_res
ource/content/5/CourseRoot/html/lab010s001.html 1/7
Learning Objec�ves
Relate energy to work
Calculate the amount work done by a force
Compare and contrast types of energy
Apply The Law of Conserva�on of Energy to poten�al and kine
�c energy
Introduc�on
You may be familiar with the common usage of the word energy
69. . For example, you may grab
an energy drink to get through the night when cramming late at
night for a test the next
morning, If you're an athlete, you may reach for an energy bar t
o help you finish a game.
Energy is one of the central concepts in science; it has been use
d to explain many natural
phenomena. But what is energy, exactly? Energy is defined as th
e ability to do work. The
amount of energy an object has equals the amount of work it has
the ability to do. Think of
1/4/2017 Lab 5: Conservation of Energy
https://moodle.straighterline.com/pluginfile.php/72232/mod_res
ource/content/5/CourseRoot/html/lab010s001.html 2/7
Figure 1: Work done on a tray.
energy as the currency for performing work. For example, 100 J
oules of energy is required to
do 100 Joules of work.
Work Done by a Constant Force
Work is done when a force causes a mass to move a distance. Th
e unit for work is called the
Joule (J), which is defined as a force of one Newton ac�ng over
one meter. Quan�ta�vely, the
defini�on of work is:
Work = F∙d
where F is the force applied, and d is the displacement. Both for
70. ce and displacement are
vector quan��es, and the opera�on in the equa�on above is kn
own as the dot product. It is
one of the forms of vector mul�plica�on, which yields a scalar
quan�ty. This equa�on for
work is used for a constant force along straight line displaceme
nt. We can simplify the
equa�on above to be:
Work = F||∙d
In this equa�on, F|| is the amount of force applied along or agai
nst the displacement, d. We
can also write this equa�on as:
Work = Fd cosθ
where F is the magnitude of the force, d is the displacement,
and θ is the angle between the direc�on of the force and
displacement. The direc�on factor is a cri�cal aspect of work
to understand. For example, a waiter exerts a force to hold a
serving tray at a steady height (Figure 1). Is work done on the
tray? It may be surprising that the answer is no. Although it
takes energy to keep the tray raised, and the waiter is moving
across the room, the direc�on of the applied force is not the
same as the direc�on of mo�on. Therefore, there is no work
done on the tray by the force applied to it.
Work Done by a Variable Force
Forces are not always constant and may change with an object’s
loca�on. Springs are a good
example: as a spring is stretched, it must be pulled harder to kee
p the spring stretched out.
When the force is only varying in the x‐component and has a str
aight line displacement,
71. mathema�cally, this can be solved using integra�on:
where F(x) is the variable force integrated with respect to posi�
on from its original posi�on,
x0, to its final posi�on, xf. Graphically, this is equivalent to cal
cula�ng the area under the
curve of the force versus posi�on graph (Figure 2).
1/4/2017 Lab 5: Conservation of Energy
https://moodle.straighterline.com/pluginfile.php/72232/mod_res
ource/content/5/CourseRoot/html/lab010s001.html 3/7
Figure 3: Wind turbines.
Figure 2: The area under the plot equals the amount of work don
e.
If the force is variable and the displacement is along a curved p
ath, work can be found by
using the following equa�on:
where F is a variable force integrated from one point to another
with respect to an
infinitesimally small displacement vector (dl) that lies tangent t
o the path of its posi�on. Once
again the dot product is present but can be simplified in certain
cases where Φ is the angle
between F and dl.
Types of Energy
Energy is one of the most important concepts in
physics, and comes in a variety of forms ‐
72. chemical, gravita�onal, elas�c, electric, and
rota�onal energy to name a few. Of these many
forms, energy can generally be categorized as
kine�c or poten�al energy. Kine�c energy (KE) is
the energy associated with the state of mo�on of
an object. Wind energy is an example of kine�c
energy (Figure 3). The molecules of gas in the air
are in constant mo�on, providing energy that can
be harnessed by wind turbines like the ones above
that convert it into electric energy. The faster the
object is moving, the greater its KE. The rela�onship between k
ine�c energy (KE), mass (m)
and velocity (v) is:
KE = ½ mv2
In contrast, poten�al energy (PE) is the stored
energy associated with the posi�on of an
object. This type of energy exists when there is
some kind of force that returns an object to its
1/4/2017 Lab 5: Conservation of Energy
https://moodle.straighterline.com/pluginfile.php/72232/mod_res
ource/content/5/CourseRoot/html/lab010s001.html 4/7
Figure 4: Water stored in the Shasta dam in
California for hydroelectricity.
original posi�on a�er being displaced. For
instance, an object li�ed above the ground has
gravita�onal poten�al energy because it will
accelerate to the ground when released. Water
stored in a dam for hydroelectricity genera�on
73. is also a form of poten�al energy. When the
valves open to allow the water to flow, the
gravita�onal poten�al energy of the water is
converted to kine�c energy (Figure 4). The more
massive the object and the greater the height,
the more energy the object has when it falls to
the ground. The equa�on to determine
gravita�onal poten�al energy (PEgravity) is:
PEgravity = mgh
where m is the mass of the object, g is the gravita�onal force (9
.8m/s2), and h is the height
above the Earth's surface.
There are �mes when poten�al energy can be found, and the fo
rce on the object is needed.
By taking the deriva�ve of poten�al energy with respect to pos
i�on, this gives us the force on
the object. In one dimension the equa�on is:
for this equa�on U is poten�al energy measured in Joules. Fro
m this equa�on, we can also
relate work to poten�al energy:
W = ‐△U
Another example of poten�al energy is a rubber band. A stretch
ed rubber band has the
poten�al to return to its original length, doing work in the proc
ess (force applied over a
distance). In this sense, poten�al energy is o�en referred to as t
he energy of posi�on, as it is
energy that depends on how far an object is removed from a pos
i�on of equilibrium.
Similarly, a spring has elas�c poten�al energy that increases as
74. it is stretched, and also
depends on the material it is made from. With increased s�ffnes
s in springs comes the ability
to store more energy and do more work.
? Did You Know...
As the cyclist rides through the mountain trail, chemical energy
is converted into ki �c
energy and thermal energy (you get hot riding a bike). As the cy
clist climbs the mountain,
the �c energy in the bicycle and the cyclist will be conver
ted to other forms of energy.
�on between the �res and ground causes �c ener
gy to transform to heat energy.
If a cyclist approaches a hill with enough speed, no more peddli
ng will be necessary to
reach the top because the �c energy will be converted to
�al energy. If the
cyclist needs to stop and applies the brakes, �c energy is
dissipated through �on
as heat energy.
1/4/2017 Lab 5: Conservation of Energy
https://moodle.straighterline.com/pluginfile.php/72232/mod_res
ource/content/5/CourseRoot/html/lab010s001.html 5/7
Work Energy Theorum
Work is related to the object's displacement as can be seen by th
e equa�ons discussed
earlier. However, work is also dependent upon the change in an
object's speed. If an object is
75. speeding up then work is posi�ve, if the object is slowing down
then work is nega�ve, and if
there is no change in the object's speed then there is no work do
ne. The work‐energy
theorem says that:
Work = K2 ‐ K1 = △U
This means that the change in a object's kine�c energy equals t
he work done by the force on
the object. Remember that kine�c energy equals 1/2mv2.
Power
Power is the rate at which work is done, so power is analyzing t
he work being done over �me.
Just as there is average velocity and instantaneous velocity, ther
e is average power and
instantaneous power. To find average power, you look at the cha
nge in work over a �me
period:
For instantaneous power, you take the deriva�ve of work with r
espect to �me:
The standard unit of power is a wa� (W) where 1 W is equal to
1 J/s. Power can also be found
by looking at the force ac�ng upon an object and the object's ve
locity. In this case, average
power can be found by the given equa�on:
1/4/2017 Lab 5: Conservation of Energy
https://moodle.straighterline.com/pluginfile.php/72232/mod_res
76. ource/content/5/CourseRoot/html/lab010s001.html 6/7
Where F|| is the component of the force that acts parallel to the
displacement vector and
vaverage is the average velocity. To find the instantaneous pow
er by looking at force and
velocity, the dot product can again be used:
Conserva�on of Energy
Energy can change forms, such as poten�al energy transforming
into kine�c energy. The law
of conserva�on of energy states that the energy of an isolated s
ystem cannot be created or
destroyed; it can only change forms or be transferred from one o
bject to another. Consider a
system composed of a ball and the Earth. If a ball is sta�onary t
hree meters above the
ground, it has gravita�on poten�al energy. When the ball falls
due to the force of gravity
(remember Earth is part of our system), the kine�c energy of th
e ball right before it hits the
ground is equal to the stored gravita�onal poten�al energy of t
he ball at three meters above
the ground. When the ball bounces back up, the kine�c energy
will be converted back into
poten�al energy. Since the total energy of the system is equal t
o the original poten�al energy
at three meters, the maximum height the ball can ever bounce to
is three meters. A ball
rarely bounces back to the original height because some energy
goes into hea�ng the air and
ground through air resistance and contact with the ground.
As long as all energies are accounted for, the sum of the energie
s is the same at any moment.
77. This is a very useful principle because now the energy of an obj
ect at any two moments in
�me can be compared! Let's examine this quan�ta�vely using t
he ball and Earth system.
Problem: A ball of mass, m, is dropped from rest from a height,
h, of 3 meters. What is the
ball's speed a�er it has fallen 2 meters?
Solu�on: If the ground is chosen as a reference height (where t
he height equals zero meters),
the two states to consider are when the ball is at rest at 3 meters
above the ground, and a�er
is has fallen 2 meters, or it is located 1 meter above the ground.
The total energy of the first
state, E1, is equal to the total energy of the second state, E2:
E1 = E2
Energy converted to heat by air fric�on will be ignored. This m
eans that the only energies the
ball can have during the drop is kine�c and poten�al energy:
KE1 + PE1 = KE2 + PE2
When the kine�c energy states and poten�al energy states are r
eplaced with their
equivalents the following equa�on can be derived:
½ mball v1
2 + mball gh1` = ½ mball v2
2 + mball gh2
No�ce the mass of the ball is in every term and can be divided
out of the equa�on. In E1, the
79. the potenꭍ�al energy and kineꭍ�c energy of the ball need to be
calculated.
Materials
Table 2
Procedure
1.
To calculate the kineꭍ�c energy, the velocity of the ball needs t
o be known. From
the given table, only posiꭍ�on is provided. To find velocity, a
method called the
"leap‐frog” method can be used to approximate the velocity usin
g the posiꭍ�on and
ꭍ�me points just before and a⚽er:
v= Δx
Δt
The first velocity point has been done for you as an example:
v =
Δx
=
x3 ‐ x1 =
0.10 m‐ 0.00 m
= ‐ 0.40 m/s
Δt t3 ‐ t1 0.496 s ‐ 5.00 s
80. 2.
Use this method to calculate the other velociꭍ�es. Record the ve
lociꭍ�es in Table 5.
Table 2: Dropped Ball Data
Time (s)
Ball Posiꭍ�on
(m)
Ball Velocity
(m/s)
Potenꭍ�al Energy
(J)
Kineꭍ�c Energy
(J)
Total Energy
(J)
0.00 5.00
0.05 4.99
0.10 4.96
0.15 4.89
1/4/2017 Lab 5: Conservation of Energy
https://moodle.straighterline.com/pluginfile.php/72235/mod_res
ource/content/6/CourseRoot/html/lab010s004.html 2/2
0.20 4.78
82. b. “The work done by the spring by calculating the area under
the curve.”
Click here to enter text.
2. “Consider the ball example in the introduction when a ball is
dropped from 3 meters. After the ball bounces, it raises to a
height of 2 meters. The mass of the ball is 0.5 kg.”
a. “What is the speed of the ball right before the bounce?”
Click here to enter text.
b. “How much energy was converted into heat after the ball
bounced off the ground? (Hint: Thermal Energy (TE) will now
need to be included in your conservation of energy equation and
you will now need to know the mass of the ball).”
Click here to enter text.
c. “What is the speed of the ball immediately after the ball
bounces off the ground?”
Click here to enter text.
3. “A 2 kg book is sitting on a horizontal glass table top. A
woman pushes the book across the table with a horizontal force
F. The book’s position changes as a function of time given by
x(t) = (2.9 m/s³) t³- (3.6 m/s²) t². What is the book’s velocity at
t=1.2 seconds? Calculate the magnitude of the force at t=1.2
seconds. Find the work done by the force during the first 1.2
seconds of its motion.”
Click here to enter text.
4. “Propeller-driven airplanes have engines that develop a thrust
(a forward force on the airplane) of 15,000 N. What is the
instantaneous power produced by the aircraft when it is flying
at 166.67 m/s?”
Click here to enter text.
83. “Experiment 1: Work Done by a Spring”
“Table 1: Spring Scale Force Data”
“Force (N)”
Distance, x (m)
ForceAverage (N)
Δ Distance, Δx (m)
Work (J)
“0”0
“0”
Click here to enter text.
“0.01”
Click here to enter text.
1
“0.01”
Click here to enter text.
“0.01”
Click here to enter text.
2
“0.02”
Click here to enter text.
“0.01”
Click here to enter text.
3
“0.03”
Click here to enter text.
84. “0.01”
Click here to enter text.
4
“0.04”
Click here to enter text.
“0.01”
Click here to enter text.
5
“0.05”
“*Note, you will finish completing Table 1 in the Post-Lab
Questions section.”
“Post-Lab Questions”
1. “Create a Force vs. Displacement (stretch) graph.”
“Insert photo of graph with your name clearly visible in the
background:”
2. “Using the result of Pre-Lab Question 1, calculate the work
done by the spring.”
Click here to enter text.
3. “The work done by the spring can be broken down by the
work done by each 1 cm stretch. Fill in the rest of Table 1 to
calculate the average force applied by the spring over each 1 cm
stretch.”
4. “Calculate the work done in each segment and determine the
total work done by adding all of the segments together. How
does this compare to the work done by the spring calculated in
Post-Lab Question 2?”
Click here to enter text.
85. 5. “A student finds a spring that does not obey Hooke’s Law
and stretches it 5.0 cm. The force that he had to use in order to
stretch the spring is modeled by Fx= 5.4 N + (-2.3 N/m²) x² +
(4.3 N/m³) x³. How much work was required for this task?”
Click here to enter text.
“Insert photo of your experimental setup with your name clearly
visible in the background:”
“Experiment 2: Conservation of Energy – Data Analysis”
“Table 2: Dropped Ball Data”
“Time (s)”
Ball Position (m)
Ball Velocity (m/s)
Potential Energy (J)
Kinetic Energy (J)
Total Energy (J)
“0.00”
“5.00”
“0.05”
“4.99”
Click here to enter text.
“0.10”
“4.96”
Click here to enter text.
“0.15”
“4.89”
Click here to enter text.
86. Click here to enter text.
Click here to enter text.
“0.20”
“4.78”
Click here to enter text.
“0.25”
“4.69”
Click here to enter text.
“0.30”
“4.54”
Click here to enter text.
“0.35”
“4.40”
Click here to enter text.
“0.40”
“4.22”
Click here to enter text.
“0.45”
“4.00”
Click here to enter text.
87. Click here to enter text.
Click here to enter text.
“0.50”
“3.80”
Click here to enter text.
“0.55”
“3.50”
Click here to enter text.
“0.60”
“3.26”
Click here to enter text.
“0.65”
“2.93”
Click here to enter text.
“0.70”
“2.60”
Click here to enter text.
“0.75”
“2.23”
Click here to enter text.
88. Click here to enter text.
Click here to enter text.
“0.80”
“1.88”
Click here to enter text.
“0.85”
“1.46”
Click here to enter text.
“0.90”
“1.05”
Click here to enter text.
“0.95”
“0.58”
Click here to enter text.
“1.00”
“0.11”
“Post-Lab Questions”
1. “Graph the potential energy, kinetic energy, and total energy
of the ball.”
“Insert photo of graph with your name clearly visible in the
89. background:”
2. “Describe the shape of each graph.”
Click here to enter text.
3. “What are the limitations of using the leap-frog method?”
Click here to enter text.
4. “An object is moving horizontally with no vertical
movement, and it has a mass of 0.20 kg. Its potential energy
function can be described as U(x) = (3.8 J/m²) x² — (2.1 J/m) x.
What is the force on the object? What is the magnitude of the
acceleration at x = 0.44 meters?”
Click here to enter text.