Download to read offline
![IOSR Journal of Mechanical and Civil Engineering (IOSR-JMCE)
e-ISSN: 2278-1684,p-ISSN: 2320-334X, Volume 12, Issue 3 Ver. II (May - Jun. 2015), PP 85-93
www.iosrjournals.org
DOI: 10.9790/1684-12328593 www.iosrjournals.org 85 | Page
Identification of Root Cause for Lining Thickness Variation
Defect in Brake Shoe Using Six Sigma
P. Prakash1
, Anantharaman Sriraman2
, S. Premanandh3
1
PG Student, College of Engineering, Department of Mechanical Engineering,
Anna University, Guindy, Chennai, India-600025
2
Visiting Faculty, College of Engineering, Department of Mechanical Engineering,
Anna University, Guindy, Chennai, India-600025
3
Assistant Manager, Technical, TVS – Brakes India Limited, Polambakkam, India-603309
Abstract: The aim of the project is to reduce rejection level of brake shoe assembly using six sigma technique.
Six sigma is a quality improvement tool for product. It reduces the defects, minimizes the variation and improves
the capability of the manufacturing process. The main objective of Six Sigma is to increase the profit margin,
improve financial condition through minimizing the defects rate of product. Further it increases the customer
satisfaction, retention and produces the best class product from the best process performance. The brake shoe
has more Lining Thickness Variation (LTV) defect in the production line. The current rejection level of lining
thickness variation defect is very high which leads to consumption of money in the form of rework and rejection
of the job. The aim of the project is to identify the causes for lining thickness variation defect in brake shoe.
Key words - Six sigma, Lining Thickness Variation, Brake shoe.
I. Introduction
The Six Sigma is a financial improvement strategy for an organization and now a day it is being used in
many industries. Basically it is a quality improving process of final product by reducing the defects, minimize
the variation and improve capability in the manufacturing process. In order to use the Six Sigma in an
organization, there are many things that are needed to achieve the financial goals in the organization. The main
thing of Six Sigma is taking the existing product, process and improves them in a better way. Six Sigma
provides a structured approach to solving problems through the Implementation of five phases, Define, Measure,
Analyze, Improve and Control (DMAIC). The DMAIC methodology is simple, applicable to all environments
and each phase has clear objectives, actions and outputs. Six Sigma focuses on the quality rather than the
quantity of data on which it applies statistical techniques in a practical format [1].
Lars Krogstiea (2013) conducted the application of Six Sigma in improvement of tolerances and
process variation in casting. The process variation leads to make tolerance defect in the product. The author has
found that the root cause of the problem using the six sigma. After implementing six sigma the problem has
been overcome and the product has been reached current tolerance level [2].
Keki R. Bhote (2007) using Six Sigma for the Business Excellence. Also he advises that ultimate goal
shall be customer satisfaction and also gives importance to employee involvement. Giving reference to
Maslow’s theory he suggests that employees will get motivated if all their needs get satisfied. Though the
Author gives reasons for 64 failure of Six Sigma Implementation in an organization, he doesn’t give any plan
for successful implementation [3].
Amit Kumar Singha (2010) conducted the application of Six sigma in head lamp manufacturing
company. In that, the author have found that the current level of rejection is 12%. After implementation of six
sigma, rejection level has been reduced to 6% [4].
II. Project Methodology
The manufacturer needs to produce high quality products with minimum amount of defects level. In a
company, if defect level of brake shoe production increases, it will lead to more defective products in shop floor.
It needs rework and rejection activity, which will consume more money, time, human effort and affect the
productivity. Six sigma is a technique which is used for process improvement. It is the method used to identify
the causes and eliminate the identified causes which would result in defects. So that the rejection level is
reduced in the production of brake shoe. In six sigma, various tools are used to find out the root cause of the
problem. The tools are catenaries under the different phases. Various factors like man, machine, material,
measurement system, method may be the reason for making defects.](https://image.slidesharecdn.com/l012328593-160711053314/85/L012328593-1-320.jpg)


![Identification Of Root Cause For Lining Thickness Variation Defect In Brake Shoe…
DOI: 10.9790/1684-12328593 www.iosrjournals.org 93 | Page
IV. Conclusion
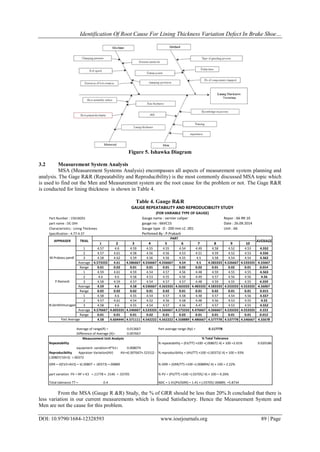
Lining thickness variation causes more amount of rejection in brake shoe assembly. The root cause has
been identified using six sigma. The factors Man, Machine, Method, Material and Measurement system are the
root causes, which have been shown in the Ishikawa diagram. Paired comparison analysis and gauge R & R are
conducted which result Suspected Source of Variation and measurement system are not the causes of the LTV
defect. But the major problem which causes the defects has been identified in the method of loading in grinding
fixture. Fluctuation of the job during clamping causes the defects in the job, due to datum resting in butting
block not ensured during process which is analyzing through why why analysis. The root cause of LTV defect
in brake shoe has been identified that improper budding block design and grinding fixture design.
Reference
[1]. Andreas Kraus, Implementation of the six sigma methodology in the maintenance process, university of Bedfordshire, 2012.
[2]. Lars Krogstiea, Cross-collaborative Improvement of Tolerances and Process Variations, Forty Sixth CIRP Conference on
Manufacturing Systems, 2013.
[3]. Keki R. Bhote, Ultimate Six Sigma, PHI India, 2007 and Mikel Harry, Richard Schroeder, Six Sigma- The Breakthrough
Management Strategy, Currency, New York, 2005.
[4]. Amit Kumar Singha, Defining Quality Management in Auto Sector: A Six-sigma Perception, International Conference on Advances
in Manufacturing and Materials Engineering, ICAMME 2014.
[5]. ChiaJou Lina, Continuous improvement of knowledge management systems using Six Sigma methodology, International Congress
on Interdisciplinary Business and Social Sciences, ICIBSoS 2012.
[6]. Winters-Miner, Linda A, Root Cause Analysis, Six Sigma, and Overall Quality Control and Lean Concepts, 8th International
Conference on Material Sciences, CSM8-ISM5,2009.
[7]. Muhammad Adnan Abid, How to minimize the defects rate of final product in textile plant by the implementation of DMAIC tool
of Six Sigma, Master of Industrial Engineering-Quality and Environmental Management, Final Degree Thesis 15 Ects, Sweden
Thesis Nr. 17/2010.
[8]. Steven James Thompson, Improving the performance of six sigma; A case study of six sigma process at Ford Motor Company,
university of Bedfordshire, 2007.
[9]. Mehrjerdi, Y.Z., Six Sigma: methodology, tools and its future, Assembly Automation, Vol. 31, No. 1, pp. 79–88, 2011.
[10]. Pepper, M.P.J. and Spedding, T.A, The evolution of lean Six Sigma, International Journal of Quality & Reliability Management,
Vol. 27, No. 2, pp. 138- 155, 2010.
[11]. Braunscheidel, M.J, Hamister, J.W, Suresh, N.C. and Harold, S, An institutional theory perspective on Six Sigma adoption,
International Journal of Operations & Production Management, Vol. 31, No. 4, pp. 423-451, 2011.
[12]. Pintellon, L., Pinjala, S.K. and Vereecke, A, Evaluating the effectiveness of maintenance strategies, Journal of Quality in
Maintenance Engineering, Vol. 12, No. 1, pp. 7-20, 2010.
[13]. Pyzdek Thomas, The Six Sigma handbook; a complete guide for green belts, black belts, and managers at all levels (New York
McGraw-Hill, Chapter 1) Pages 4-5, 2003.
[14]. Liker, Jeffrey K, The Toyota Way (Tata McGraw-Hill, 2004)
[15]. Womack, James P. AND Daniel T. Jones, Lean Thinking; Banish Waste and Create Wealth in Your Corporation (Simon &
Schuster,2003)
[16]. George Byrne, Dave Lubowe, Amy Blitze, Driving Operational Innovation using Lean Six Sigma, IBM Institute for Business
Value, 2007.
[17]. Caulcutt, Roland, Why is Six Sigma so successful?, Journal of Applied Statistics, 28: 3, 301 — 306, 2001.
[18]. Ricardo Banuelas Coronado, Jiju Antony, Critical success factors for the successful implementation of six sigma projects in
organizations, The TQM Magazine, Volume 14, 2002.
[19]. Editorial Committee, Guidebook for Six Sigma Implementation with Real Time Applications (Indian Statistical Institute,
Bangalore, 2007)
[20]. Six Sigma. (n.d). Six Sigma Overview. Retrieved July 01, 2010. From thequalityportal.com
http://www.thequalityportal.com/q_6sigma.html](https://image.slidesharecdn.com/l012328593-160711053314/85/L012328593-9-320.jpg)

The document discusses using Six Sigma methodology to identify the root causes of lining thickness variation defects in brake shoes during production. Six Sigma is a quality improvement process used to reduce defects by minimizing variation and improving manufacturing processes. The company was experiencing high rejection rates due to lining thickness variation defects, resulting in increased rework and scrap costs. The author aims to apply the Define, Measure, Analyze, Improve, and Control phases of Six Sigma to identify the root causes of the defects and reduce rejection levels. Data on production volumes and defects over the last six months was collected and analyzed. An Ishikawa diagram was created to identify potential causes of the defects related to materials, machines, methods, measurements and personnel.