Download to read offline


![Economic Effects Of Technical And Non Technical Losses In Nigeria Power Distribution System
DOI: 10.9790/1676-102189100 www.iosrjournals.org 100 | Page
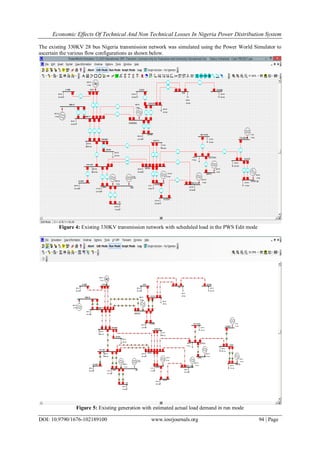
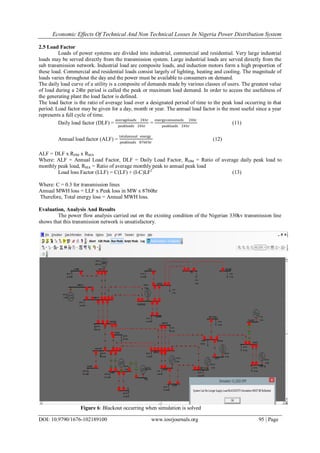
drops and power losses which can be attributed to low generation, long and fragile radial network, making it
highly prone to failure, unreliability, inefficiency and poor performance. The energy loss at October 2012 due to
the 330Kv transmission network is about 454.73 GW amounting to over 4.4 billion naira.
The technical information provided in this paper forms a veritable database for future work towards improving
Nigeria‟s power system operation. It is highly recommended that
The length of transmission and distribution lines should be as short as possible by introducing more
substations in the network. Voltage drops and power losses increase with increase in the line length and
loading.
While the expanded network is graduallybeing implemented, the existing transmission lines and substations
should be upgraded to improve voltage profile of vulnerable buses like Gombe, Damaturu, Jos and
Kumbotso buses with appropriately sized VAR compensators.
By fortifying the expanded grid, that is, double and triple circuits should be used to replace those lines with
single circuits to increase the efficiency and the reliability of the network.
Provision of multiple loops in a fortified network will guarantee continuity of supply in the event of any
contingency or fault.
Provision of two double circuit transmission lines to interconnect Egbin and Oshogbo, and double circuit
lines to connect Oshogbo to Aieyede and Kainji to Birin-Kebbi will greatly enhance the efficient operation
of the grid.
Provision of adequate generation capacity in each zone of the Federation through distributed generation
scheme to minimize line losses and cost of power spiraling.
The government should implement the Independent Power Projects for lack of political will and policy
inconsistency was responsible for the power sector to deliver 6,000MW last December
Existing power stations should be rehabilitated and the transmission lines that are over age should be
replaced
Planned and routine maintenance should be carried out on the network.
If all these recommendations are looked into as well as those from future research on this topic by
stakeholders in the power sector, then we can look forward to having a system with reliable and efficient
power supply.
References
[1]. Archibong P.E. (1997): The Status of Supporting Infrastructural Facilities and Services for non-oil sector Development, CBN
Economic and Financial review, 28(21): 23-42.
[2]. Ayodele A.S. (1998): Energy Crisis in Nigeria: The case of Electric Energy Market, Bullion Publication of CBN, 22(4): 19-23.
[3]. Izuegbunam F.I, Duruibe S.I and Ojukwu G.G (2011): Power flow and Contingency Assessment Simulation of the expanding
330KV Nigerian Grid Using Power World Simulator, JETEAS 2(6): 1002-1008, ISSN: 2141-7016.
[4]. Jiguparmar (2013): Total Losses in Power Distribution and Transmission Lines, Electrical Engineering Portal.
[5]. Navani J.P., Sharma N.K. and SonalSarpa (2003): “A Case Study of analysis of Technical and Non-Technical Losses in Power
System and its Impact on Power Sector”, International Journal of Advances in Engineering Science and Technology, Vol 1, Issue 2,
pp. 137-146, ISSN: 2319-1120.
[6]. Odumosu T. (2005): Africa needs power for NEPAD to work in Energy in Africa 2(1): 34.
[7]. Omorogiuwa E. and Odiase O. F. (2011): Optimal Location of IPFC in Nigeria 330KV Integrated Power Network Using GA
Technique, University of Port Harcourt: 35-39.
[8]. Onohaebi O.S (2007): Reduction of the High Technical Power Losses Associated with the Nigerian 330KV Transmission Network,
IJEPE 4(5): 421-431.
[9]. P.H.C.N Control Centre, Abuja (2012): Generation and Transmission Grid Operations; Annual Technical Report for 2012.
[10]. Power World Co-operation, Power World Simulator, Version 12.0, Glover/Sarma Build, March 30, 2007, licensed only for
Evaluation and University Educational use, 1996 – 2007.
[11]. Subair K. and Oke D.M. (2008): Privatization and Trends of Aggregate Consumption of Electricity in Nigeria: An Emperical
Analysis, African Journal of Accounting, Economics, Finance and Banking Research 3(3) 18-27.
[12]. Suriyamongkol D. (2002):Non-Technical Losses in Electrical Power Systems, In Fritz I. and Dolores H. Russ College of
Engineering and Technology, Ohio University.
[13]. Upong I.I. (1976): “An Analysis of the causes of Power Shortage in Nigeria”, The Nigerian Journal of Economic and Social studies,
Vol.18, pp. 34-49.
[14]. Wikipedia Encyclopedia: “Electrical Power Transmission”.
[15]. World Bank Group Energy Sector Strategy (2009): Reducing Technical and Non-Technical Losses in the Power Sector.
[16]. World Energy Council (2007):African Forum on Energy Efficiency, Abuja, Nigeria.](https://image.slidesharecdn.com/l0102189100-160705055915/85/L0102189100-12-320.jpg)

This document summarizes a study on the economic effects of technical and non-technical losses in Nigeria's power transmission system. The study found that Nigeria's 330kV transmission network suffers from high voltage drops and power losses of around 454.73 GW annually, costing over 4.4 billion naira. These losses are caused by technical issues like low generation capacity and a long, fragile network as well as non-technical issues like electricity theft. Reducing these transmission and distribution losses, which at 17.72% of output are very high compared to more efficient countries, could boost Nigeria's economic growth.


