1) The document discusses hypothesis testing to compare the means of two populations using independent samples and matched samples. It provides examples to estimate differences between population means and test hypotheses about differences.
2) Methods covered include point and interval estimation of mean differences for large and small sample sizes. Hypothesis tests are demonstrated for comparing population means using z-tests for large samples and t-tests for small samples.
3) An example compares delivery times for two express delivery services using a matched sample design, where deliveries to each office are paired between the two services. Hypotheses are tested about whether a difference exists between the average delivery times.
Solution manual for design and analysis of experiments 9th edition douglas ...Salehkhanovic
Solution Manual for Design and Analysis of Experiments - 9th Edition
Author(s): Douglas C Montgomery
Solution manual for 9th edition include chapters 1 to 15. There is one PDF file for each of chapters.
Some Unbiased Classes of Estimators of Finite Population Meaninventionjournals
International Journal of Mathematics and Statistics Invention (IJMSI) is an international journal intended for professionals and researchers in all fields of computer science and electronics. IJMSI publishes research articles and reviews within the whole field Mathematics and Statistics, new teaching methods, assessment, validation and the impact of new technologies and it will continue to provide information on the latest trends and developments in this ever-expanding subject. The publications of papers are selected through double peer reviewed to ensure originality, relevance, and readability. The articles published in our journal can be accessed online
mean, variance, and standard deviation of a
discrete probability distribution,binomial probability distribution,hypergeometric probability distribution,Poisson probability distribution.
Study on genetic diversity and phylogenetic relationship among eleven traditi...Manya Education Pvt Ltd
The present investigation was carried out to study the genetic diversity among the eleven different traditional varieties of rice from southern states of Tamilnadu. High quality DNA was extracted from the seed material by Doyle and Doyle protocol with slight modifications. RAPD profile of eleven rice varieties was generated using 8 primers OP-13, 16, 17, 18 and OP – 8, 11, 17, 18 showed 98 Fragments generated. Out of which, 98 bands were polymorphic in nature and remaining were monomorphic. In dendrogram, Vellai Chittiraikar traditional rice variety was only variety which was not at all closely related to all other varieties.
The seeds of these varieties have been passed on to farmers over the generations. Maximum variability of 66% between these varieties at genetic level indicated that the traditional varieties have a wider genetic base. This will enrich the rice germplasm of our nation for use in future breeding programmes.
In conclusion, RAPD has high potential and remarkable quality for assessment of genetic populations. It is also evident that RAPD offer several advantages over traditional phenotypic markers as they provide data that can be analyzed objectively. This gives new dimensions to breeding especially with respect to time required for developing new and improved crop varieties.
Please Subscribe to this Channel for more solutions and lectures
http://www.youtube.com/onlineteaching
Chapter 7: Estimating Parameters and Determining Sample Sizes
7.3: Estimating a Population Standard Deviation or Variance
Please Subscribe to this Channel for more solutions and lectures
http://www.youtube.com/onlineteaching
Chapter 7: Estimating Parameters and Determining Sample Sizes
7.3: Estimating a Population Standard Deviation or Variance
The presentation was presented by Sahil Jain at IIIT-Delhi
The presentation briefly explains the Wilcoxon Rank-Sum test along with the help of an example.
Please Subscribe to this Channel for more solutions and lectures
http://www.youtube.com/onlineteaching
Chapter 9: Inferences from Two Samples
9.2: Two Means, Independent Samples
The world of search engine optimization (SEO) is buzzing with discussions after Google confirmed that around 2,500 leaked internal documents related to its Search feature are indeed authentic. The revelation has sparked significant concerns within the SEO community. The leaked documents were initially reported by SEO experts Rand Fishkin and Mike King, igniting widespread analysis and discourse. For More Info:- https://news.arihantwebtech.com/search-disrupted-googles-leaked-documents-rock-the-seo-world/
3.0 Project 2_ Developing My Brand Identity Kit.pptxtanyjahb
A personal brand exploration presentation summarizes an individual's unique qualities and goals, covering strengths, values, passions, and target audience. It helps individuals understand what makes them stand out, their desired image, and how they aim to achieve it.
Tata Group Dials Taiwan for Its Chipmaking Ambition in Gujarat’s DholeraAvirahi City Dholera
The Tata Group, a titan of Indian industry, is making waves with its advanced talks with Taiwanese chipmakers Powerchip Semiconductor Manufacturing Corporation (PSMC) and UMC Group. The goal? Establishing a cutting-edge semiconductor fabrication unit (fab) in Dholera, Gujarat. This isn’t just any project; it’s a potential game changer for India’s chipmaking aspirations and a boon for investors seeking promising residential projects in dholera sir.
Visit : https://www.avirahi.com/blog/tata-group-dials-taiwan-for-its-chipmaking-ambition-in-gujarats-dholera/
Memorandum Of Association Constitution of Company.pptseri bangash
www.seribangash.com
A Memorandum of Association (MOA) is a legal document that outlines the fundamental principles and objectives upon which a company operates. It serves as the company's charter or constitution and defines the scope of its activities. Here's a detailed note on the MOA:
Contents of Memorandum of Association:
Name Clause: This clause states the name of the company, which should end with words like "Limited" or "Ltd." for a public limited company and "Private Limited" or "Pvt. Ltd." for a private limited company.
https://seribangash.com/article-of-association-is-legal-doc-of-company/
Registered Office Clause: It specifies the location where the company's registered office is situated. This office is where all official communications and notices are sent.
Objective Clause: This clause delineates the main objectives for which the company is formed. It's important to define these objectives clearly, as the company cannot undertake activities beyond those mentioned in this clause.
www.seribangash.com
Liability Clause: It outlines the extent of liability of the company's members. In the case of companies limited by shares, the liability of members is limited to the amount unpaid on their shares. For companies limited by guarantee, members' liability is limited to the amount they undertake to contribute if the company is wound up.
https://seribangash.com/promotors-is-person-conceived-formation-company/
Capital Clause: This clause specifies the authorized capital of the company, i.e., the maximum amount of share capital the company is authorized to issue. It also mentions the division of this capital into shares and their respective nominal value.
Association Clause: It simply states that the subscribers wish to form a company and agree to become members of it, in accordance with the terms of the MOA.
Importance of Memorandum of Association:
Legal Requirement: The MOA is a legal requirement for the formation of a company. It must be filed with the Registrar of Companies during the incorporation process.
Constitutional Document: It serves as the company's constitutional document, defining its scope, powers, and limitations.
Protection of Members: It protects the interests of the company's members by clearly defining the objectives and limiting their liability.
External Communication: It provides clarity to external parties, such as investors, creditors, and regulatory authorities, regarding the company's objectives and powers.
https://seribangash.com/difference-public-and-private-company-law/
Binding Authority: The company and its members are bound by the provisions of the MOA. Any action taken beyond its scope may be considered ultra vires (beyond the powers) of the company and therefore void.
Amendment of MOA:
While the MOA lays down the company's fundamental principles, it is not entirely immutable. It can be amended, but only under specific circumstances and in compliance with legal procedures. Amendments typically require shareholder
VAT Registration Outlined In UAE: Benefits and Requirementsuae taxgpt
Vat Registration is a legal obligation for businesses meeting the threshold requirement, helping companies avoid fines and ramifications. Contact now!
https://viralsocialtrends.com/vat-registration-outlined-in-uae/
[Note: This is a partial preview. To download this presentation, visit:
https://www.oeconsulting.com.sg/training-presentations]
Sustainability has become an increasingly critical topic as the world recognizes the need to protect our planet and its resources for future generations. Sustainability means meeting our current needs without compromising the ability of future generations to meet theirs. It involves long-term planning and consideration of the consequences of our actions. The goal is to create strategies that ensure the long-term viability of People, Planet, and Profit.
Leading companies such as Nike, Toyota, and Siemens are prioritizing sustainable innovation in their business models, setting an example for others to follow. In this Sustainability training presentation, you will learn key concepts, principles, and practices of sustainability applicable across industries. This training aims to create awareness and educate employees, senior executives, consultants, and other key stakeholders, including investors, policymakers, and supply chain partners, on the importance and implementation of sustainability.
LEARNING OBJECTIVES
1. Develop a comprehensive understanding of the fundamental principles and concepts that form the foundation of sustainability within corporate environments.
2. Explore the sustainability implementation model, focusing on effective measures and reporting strategies to track and communicate sustainability efforts.
3. Identify and define best practices and critical success factors essential for achieving sustainability goals within organizations.
CONTENTS
1. Introduction and Key Concepts of Sustainability
2. Principles and Practices of Sustainability
3. Measures and Reporting in Sustainability
4. Sustainability Implementation & Best Practices
To download the complete presentation, visit: https://www.oeconsulting.com.sg/training-presentations
Attending a job Interview for B1 and B2 Englsih learnersErika906060
It is a sample of an interview for a business english class for pre-intermediate and intermediate english students with emphasis on the speking ability.
Enterprise Excellence is Inclusive Excellence.pdfKaiNexus
Enterprise excellence and inclusive excellence are closely linked, and real-world challenges have shown that both are essential to the success of any organization. To achieve enterprise excellence, organizations must focus on improving their operations and processes while creating an inclusive environment that engages everyone. In this interactive session, the facilitator will highlight commonly established business practices and how they limit our ability to engage everyone every day. More importantly, though, participants will likely gain increased awareness of what we can do differently to maximize enterprise excellence through deliberate inclusion.
What is Enterprise Excellence?
Enterprise Excellence is a holistic approach that's aimed at achieving world-class performance across all aspects of the organization.
What might I learn?
A way to engage all in creating Inclusive Excellence. Lessons from the US military and their parallels to the story of Harry Potter. How belt systems and CI teams can destroy inclusive practices. How leadership language invites people to the party. There are three things leaders can do to engage everyone every day: maximizing psychological safety to create environments where folks learn, contribute, and challenge the status quo.
Who might benefit? Anyone and everyone leading folks from the shop floor to top floor.
Dr. William Harvey is a seasoned Operations Leader with extensive experience in chemical processing, manufacturing, and operations management. At Michelman, he currently oversees multiple sites, leading teams in strategic planning and coaching/practicing continuous improvement. William is set to start his eighth year of teaching at the University of Cincinnati where he teaches marketing, finance, and management. William holds various certifications in change management, quality, leadership, operational excellence, team building, and DiSC, among others.
Putting the SPARK into Virtual Training.pptxCynthia Clay
This 60-minute webinar, sponsored by Adobe, was delivered for the Training Mag Network. It explored the five elements of SPARK: Storytelling, Purpose, Action, Relationships, and Kudos. Knowing how to tell a well-structured story is key to building long-term memory. Stating a clear purpose that doesn't take away from the discovery learning process is critical. Ensuring that people move from theory to practical application is imperative. Creating strong social learning is the key to commitment and engagement. Validating and affirming participants' comments is the way to create a positive learning environment.
Buy Verified PayPal Account | Buy Google 5 Star Reviewsusawebmarket
Buy Verified PayPal Account
Looking to buy verified PayPal accounts? Discover 7 expert tips for safely purchasing a verified PayPal account in 2024. Ensure security and reliability for your transactions.
PayPal Services Features-
🟢 Email Access
🟢 Bank Added
🟢 Card Verified
🟢 Full SSN Provided
🟢 Phone Number Access
🟢 Driving License Copy
🟢 Fasted Delivery
Client Satisfaction is Our First priority. Our services is very appropriate to buy. We assume that the first-rate way to purchase our offerings is to order on the website. If you have any worry in our cooperation usually You can order us on Skype or Telegram.
24/7 Hours Reply/Please Contact
usawebmarketEmail: support@usawebmarket.com
Skype: usawebmarket
Telegram: @usawebmarket
WhatsApp: +1(218) 203-5951
USA WEB MARKET is the Best Verified PayPal, Payoneer, Cash App, Skrill, Neteller, Stripe Account and SEO, SMM Service provider.100%Satisfection granted.100% replacement Granted.
Discover the innovative and creative projects that highlight my journey throu...dylandmeas
Discover the innovative and creative projects that highlight my journey through Full Sail University. Below, you’ll find a collection of my work showcasing my skills and expertise in digital marketing, event planning, and media production.
Implicitly or explicitly all competing businesses employ a strategy to select a mix
of marketing resources. Formulating such competitive strategies fundamentally
involves recognizing relationships between elements of the marketing mix (e.g.,
price and product quality), as well as assessing competitive and market conditions
(i.e., industry structure in the language of economics).
1. 1
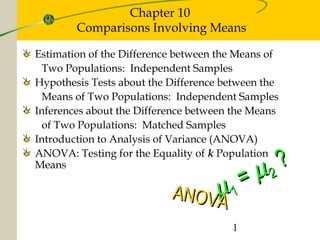
Chapter 10
Comparisons Involving Means
µµ11
== µµ22
??
ANOVAANOVA
Estimation of the Difference between the Means of
Two Populations: Independent Samples
Hypothesis Tests about the Difference between the
Means of Two Populations: Independent Samples
Inferences about the Difference between the Means
of Two Populations: Matched Samples
Introduction to Analysis of Variance (ANOVA)
ANOVA: Testing for the Equality of k Population
Means
2. 2
Estimation of the Difference Between the Means
of Two Populations: Independent Samples
Point Estimator of the Difference between the Means
of Two Populations
Sampling Distribution
Interval Estimate of µ1−µ2: Large-Sample Case
Interval Estimate of µ1−µ2: Small-Sample Case
x x1 2−
3. 3
Point Estimator of the Difference Between
the Means of Two Populations
Let µ1 equal the mean of population 1 and µ2 equal the
mean of population 2.
The difference between the two population means is
µ1 - µ2.
To estimate µ1 - µ2, we will select a simple random
sample of size n1 from population 1 and a simple
random sample of size n2 from population 2.
Let equal the mean of sample 1 and equal the
mean of sample 2.
The point estimator of the difference between the
means of the populations 1 and 2 is .
x x1 2−
x1 x2
4. 4
E x x( )1 2 1 2− = −µ µ
n Properties of the Sampling Distribution ofProperties of the Sampling Distribution of
• Expected ValueExpected Value
Sampling Distribution ofSampling Distribution of x x1 2−
x x1 2−
5. 5
Properties of the Sampling Distribution of
– Standard Deviation
where: σ1 = standard deviation of population 1
σ2 = standard deviation of population 2
n1= sample size from population 1
n2 = sample size from population 2
Sampling Distribution of x x1 2−
x x1 2−
σ
σ σ
x x
n n1 2
1
2
1
2
2
2
− = +
6. 6
Interval Estimate with σ1 and σ2 Known
where:
1 - α is the confidence coefficient (level).
Interval Estimate of µ1 - µ2:
Large-Sample Case (n1 > 30 and n2 > 30)
x x z x x1 2 2 1 2
− ± −α σ/
7. 7
n Interval Estimate withInterval Estimate with σσ11 andand σσ22 UnknownUnknown
where:where:
Interval Estimate of µ1 - µ2:
Large-Sample Case (n1 > 30 and n2 > 30)
x x z sx x1 2 2 1 2
− ± −α/
s
s
n
s
n
x x1 2
1
2
1
2
2
2
− = +
8. 8
Example: Par, Inc.
Interval Estimate of µ1 - µ2: Large-Sample Case
Par, Inc. is a manufacturer of golf equipment and
has developed a new golf ball that has been designed
to provide “extra distance.” In a test of driving
distance using a mechanical driving device, a sample of
Par golf balls was compared with a sample of golf balls
made by Rap, Ltd., a competitor.
The sample statistics appear on the next slide.
9. 9
Example: Par, Inc.
Interval Estimate of µ1 - µ2: Large-Sample Case
– Sample Statistics
Sample #1 Sample #2
Par, Inc. Rap, Ltd.
Sample Size n1 = 120 balls n2 = 80 balls
Mean = 235 yards = 218 yards
Standard Dev. s1 = ___yards s2 =____ yards
x1 2x
10. 10
Point Estimate of the Difference Between Two
Population Means
µ1 = mean distance for the population of
Par, Inc. golf balls
µ2 = mean distance for the population of
Rap, Ltd. golf balls
Point estimate of µ1 - µ2 = = 235 - 218 = 17 yards.x x1 2−
Example: Par, Inc.
11. 11
Point Estimator of the Difference Between
the Means of Two Populations
Population 1Population 1
Par, Inc. Golf BallsPar, Inc. Golf Balls
µµ11 = mean driving= mean driving
distance of Pardistance of Par
golf ballsgolf balls
Population 1Population 1
Par, Inc. Golf BallsPar, Inc. Golf Balls
µµ11 = mean driving= mean driving
distance of Pardistance of Par
golf ballsgolf balls
Population 2Population 2
Rap, Ltd. Golf BallsRap, Ltd. Golf Balls
µµ22 = mean driving= mean driving
distance of Rapdistance of Rap
golf ballsgolf balls
Population 2Population 2
Rap, Ltd. Golf BallsRap, Ltd. Golf Balls
µµ22 = mean driving= mean driving
distance of Rapdistance of Rap
golf ballsgolf balls
µµ11 –– µµ22 = difference between= difference between
the mean distancesthe mean distances
Simple random sampleSimple random sample
ofof nn11 Par golf ballsPar golf balls
xx11 = sample mean distance= sample mean distance
for sample of Par golf ballfor sample of Par golf ball
Simple random sampleSimple random sample
ofof nn11 Par golf ballsPar golf balls
xx11 = sample mean distance= sample mean distance
for sample of Par golf ballfor sample of Par golf ball
Simple random sampleSimple random sample
ofof nn22 Rap golf ballsRap golf balls
xx22 = sample mean distance= sample mean distance
for sample of Rap golf ballfor sample of Rap golf ball
Simple random sampleSimple random sample
ofof nn22 Rap golf ballsRap golf balls
xx22 = sample mean distance= sample mean distance
for sample of Rap golf ballfor sample of Rap golf ball
xx11 -- xx22 = Point Estimate of= Point Estimate of µµ11 –– µµ22
12. 12
95% Confidence Interval Estimate of the Difference
Between Two Population Means: Large-Sample Case,
σ1 and σ2 Unknown
Substituting the sample standard deviations for
the population standard deviation:
= ___________ or 11.86 yards to 22.14 yards.
We are 95% confident that the difference between the
mean driving distances of Par, Inc. balls and Rap, Ltd.
balls lies in the interval of _______________ yards.
x x z
n n
1 2 2
1
2
1
2
2
2
2 2
17 1 96
15
120
20
80
− ± + = ± +α
σ σ
/ .
( ) ( )
Example: Par, Inc.
13. 13
Interval Estimate of µ1 - µ2:
Small-Sample Case (n1 < 30 and/or n2 < 30)
Interval Estimate with σ 2
Known (and equal)
where:
x x z x x1 2 2 1 2
− ± −α σ/
σ σx x
n n1 2
2
1 2
1 1
− = +( )
14. 14
Interval Estimate with σ 2
Unknown (and assumed
equal)
where:
and the degrees of freedom for the t-distribution is
n1+n2-2.
Interval Estimate of µ1 - µ2:
Small-Sample Case (n1 < 30 and/or n2 < 30)
x x t sx x1 2 2 1 2
− ± −α /
s
n s n s
n n
2 1 1
2
2 2
2
1 2
1 1
2
=
− + −
+ −
( ) ( )
s s
n n
x x1 2
2
1 2
1 1
− = +( )
15. 15
Example: Specific Motors
Specific Motors of Detroit has developed a new
automobile known as the M car. 12 M cars and 8 J cars
(from Japan) were road tested to compare miles-per-
gallon (mpg) performance. The sample statistics are:
Sample #1 Sample #2
M Cars J Cars
Sample Size n1 = 12 cars n2 = 8 cars
Mean = 29.8 mpg = 27.3 mpg
Standard Deviation s1 = ____ mpg s2 = ____ mpg
x2x1
16. 16
Point Estimate of the Difference Between Two
Population Means
µ1 = mean miles-per-gallon for the population of
M cars
µ2 = mean miles-per-gallon for the population of
J cars
Point estimate of µ1 - µ2 = = ________ = ___ mpg.x x1 2−
Example: Specific Motors
17. 17
95% Confidence Interval Estimate of the Difference
Between Two Population Means: Small-Sample Case
We will make the following assumptions:
– The miles per gallon rating must be normally
distributed for both the M car and the J car.
– The variance in the miles per gallon rating must
be the same for both the M car and the J car.
Example: Specific Motors
18. 18
n 95% Confidence Interval Estimate of the Difference
Between Two Population Means: Small-Sample Case
Using the t distribution with n1 + n2 - 2 = ___ degrees
of freedom, the appropriate t value is t.025 = ______.
We will use a weighted average of the two sample
variances as the pooled estimator of σ 2
.
Example: Specific Motors
19. 19
95% Confidence Interval Estimate of the Difference
Between Two Population Means: Small-Sample Case
= _____________, or .3 to 4.7 miles per gallon.
We are 95% confident that the difference between the
mean mpg ratings of the two car types is from .3 to
4.7 mpg (with the M car having the higher mpg).
s
n s n s
n n
2 1 1
2
2 2
2
1 2
2 2
1 1
2
11 2 56 7 1 81
12 8 2
5 28=
− + −
+ −
=
+
+ −
=
( ) ( ) ( . ) ( . )
.
x x t s
n n
1 2 025
2
1 2
1 1
2 5 2 101 5 28
1
12
1
8
− ± + = ± +. ( ) . . . ( )
Example: Specific Motors
20. 20
Hypotheses
H0: µ1- µ2 < 0 H0: µ1 - µ2 > 0 H0: µ1- µ2 = 0
Ha: µ1- µ2 > 0 Ha: µ1 - µ2 < 0 Ha: µ1- µ2 ≠ 0
Test Statistic
Large-Sample Small-Sample
Hypothesis Tests About the Difference
between the Means of Two Populations:
Independent Samples
z
x x
n n
=
− − −
+
( ) ( )1 2 1 2
1
2
1 2
2
2
µ µ
σ σ
t
x x
s n n
=
− − −
+
( ) ( )
( )
1 2 1 2
2
1 21 1
µ µ
21. 21
Hypothesis Tests About the Difference between the
Means of Two Populations: Large-Sample Case
Par, Inc. is a manufacturer of golf equipment and has
developed a new golf ball that has been designed to
provide “extra distance.” In a test of driving distance
using a mechanical driving device, a sample of Par
golf balls was compared with a sample of golf balls
made by Rap, Ltd., a competitor. The sample
statistics appear on the next slide.
Example: Par, Inc.
22. 22
Hypothesis Tests About the Difference Between the
Means of Two Populations: Large-Sample Case
– Sample Statistics
Sample #1 Sample #2
Par, Inc. Rap, Ltd.
Sample Size n1 = 120 balls n2 = 80 balls
Mean = 235 yards = 218 yards
Standard Dev. s1 = ____ yards s2 = ____ yards
Example: Par, Inc.
x1 x2
23. 23
Hypothesis Tests About the Difference Between the
Means of Two Populations: Large-Sample Case
Can we conclude, using a .01 level of
significance, that the mean driving distance of Par,
Inc. golf balls is greater than the mean driving
distance of Rap, Ltd. golf balls?
Example: Par, Inc.
24. 24
n Hypothesis Tests About the Difference Between the
Means of Two Populations: Large-Sample Case
µ1 = mean distance for the population of Par, Inc.
golf balls
µ2 = mean distance for the population of Rap, Ltd.
golf balls
•Hypotheses H0: µ1 - µ2 < 0
Ha: µ1 - µ2 > 0
Example: Par, Inc.Example: Par, Inc.
25. 25
Hypothesis Tests About the Difference Between the
Means of Two Populations: Large-Sample Case
– Rejection Rule
Reject H0 if z > ________
z
x x
n n
=
− − −
+
=
− −
+
= =
( ) ( ) ( )
( ) ( ) .
.1 2 1 2
1
2
1
2
2
2
2 2
235 218 0
15
120
20
80
17
2 62
6 49
µ µ
σ σ
Example: Par, Inc.
26. 26
n Hypothesis Tests About the Difference Between the
Means of Two Populations: Large-Sample Case
• Conclusion
Reject H0. We are at least 99% confident that the
mean driving distance of Par, Inc. golf balls is
greater than the mean driving distance of Rap,
Ltd. golf balls.
Example: Par, Inc.Example: Par, Inc.
27. 27
Hypothesis Tests About the Difference Between the
Means of Two Populations: Small-Sample Case
Can we conclude, using a .05 level of
significance, that the miles-per-gallon (mpg)
performance of M cars is greater than the miles-per-
gallon performance of J cars?
Example: Specific Motors
28. 28
n Hypothesis Tests About the Difference Between the
Means of Two Populations: Small-Sample Case
µ1 = mean mpg for the population of M cars
µ2 = mean mpg for the population of J cars
•Hypotheses H0: µ1 - µ2 < 0
Ha: µ1 - µ2 > 0
Example: Specific MotorsExample: Specific Motors
29. 29
Example: Specific Motors
Hypothesis Tests About the Difference Between the
Means of Two Populations: Small-Sample Case
– Rejection Rule
Reject H0 if t > _______
(a = .05, d.f. = 18)
– Test Statistic
where:
t
x x
s n n
=
− − −
+
( ) ( )
( )
1 2 1 2
2
1 21 1
µ µ
2 2
2 1 1 2 2
1 2
( 1) ( 1)
2
n s n s
s
n n
− + −
=
+ −
30. 30
Inference About the Difference between the
Means of Two Populations: Matched Samples
With a matched-sample design each sampled item
provides a pair of data values.
The matched-sample design can be referred to as
blocking.
This design often leads to a smaller sampling error
than the independent-sample design because
variation between sampled items is eliminated as a
source of sampling error.
31. 31
Example: Express Deliveries
Inference About the Difference between the Means of
Two Populations: Matched Samples
A Chicago-based firm has documents that must
be quickly distributed to district offices throughout
the U.S. The firm must decide between two delivery
services, UPX (United Parcel Express) and INTEX
(International Express), to transport its documents.
In testing the delivery times of the two services, the
firm sent two reports to a random sample of ten
district offices with one report carried by UPX and
the other report carried by INTEX.
Do the data that follow indicate a difference in
mean delivery times for the two services?
32. 32
Delivery Time (Hours)
District Office UPX INTEX Difference
Seattle 32 25 7
Los Angeles 30 24 6
Boston 19 15 4
Cleveland 16 15 1
New York 15 13 2
Houston 18 15 3
Atlanta 14 15 -1
St. Louis 10 8 2
Milwaukee 7 9 -2
Denver 16 11 5
Example: Express Deliveries
33. 33
Inference About the Difference between the Means of
Two Populations: Matched Samples
Let µd= the mean of the difference values for the
two delivery services for the population of
district offices
– Hypotheses
H0: µd= 0, Ha: µd ≠ 0
Example: Express Deliveries
34. 34
n Inference About the Difference between the Means of
Two Populations: Matched Samples
• Rejection Rule
Assuming the population of difference values is
approximately normally distributed, the t
distribution with n - 1 degrees of freedom applies.
With α = .05, t.025 = 2.262 (9 degrees of freedom).
Reject H0 if t < _________ or if t > __________
Example: Express DeliveriesExample: Express Deliveries
35. 35
Inference About the Difference between the Means of
Two Populations: Matched Samples
d
d
n
i
=
∑
=
+ + +
=
( ... )
.
7 6 5
10
2 7
s
d d
n
d
i
=
−∑
−
= =
( ) .
.
2
1
76 1
9
2 9
t
d
s n
d
d
=
−
=
−
=
µ 2 7 0
2 9 10
2 94
.
.
.
Example: Express Deliveries
36. 36
n Inference About the Difference between the Means of
Two Populations: Matched Samples
• Conclusion
Reject H0.
There is a significant difference between the mean
delivery times for the two services.
Example: Express DeliveriesExample: Express Deliveries
37. 37
Introduction to Analysis of Variance
Analysis of Variance (ANOVA) can be used to test
for the equality of three or more population means
using data obtained from observational or
experimental studies.
We want to use the sample results to test the
following hypotheses.
H0: µ1 = µ2 = µ3 = . . .= µk
Ha: Not all population means are equal
38. 38
Introduction to Analysis of Variance
n If H0 is rejected, we cannot conclude that all
population means are different.
n Rejecting H0 means that at least two population
means have different values.
39. 39
Assumptions for Analysis of Variance
For each population, the response variable is normally
distributed.
The variance of the response variable, denoted σ 2
, is
the same for all of the populations.
The observations must be independent.
40. 40
Analysis of Variance:
Testing for the Equality of k Population Means
Between-Treatments Estimate of Population Variance
Within-Treatments Estimate of Population Variance
Comparing the Variance Estimates: The F Test
The ANOVA Table
41. 41
A between-treatment estimate of σ 2
is called the
mean square treatment and is denoted MSTR.
The numerator of MSTR is called the sum of squares
treatment and is denoted SSTR.
The denominator of MSTR represents the degrees of
freedom associated with SSTR.
Between-Treatments Estimate
of Population Variance
1
)(
MSTR
1
2
−
−
=
∑=
k
xxn
k
j
jj
42. 42
The estimate of σ 2
based on the variation of the
sample observations within each sample is called the
mean square error and is denoted by MSE.
The numerator of MSE is called the sum of squares
error and is denoted by SSE.
The denominator of MSE represents the degrees of
freedom associated with SSE.
Within-Samples Estimate
of Population Variance
kn
sn
T
k
j
jj
−
−
=
∑=1
2
)1(
MSE
43. 43
Comparing the Variance Estimates: The F Test
If the null hypothesis is true and the ANOVA
assumptions are valid, the sampling distribution of
MSTR/MSE is an F distribution with MSTR d.f. equal
to k - 1 and MSE d.f. equal to nT - k.
If the means of the k populations are not equal, the
value of MSTR/MSE will be inflated because MSTR
overestimates σ 2
.
Hence, we will reject H0 if the resulting value of
MSTR/MSE appears to be too large to have been
selected at random from the appropriate F
distribution.
44. 44
Test for the Equality of k Population Means
Hypotheses
H0: µ1 = µ2 = µ3 = . . .= µk
Ha: Not all population means are equal
Test Statistic
F = MSTR/MSE
Rejection Rule
Reject H0 if F > Fα
where the value of Fα is based on an F distribution with
k - 1 numerator degrees of freedom and nT - 1
denominator degrees of freedom.
45. 45
Sampling Distribution of MSTR/MSE
The figure below shows the rejection region associated
with a level of significance equal to α where Fα denotes
the critical value.
Do Not Reject H0 Reject H0
MSTR/MSE
Critical Value
Fα
46. 46
ANOVA Table
Source of Sum of Degrees of Mean
Variation Squares Freedom Squares F
Treatment SSTR k - 1 MSTR MSTR/MSE
Error SSE nT- k MSE
Total SST nT - 1
SST divided by its degrees of freedom nT - 1 is simply
the overall sample variance that would be obtained if
we treated the entire nT observations as one data set.
∑∑= =
+=−=
k
j
n
i
ij
j
xx
1 1
2
SSESSTR)(SST
47. 47
Example: Reed Manufacturing
Analysis of Variance
J. R. Reed would like to know if the mean
number of hours worked per week is the same for the
department managers at her three manufacturing
plants (Buffalo, Pittsburgh, and Detroit).
A simple random sample of 5 managers from
each of the three plants was taken and the number of
hours worked by each manager for the previous
week is shown on the next slide.
49. 49
Analysis of Variance
– Hypotheses
H0: µ1 = µ2 = µ3
Ha: Not all the means are equal
where:
µ1 = mean number of hours worked per
week by the managers at Plant 1
µ2= mean number of hours worked per
week by the managers at Plant 2
µ3 = mean number of hours worked per
week by the managers at Plant 3
Example: Reed Manufacturing
50. 50
Analysis of Variance
– Mean Square Treatment
Since the sample sizes are all equal
x = (55 + 68 + 57)/3 = ____
SSTR = 5(55 - 60)2
+ 5(68 - 60)2
+ 5(57 - 60)2
= ____
MSTR = 490/(3 - 1) = 245
– Mean Square Error
SSE = 4(26.0) + 4(26.5) + 4(24.5) = _____
MSE = 308/(15 - 3) = 25.667
=
Example: Reed Manufacturing
51. 51
Analysis of Variance
– F - Test
If H0 is true, the ratio MSTR/MSE should be near
1 since both MSTR and MSE are estimating σ 2
. If
Hais true, the ratio should be significantly larger
than 1 since MSTR tends to overestimate σ 2
.
Example: Reed Manufacturing
52. 52
n Analysis of Variance
•Rejection Rule
Assuming α = .05, F.05 = 3.89 (2 d.f. numerator,
12 d.f. denominator). Reject H0 if F > _______
•Test Statistic
F = MSTR/MSE = 245/25.667 = _______
Example: Reed ManufacturingExample: Reed Manufacturing
53. 53
Analysis of Variance
– ANOVA Table
Source of Sum of Degrees of Mean
Variation Squares Freedom Square F
Treatments 490 2 245 9.55
Error 308 12 25.667
Total 798 14
Example: Reed Manufacturing
54. 54
n Analysis of Variance
•Conclusion
F = 9.55 > F.05 = _____, so we reject H0. The mean
number of hours worked per week by department
managers is not the same at each plant.
Example: Reed ManufacturingExample: Reed Manufacturing