Kshivets aats new_york2019

Survival of Esophageal Cancer Patients was Significantly Superior in Comparison with Cardioesophageal Cancer Patients after Surgery Kshivets Oleg Surgery Department, Roshal Hospital, Moscow, Russia OBJECTIVE: This study aimed to determine localization influence of tumor for 5-year survival (5YS) of esophageal (EC) or cardioesophageal (CC) cancer patients (ECP, CEP) after complete en block (R0) esophagogastrectomies (EG) through left/right thoracoabdominal incision. METHODS: We analyzed data of 543 consecutive patients (age=56.4±8.8 years; tumor size=6±3.5 cm) radically operated (R0) and monitored in 1975-2019 (m=405, f=138; ECP=259, CEP=284; esophagogastrectomies (EG) Garlock=280, EG Lewis=263, combined EG with resection of pancreas, liver, diaphragm, aorta, VCS, colon transversum, lung, trachea, pericardium, splenectomy=151; adenocarcinoma=308, squamous=225, mix=10; T1=126, T2=114, T3=178, T4=125; N0=275, N1=69, N2=199; G1=157, G2=139, G3=247; early EC=107, invasive=436; only surgery=420, adjuvant chemoimmunoradiotherapy-AT=123: 5-FU+thymalin/taktivin+radiotherapy 45-50Gy). Multivariate Cox modeling, clustering, SEPATH, Monte Carlo, bootstrap and neural networks computing were used to determine any significant dependence. RESULTS: Overall life span (LS) was 1892.4±2241 days and cumulative 5-year survival (5YS) reached 51.9%, 10 years – 45.7%, 20 years – 33.5%. 183 ECP lived more than 5 years (LS=4311±2419.7 days), 98 ECP – more than 10 years (LS=5903.4±2299.4 days). 224 died because of EC/CC (LS=629.2±320.1 days). 5YS of ECP (67.3%, LS=2605±2628.9 days) was significantly superior in comparison with CEP (36.4%, LS=1242.6±1558.5 days) (P=0.00000 by log-rank test). AT significantly improved 5YS (68.2% vs. 48.5%) (P=0.00033 by log-rank test). Cox modeling displayed that 5YS of ECP/CEP significantly depended on: phase transition (PT) N0—N12 in terms of synergetics, cell ratio factors (ratio between cancer cells- CC and blood cells subpopulations), T, G, histology, age, AT, localization, blood cells, prothrombin index, coagulation time, residual nitrogen, blood group, Rh, glucose, protein (P=0.000-0.008). Neural networks, genetic algorithm selection and bootstrap simulation revealed relationships between 5YS and healthy cells/CC (rank=1), PT early-invasive EC (rank=2), PT N0—N12 (rank=3), erythrocytes/CC (4), thrombocytes/CC (5), stick neutrophils/CC (6), lymphocytes/CC (7), segmented neutrophils/CC (8), eosinophils/CC (9), leucocytes/CC (10), monocytes/CC (11). Correct prediction of 5YS was 100% by neural networks computing (area under ROC curve=1.0; error=0.0).

Recommended
More Related Content
What's hot
What's hot (20)
Similar to Kshivets aats new_york2019
Similar to Kshivets aats new_york2019 (20)
More from Oleg Kshivets
More from Oleg Kshivets (11)
Recently uploaded
Recently uploaded (20)
Kshivets aats new_york2019
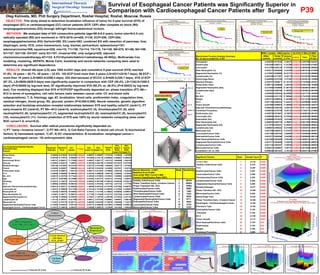
- 1. Survival of Esophageal Cancer Patients was Significantly Superior in Comparison with Cardioesophageal Cancer Patients after Surgery P39 Oleg Kshivets, MD, PhD Surgery Department, Roshal Hospital, Roshal, Moscow, Russia OBJECTIVE: This study aimed to determine localization influence of tumor for 5-year survival (5YS) of esophageal (EC) or cardioesophageal (CC) cancer patients (ECP, CEP) after complete en block (R0) esophagogastrectomies (EG) through left/right thoracoabdominal incision. METHODS: We analyzed data of 543 consecutive patients (age=56.4±8.8 years; tumor size=6±3.5 cm) radically operated (R0) and monitored in 1975-2019 (m=405, f=138; ECP=259, CEP=284; esophagogastrectomies (EG) Garlock=280, EG Lewis=263, combined EG with resection of pancreas, liver, diaphragm, aorta, VCS, colon transversum, lung, trachea, pericardium, splenectomy=151; adenocarcinoma=308, squamous=225, mix=10; T1=126, T2=114, T3=178, T4=125; N0=275, N1=69, N2=199; G1=157, G2=139, G3=247; early EC=107, invasive=436; only surgery=420, adjuvant chemoimmunoradiotherapy-AT=123: 5-FU+thymalin/taktivin+radiotherapy 45-50Gy). Multivariate Cox modeling, clustering, SEPATH, Monte Carlo, bootstrap and neural networks computing were used to determine any significant dependence. RESULTS: Overall life span (LS) was 1892.4±2241 days and cumulative 5-year survival (5YS) reached 51.9%, 10 years – 45.7%, 20 years – 33.5%. 183 ECP lived more than 5 years (LS=4311±2419.7 days), 98 ECP – more than 10 years (LS=5903.4±2299.4 days). 224 died because of EC/CC (LS=629.2±320.1 days). 5YS of ECP (67.3%, LS=2605±2628.9 days) was significantly superior in comparison with CEP (36.4%, LS=1242.6±1558.5 days) (P=0.00000 by log-rank test). AT significantly improved 5YS (68.2% vs. 48.5%) (P=0.00033 by log-rank test). Cox modeling displayed that 5YS of ECP/CEP significantly depended on: phase transition (PT) N0— N12 in terms of synergetics, cell ratio factors (ratio between cancer cells- CC and blood cells subpopulations), T, G, histology, age, AT, localization, blood cells, prothrombin index, coagulation time, residual nitrogen, blood group, Rh, glucose, protein (P=0.000-0.008). Neural networks, genetic algorithm selection and bootstrap simulation revealed relationships between 5YS and healthy cells/CC (rank=1), PT early-invasive EC (rank=2), PT N0—N12 (rank=3), erythrocytes/CC (4), thrombocytes/CC (5), stick neutrophils/CC (6), lymphocytes/CC (7), segmented neutrophils/CC (8), eosinophils/CC (9), leucocytes/CC (10), monocytes/CC (11). Correct prediction of 5YS was 100% by neural networks computing (area under ROC curve=1.0; error=0.0). CONCLUSIONS: Survival after radical procedures significantly depended on: 1) PT “early—invasive cancer”; 2) PT N0—N12; 3) Cell Ratio Factors; 4) blood cell circuit; 5) biochemical factors; 6) hemostasis system; 7) AT; 8) EC characteristics; 9) localization: esophageal cancer— cardioesophageal cancer; 10) anthropometric data. Survival Function General Esophageal Cancer Patients Survival, n=543 5-Year Survival=51.9%; 10-Year Survival=45.7%; 20-Year Survival=33.5% Complete Censored -5 0 5 10 15 20 25 30 35 40 Years after Esophagogastrectomies 0.1 0.2 0.3 0.4 0.5 0.6 0.7 0.8 0.9 1.0 CumulativeProportionSurviving Cumulative Proportion Surviving (Kaplan-Meier) 5-Year Survival of Early ECP=100; 5-Year Survival of Invasive ECP=38.5%, P=0.00000 by Log-Rank Test Complete Censored 0 5 10 15 20 25 30 35 40 Years after Esophagogastrectomies 0.0 0.1 0.2 0.3 0.4 0.5 0.6 0.7 0.8 0.9 1.0 CumulativeProportionSurviving Invasive ECP, n=436 Early ECP, n=107 Cumulative Proportion Surviving (Kaplan-Meier) 5-Year Survival of ECP with N0=73.9%; 5-Year Survival of ECP with N1-2=27.5% P=0.00000 by Log-Rank Test Complete Censored 0 5 10 15 20 25 30 35 40 Years after Esophagogastrectomies 0.0 0.1 0.2 0.3 0.4 0.5 0.6 0.7 0.8 0.9 1.0 CumulativeProportionSurviving ECP with N1-2, n=268 ECP with N0, n=275 Cumulative Proportion Surviving (Kaplan-Meier) 5-Year Survival of ECP after Adjuvant Treatment=68.2%; 5-Year Survival of ECP after Surgery alone=48.5%; P=0.00033 by Log-Rank Test Complete Censored 0 5 10 15 20 25 30 35 40 Years after Esophagogastrectomies 0.1 0.2 0.3 0.4 0.5 0.6 0.7 0.8 0.9 1.0 CumulativeProportionSurviving Adjuvant Chemoimmunoradiotherapy, n=123 Only Surgery, n=420 Cox Proportional Hazards Results; ECP/CECP=543; Factors: Parameter Estimate Standard Error Chi- square P value 95% Lower CL 95% Upper CL Hazard Ratio 95% Hazard Ratio Lower CL 95% Hazard Ratio Upper CL Blood Group 0.24084 0.072842 10.93155 0.000945 0.09807 0.383607 1.272315 1.103040 1.467569 Rh-Factor -0.56749 0.179791 9.96289 0.001597 -0.91988 -0.215110 0.566944 0.398567 0.806453 Hemorrhage Blood 0.00137 0.000411 11.17880 0.000827 0.00057 0.002177 1.001374 1.000568 1.002180 Glucose -0.22903 0.083815 7.46693 0.006284 -0.39330 -0.064756 0.795305 0.674823 0.937296 Residual Nitrogen 0.05126 0.012004 18.23193 0.000020 0.02773 0.074786 1.052594 1.028117 1.077653 Protein 0.02465 0.008997 7.50688 0.006146 0.00702 0.042284 1.024956 1.007041 1.043190 Prothrombin Index 0.01879 0.006672 7.93214 0.004856 0.00571 0.031867 1.018968 1.005730 1.032380 T1-4 0.40958 0.095588 18.35954 0.000018 0.22223 0.596926 1.506179 1.248855 1.816525 N0---N12 0.65015 0.163700 15.77344 0.000071 0.32930 0.970993 1.915823 1.389996 2.640565 Age 0.03171 0.007996 15.72396 0.000073 0.01603 0.047377 1.032214 1.016164 1.048517 Histology -0.34331 0.130570 6.91333 0.008556 -0.59922 -0.087398 0.709419 0.549239 0.916313 G1-3 0.39994 0.089500 19.96816 0.000008 0.22452 0.575354 1.491732 1.251723 1.777760 Adjuvant Chemoimmunoradiotherapy -0.98414 0.202411 23.64005 0.000001 -1.38086 -0.587424 0.373760 0.251362 0.555757 Leucocytes tot -1.40161 0.356959 15.41769 0.000086 -2.10124 -0.701985 0.246200 0.122305 0.495601 Eosinophils tot 1.42230 0.366785 15.03692 0.000105 0.70341 2.141185 4.146644 2.020639 8.509513 Stick Neutrophils tot 1.41661 0.359711 15.50931 0.000082 0.71159 2.121628 4.123112 2.037224 8.344714 Segmented Neutrophils tot 1.42786 0.356560 16.03634 0.000062 0.72901 2.126702 4.169756 2.073034 8.387157 Lymphocytes tot 1.37115 0.358701 14.61190 0.000132 0.66811 2.074194 3.939891 1.950551 7.958130 Monocytes tot 1.31857 0.370179 12.68771 0.000368 0.59303 2.044109 3.738076 1.809469 7.722272 Segmented Neutrophils/Cancer Cells -0.13490 0.045343 8.85118 0.002929 -0.22377 -0.046029 0.873803 0.799498 0.955014 Esophageal Cancer---Cardioesophageal Cancer 0.31674 0.140910 5.05257 0.024589 0.04056 0.592914 1.372640 1.041392 1.809253 Cumulative Proportion Surviving (Kaplan-Meier) 5-Year Survival of ECP=67.3%; 5-Year Survival of CECP=36.4%; P=0.000 by Log-Rank Test Complete Censored 0 5 10 15 20 25 30 35 40 Years after Esophagogastrectomies 0.0 0.1 0.2 0.3 0.4 0.5 0.6 0.7 0.8 0.9 1.0 CumulativeProportionSurviving ECP=259 CECP=284 Discriminant Function Analysis Summary: No. of vars in model=32; n=407 Wilks' Lambda: .39522 approx. F (32,374)=17.885 p<0.0000 Wilks' Lambda Partial Lambda F-remove (1,374) p-value Toler. 1-Toler. (R-Sqr.) Hemoglobin 0.405250 0.975248 9.49213 0.002216 0.359799 0.640201 Erythrocytes 0.407808 0.969131 11.91296 0.000621 0.024344 0.975657 Leucocytes 0.413786 0.955129 17.57030 0.000035 0.000405 0.999595 Stick Neutrophils (%) 0.401817 0.983580 6.24345 0.012894 0.081515 0.918486 Segmented Neutrophils (%) 0.412991 0.956969 16.81737 0.000051 0.010315 0.989685 Lymphocytes (%) 0.404156 0.977887 8.45715 0.003853 0.010516 0.989484 Hemorrhage Blood 0.404068 0.978100 8.37382 0.004030 0.843012 0.156988 Residual Nitrogen 0.438737 0.900811 41.18147 0.000000 0.742369 0.257631 Prothrombin Index 0.399773 0.988609 4.30916 0.038590 0.836103 0.163898 Segmented Neutrophils (abs) 0.417926 0.945668 21.48770 0.000005 0.000587 0.999413 Lymphocytes (abs) 0.407544 0.969759 11.66284 0.000708 0.002901 0.997099 T1-4 0.436492 0.905444 39.05685 0.000000 0.541731 0.458269 N0--N12 0.424456 0.931120 27.66664 0.000000 0.704162 0.295838 Weight 0.407512 0.969834 11.63306 0.000719 0.011910 0.988090 G1-3 0.407735 0.969303 11.84421 0.000644 0.835999 0.164001 Tumor Growth 0.407466 0.969943 11.58955 0.000735 0.653263 0.346737 Adjuvant Chemoimmunoradiotherapy 0.400524 0.986755 5.02014 0.025641 0.911147 0.088853 Combined Procedures 0.405038 0.975759 9.29132 0.002466 0.720317 0.279683 Erythrocytes (tot) 0.405575 0.974467 9.79976 0.001883 0.008919 0.991081 Leucocytes (tot) 0.409886 0.964218 13.87926 0.000225 0.000036 0.999964 Eosinophils (tot) 0.405589 0.974434 9.81255 0.001870 0.010102 0.989898 Stick Neutrophils (tot) 0.400922 0.985776 5.39657 0.020712 0.003166 0.996834 Segmented Neutrophils (tot) 0.411970 0.959341 15.85091 0.000082 0.000068 0.999933 Lymphocytes (tot) 0.408867 0.966622 12.91450 0.000370 0.000381 0.999619 Monocytes (tot) 0.407706 0.969373 11.81657 0.000653 0.005423 0.994577 Leucocytes/Cancer Cells 0.401196 0.985102 5.65605 0.017897 0.000009 0.999991 Eosinophils/Cancer Cells 0.401077 0.985396 5.54290 0.019072 0.009880 0.990120 Stick Neutrophils/Cancer Cells 0.401480 0.984406 5.92440 0.015400 0.008813 0.991187 Segmented Neutrophils/Cancer Cells 0.401377 0.984659 5.82676 0.016264 0.000025 0.999975 Lymphocytes/Cancer Cells 0.401133 0.985257 5.59635 0.018507 0.000082 0.999918 Monocytes/Cancer Cells 0.400441 0.986961 4.94101 0.026824 0.001509 0.998491 Localization: EC vs. CEC 0.400283 0.987351 4.79143 0.029219 0.929113 0.070887 Neural Networks: n=407; Baseline Error=0.000; Area under ROC Curve=1.000; Correct Classification Rate=100% Rank Sensitivity Healthy Cells/Cancer Cells Phase Transition Early---Invasive Cancer Phase Transition N0---N12 Erythrocytes/Cancer Cells Thrombocytes/Cancer Cells Stick Neutrophils/Cancer Cells Lymphocytes/Cancer Cells Segmented Neutrophils/Cancer Cells Eosinophils/Cancer Cells Leucocytes/Cancer Cells Monocytes/Cancer Cells 1 2 3 4 5 6 7 8 9 10 11 28794 20554 16562 8666 7464 7425 5836 5771 4024 3734 3230 Significant Factors Rank Kendal Tau-A P Tumor Size 1 -0.316 0.000 Healthy Cells/Cancer Cells 2 0.315 0.000 T1-4 3 -0.307 0.000 Erythrocytes/Cancer Cells 4 0.307 0.000 Leucocytes/Cancer Cells 5 0.298 0.000 Thrombocytes/Cancer Cells 6 0.293 0.000 Lymphocytes/Cancer Cells 7 0.289 0.000 Segmented Neutrophils/Cancer Cells 8 0.280 0.000 Residual Nitrogen 9 -0.277 0.000 Phase Transition N0---N12 10 -0.248 0.000 Monocytes/Cancer Cells 11 0.240 0.000 Hemorrhage Time 12 -0.233 0.000 Phase Transition Early---Invasive Cancer 13 -0.225 0.000 Esophageal---Cardioesophageal Cancer 14 -0.194 0.000 Procedure Type 15 -0.192 0.000 Eosinophils/Cancer Cells 16 0.163 0.000 Chlorides 17 0.163 0.000 G1-3 18 -0.140 0.000 Tumor Growth 19 -0.117 0.001 Stick Neutrophils/Cancer Cells 20 0.105 0.01 Erythrocytes 21 0.103 0.01 Weight 22 0.100 0.01 Combined Procedure 23 0.098 0.01