Kshivets barcelona2016
•
287 likes•5,781 views

5-Year Survival of Gastric Cancer Patients after Radical Surgery was Significantly Depended on Tumor Characteristics, Blood Cell Circuit, Cell Ratio Factors, Hemostasis System and Adjuvant Treatment

Recommended
More Related Content
What's hot
What's hot (20)
Similar to Kshivets barcelona2016
Similar to Kshivets barcelona2016 (20)
More from Oleg Kshivets
More from Oleg Kshivets (12)
Recently uploaded
Recently uploaded (20)
Kshivets barcelona2016
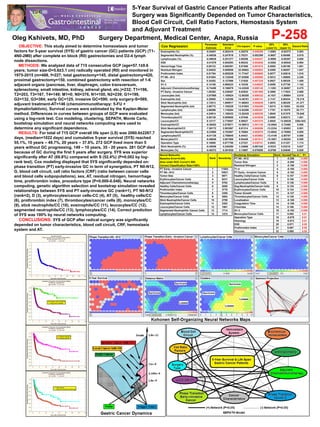
- 1. 5-Year Survival of Gastric Cancer Patients after Radical Surgery was Significantly Depended on Tumor Characteristics, Blood Cell Circuit, Cell Ratio Factors, Hemostasis System and Adjuvant Treatment OBJECTIVE: This study aimed to determine homeostasis and tumor factors for 5-year survival (5YS) of gastric cancer (GC) patients (GCP) (T1- 4N0-2M0) after complete en block (R0) gastrectomies and D2-4 lymph node dissections. METHODS: We analyzed data of 715 consecutive GCP (age=57.1±9.6 years; tumor size-D=5.6±3.1 cm) radically operated (R0) and monitored in 1975-2015 (m=488, f=227; total gastrectomy=145, distal gastrectomy=420, proximal gastrectomy=150, combined gastrectomy with resection of 1-6 adjacent organs (pancreas, liver, diaphragm, colon transversum, splenectomy, small intestine, kidney, adrenal gland, etc.)=232; T1=196, T2=203, T3=167, T4=149; M1=0; N0=376, N1=100, N2=239; G1=199, G2=132, G3=384; early GC=125, invasive GC=590; only surgery-S=569, adjuvant treatment-AT=146 (chemoimmunotherapy: 5-FU + thymalin/taktivin). Survival curves were estimated by the Kaplan-Meier method. Differences in curves between groups of GCP were evaluated using a log-rank test. Cox modeling, clustering, SEPATH, Monte Carlo, bootstrap simulation and neural networks computing were used to determine any significant dependence. RESULTS: For total of 715 GCP overall life span (LS) was 2060.6±2267.7 days, (median=1022 days) and cumulative 5-year survival (5YS) reached 55.1%, 10 years – 48.7%, 20 years – 37.6%. 272 GCP lived more than 5 years without GC progressing, 149 – 10 years, 35 - 20 years. 281 GCP died because of GC during the first 5 years after surgery. 5YS was superior significantly after AT (69.8%) compared with S (52.4%) (P=0.002 by log- rank test). Cox modeling displayed that 5YS significantly depended on: phase transition (PT) early-invasive GC in term of synergetics, PT N0-N12, G, blood cell circuit, cell ratio factors (CRF) (ratio between cancer cells and blood cells subpopulations), sex, AT, residual nitrogen, hemorrhage time, prothrombin index, procedure type (P=0.000-0.048). Neural networks computing, genetic algorithm selection and bootstrap simulation revealed relationships between 5YS and PT early-invasive GC (rank=1), PT N0-N12 (rank=2), D (3), erythrocytes/cancer cells-CC (4), AT (5), healthy cells/CC (6), prothrombin index (7), thrombocytes/cancer cells (8), monocytes/CC (9), stick neutrophils/CC (10), eosinophils/CC (11), leucocytes/CC (12), segmented neutrophils/CC (13), lymphocytes/CC (14). Correct prediction of 5YS was 100% by neural networks computing. CONCLUSIONS: 5YS of GCP after radical surgery was significantly depended on tumor characteristics, blood cell circuit, CRF, hemostasis system and AT. Oleg Kshivets, MD, PhD Surgery Department, Medical Center, Anapa, Russia P-258 Cox Regression Parameter Estimate Standard Error Chi-square P value 95% Lower CL 95% Upper CL Hazard Ratio Eosinophils (%) -0.54001 0.263410 4.20278 0.040358 -1.0563 -0.02373 0.583 Segmented Neutrophils (%) -0.48036 0.247618 3.76331 0.052389 -0.9657 0.00496 0.619 Lymphocytes (%) -0.49636 0.251277 3.90206 0.048227 -0.9889 -0.00387 0.609 ESS -0.01579 0.005293 8.90242 0.002848 -0.0262 -0.00542 0.984 Hemorrhage Time 0.00123 0.000391 9.87506 0.001675 0.0005 0.00199 1.001 Residual Nitrogen 0.04625 0.009859 22.00602 0.000003 0.0269 0.06557 1.047 Prothrombin Index 0.01794 0.005229 11.77447 0.000600 0.0077 0.02819 1.018 PT N0---N12 0.81004 0.132049 37.63086 0.000000 0.5512 1.06885 2.248 Sex 0.34302 0.127690 7.21628 0.007225 0.0927 0.59329 1.409 G1-3 0.14158 0.069223 4.18338 0.040822 0.0059 0.27726 1.152 Adjuvant Chemoimmunotherapy -0.74498 0.196078 14.43549 0.000145 -1.1293 -0.36067 0.475 PT Early---Invasive Cancer 1.05392 0.339457 9.63932 0.001905 0.3886 1.71924 2.869 Leucocytes (tot) -3.97989 1.108824 12.88300 0.000332 -6.1531 -1.80664 0.019 Eosinophils (tot) 4.35950 1.145350 14.48761 0.000141 2.1147 6.60434 78.218 Stick Neutrophils (tot) 3.72513 1.090917 11.66003 0.000639 1.5870 5.86329 41.477 Segmented Neutrophils (tot) 3.98772 1.105228 13.01803 0.000309 1.8215 6.15393 53.932 Lymphocytes (tot) 3.96596 1.116264 12.62298 0.000381 1.7781 6.15379 52.771 Monocytes (tot) 4.24914 1.155433 13.52425 0.000236 1.9845 6.51375 70.045 Thrombocytes/CC 0.00138 0.000685 4.07046 0.043639 0.0000 0.00272 1.001 Leucocytes/CC 8.12117 2.770057 8.59527 0.003370 2.6920 13.55038 3364.943 Eosinophils/CC -9.36552 2.878071 10.58913 0.001138 -15.0064 -3.72460 0.000 Stick Neutrophils/CC -7.58172 2.883567 6.91314 0.008556 -13.2334 -1.93003 0.001 Segmented Neutrophils/CC -8.23960 2.783007 8.76564 0.003070 -13.6942 -2.78500 0.000 Lymphocytes/CC -8.01138 2.756945 8.44421 0.003662 -13.4149 -2.60787 0.000 Monocytes/CC -9.46646 3.001900 9.94449 0.001613 -15.3501 -3.58284 0.000 Operation Type 0.16080 0.077795 4.27221 0.038741 0.0083 0.31327 1.174 Stick Neutrophils (%) -0.45056 0.246290 3.34666 0.067342 -0.9333 0.03216 0.637 Monocytes (%) -0.46372 0.261830 3.13667 0.076550 -0.9769 0.04946 0.629 Neural Networks: Baseline Error=0.000; Area under ROC Curve=1.000; Correct Classification Rate=100% Rank Sensitivity PT Early---Invasive Cancer 1 11004 PT N0---N12 2 10821 Tumor Size 3 8971 Erythrocytes/Cancer Cells 4 6231 Adjuvant Chemoimmunotherapy 5 5762 Healthy Cells/Cancer Cells 6 5558 Prothrombin Index 7 3778 Thrombocytes/Cancer Cells 8 3350 Monocytes/Cancer Cells 9 2884 Stick Neutrophils/Cancer Cells 10 2799 Eosinophils/Cancer Cells 11 2302 Leucocytes/Cancer Cells 12 1981 Segmented Neutrophils/ Cancer Cells 13 1714 Lymphocytes/Cancer Cells 14 1474 Bootstrap Simulation Rank Kendall’Tau-A P< PT N0---N12 1 -0.206 0.000 Tumor Size 2 -0.200 0.000 Residual Nitrogen 3 -0.188 0.000 T1-4 4 -0.185 0.000 PT Early---Invasive Cancer 5 -0.162 0.000 Healthy Cells/Cancer Cells 6 0.157 0.000 Leucocytes/Cancer Cells 7 0.150 0.000 Lymphocytes/Cancer Cells 8 0.136 0.000 Seg.Neutrophils/Cancer Cells 9 0.135 0.000 Erythrocytes/Cancer Cells 10 0.134 0.000 Tumor Growth 11 -0.127 0.000 Thrombocytes/Cancer Cells 12 0.126 0.000 Localization 13 -0.109 0.000 Coagulation Time 14 -0.108 0.000 Chlorides 15 0.106 0.000 G1-3 16 -0.102 0.000 Monocytes/Cancer Cells 17 0.092 0.01 Operation Type 18 -0.079 0.01 Histology 19 -0.073 0.01 ESS 20 0.071 0.05 Prothrombin Index 21 0.067 0.05 Glucose 22 0.065 0.05