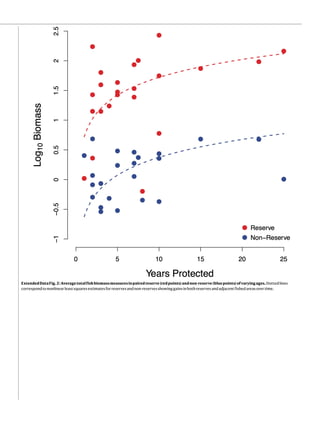
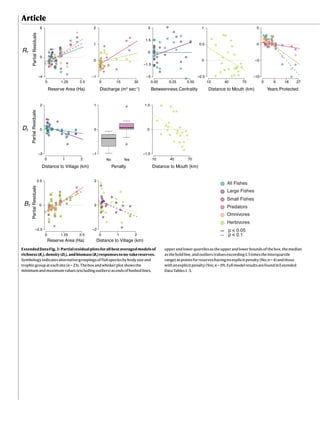
1) A network of 23 small, community-based reserves in Thailand's Salween River basin protected tropical river fish diversity and enhanced fish communities inside reserve boundaries.
2) Reserves increased fish species richness by 27%, density by 124%, and biomass by over 2,000% compared to adjacent fished areas. Larger bodied and herbivorous fish benefited most.
3) Reserve characteristics like size, enforcement, and connectivity predicted the magnitude of ecological benefits, following principles from marine reserve design. Larger reserves with strong enforcement near villages had greater positive impacts.
(ZARA) Call Girls Talegaon Dabhade ( 7001035870 ) HI-Fi Pune Escorts Service
Koning etal 2020
1. Nature | www.nature.com | 1
Article
Anetworkofgrassrootsreservesprotects
tropicalriverfishdiversity
Aaron A. Koning1,2,3 ✉, K. Martin Perales1
, Etienne Fluet-Chouinard1,4
& Peter B. McIntyre1,5
Intensivefisherieshavereducedfishbiodiversityandabundanceinaquatic
ecosystemsworldwide1–3
.‘No-take’marinereserveshavebecomeacornerstoneof
marineecosystem-basedfisheriesmanagement4–6
,andtheirbenefitsforadjacent
fisheriesaremaximizedwhenreservedesignfosterssynergiesamongnearby
reserves7,8
.Theapplicabilityofthismarinereservenetworkparadigmtoriverine
biodiversityandinlandfisheriesremainslargelyuntested.Hereweshowthatreserves
createdby23separatecommunitiesinThailand’sSalweenbasinhavemarkedly
increasedfishrichness,density,andbiomassrelativetoadjacentareas.Moreover,key
correlatesofthesuccessofprotectedareasinmarineecosystems—particularly
reservesizeandenforcement—predictdifferencesinecologicalbenefitsamong
riverinereserves.Occupyingacentralpositioninthenetworkconfersadditional
gains,underscoringtheimportanceofconnectivitywithindendriticriversystems.
Theemergenceofnetwork-basedbenefitsisremarkablegiventhatthesereservesare
young(lessthan25yearsold)andarosewithoutformalcoordination.Freshwater
ecosystemsareunder-representedamongtheworld’sprotectedareas9
,andour
findingssuggestthatnetworksofsmall,community-basedreservesoffera
generalizablemodelforprotectingbiodiversityandaugmentingfisheriesasthe
world’sriversfaceunprecedentedpressures10,11
.
Overharvesting of fisheries threatens thousands of species and the
food and nutrition security of hundreds of millions of people around
the world12–14
. Over the past several decades, no-take marine reserves
havebecomecentralmanagementtoolsforconservingmarineecosys-
temsandsustaininglocalfisheries5,7
.Thewidespreadsuccessofmarine
reservesinenhancingtheabundance,size,andbiomassoffishes4
has
guided the distillation of design principles that maximize both con-
servation efficacy within reserves8,15
and the export of harvestable
biomassacrosstheirboundaries7,16,17
.Thesuccessofindividualmarine
reservesinprovidingecologicalbenefitsvarieswidely18
,buttypically
increases with vigorous enforcement, complete bans on harvest,
time since establishment, large size, and high degree of isolation8,15
.
As catchable fish disperse across reserve borders, they can augment
nearbyfisheriesandlocallivelihoods,therebyprovidinganincentive
to respect reserve boundaries16
. Furthermore, gains in diversity and
biomasswithinareservecanbeamplifiedbyexchangeamongnearby
reserves7,16
, which has motivated the expansion of reserve networks
worldwide. To date, the reserve network paradigm remains untested
forhaltinghighratesofbiodiversityloss11
andbolsteringhumanfood
supplies from the world’s freshwater ecosystems.
Despiteholdingroughlyhalfofallfishspeciesandprovidingacces-
sible sources of animal protein and critical micronutrients to many
poor and undernourished populations12–14
, freshwater ecosystems
are not well represented by existing protected areas9
. Indeed, formal
protectionofriversandlakeshasbeenlargelylimitedtotheirincidental
inclusion within terrestrial reserves19,20
. Although terrestrial reserves
can provide watershed-level benefits, they often inadequately repre-
sentfreshwaterbiodiversity21
andrarelyaddressoverfishing3
.Bycon-
trast,recentmarinereserveparadigmshaveexplicitlyaimedtobalance
protectionofbiodiversityinsidereserveboundarieswithsustainable
harvests beyond them7
. Although the effectiveness of reserves as a
large-scale management strategy continues to be debated18,22
, there
is widespread evidence that small, community-based reserves can
improvethesustainabilityofcoastalfisheries23
,particularlyfornations
withlimitedfisheriesmanagementcapacity24
.Suchanapproachoffers
greatpotentialtoaddresshumanandecosystemneedsinlow-income
countries where biodiverse rivers contribute disproportionately to
inland fisheries12,13
, frequently suffer from overharvesting3
, and defy
efforts to apply traditional fisheries management strategies12
.
Southeast Asia is the only region of the world where riverine
reservesarecommonplace;hundredsofcommunitieshavedesignated
no-fishingzonesthattogetherformdefactoreservenetworksinrivers
throughout the region25,26
. Here, we use one such network of small,
community-based reserves located within the Salween River basin in
northern Thailand (Fig. 1) to test how fish communities respond to
protection. We studied 23 reserves that, despite a common cultural
context(see SupplementaryInformation),representgradientsinage,
size, enforcement, isolation, and network connectivity. Each of these
factorscontributestothesuccessofmarinereserves7,8,17
,sowetested
their influence on the responses of fish species richness, density, and
https://doi.org/10.1038/s41586-020-2944-y
Received: 14 January 2020
Accepted: 5 October 2020
Published online: xx xx xxxx
Check for updates
1
Center for Limnology, University of Wisconsin-Madison, Madison, WI, USA. 2
Cornell Atkinson Center for Sustainability, Cornell University, Ithaca, NY, USA. 3
Global Water Center,
Department of Biology, University of Nevada, Reno, Reno, NV, USA. 4
Department of Earth System Science, Stanford University, Stanford, CA, USA. 5
Department of Natural Resources,
Cornell University, Ithaca, NY, USA. ✉e-mail: akoning@unr.edu
2. 2 | Nature | www.nature.com
Article
biomass to protection from fishing in rivers. These reserves are sur-
rounded by reaches in which intensive harvests discriminate little
among fish species, sizes, or trophic positions27
, providing a strong
test of the overall effectiveness of community-based reserves as well
as the design principles that can maximize their ecological benefits.
Despite their small size, grassroots reserves enhanced the spe-
cies richness, density, and biomass of protected fish communities
enormously (Fig. 2). Relative to adjacent fished areas with compara-
ble water depth and substrate composition (see Methods), reserves
held an average of 27% more fish species (95% confidence interval
(CI), 9–47%), 124% higher fish density (118–130%), and 2,247% higher
biomass (1,460–3,433%). Whereas richness and density responses at
our study sites were similar to those reported for marine reserves,
mean biomass differences were six times higher than those typically
observed in marine protected areas4
. These large biomass responses
reflectdefaunationofthemajorityoftheriverbyfishers,whichcreates
suchstarkdisparitiesthatunmarkedreserveboundariescanbereadily
discernedbyeyebecausethevisibilityoflargefishesfromabovewater
shifts sharply (Supplementary Fig. 1).
The strength of responses to reserves varied among fish species
accordingtobodysizeandtrophicguild.Relativelylargefishes(maxi-
mumlength 200 mmormore;ExtendedDataFig. 1)disproportionately
benefited from protection; their species richness increased by 59%
(31–93%),densityby245%(234–257%),andbiomassby4,326%(2,490–
7,463%). By contrast, reserves had no effect on the richness, density,
orbiomassofsmaller-bodiedfishspecies(maximumlengthlessthan
200 mm;P > 0.05).Amongtrophicguilds,herbivores(trophicposition
(TP) ≤ 2.5) had the highest gains in richness (96% (22–221%)), density
(117%(105–128%)),andbiomass(3,536%(1,688–7,293%))insidereserves.
Omnivores (2.5 < TP ≤ 3.5) also benefited substantially; their richness
increased 18% (1–39%), density 132% (125–140%), and biomass 2,327%
(1,527–3,522%) relative to adjacent fished areas. Although predators
(TP > 3.5)increasedindensityby179%(58–421%)andbiomassby136%
(26–340%), we found no change in their richness (P > 0.05).
Theresponsesofriverfishtoprotectionaccordwellwithseveralprin-
ciplesofmarinereservedesign,butthedegreeofbenefitwasalsomedi-
atedbyfunctionaltraits.Forinstance,therichnessresponse(Rr)across
allspecieswasrarelycorrelatedwithreservecharacteristics,butsize,
enforcement, and connectivity were all associated with higher Rr for
particularfunctionalgroups(Fig. 3).Increasingreserveareaincreased
Rr forallfishes,largefishes,andomnivores(Fig. 4),suggestingthatspe-
cies–arearelationshipsapplyeventothesesmallhabitatpatches.For
predatoryandherbivorousfishes,reservesinhigh-dischargereaches
wereparticularlyimportantforrichnessgains(Fig. 4),probablyowing
to the greater availability of deep-water habitats favoured by large
species in these trophic guilds.
Density responses (Dr) to reserves were strongly influenced by
enforcement metrics. Specifically, Dr for all fishes and large fishes
decreasedwithincreasedisolation,suggestingthatvillageproximity
encouragescommunityvigilanceagainstillegalharvest(Figs. 3,4).The
boundariesofseveralreservescorrespondedwiththemostupstream
and downstream homes in the village, allowing near-constant sur-
veillance while minimizing travel distances to adjacent fishing areas.
Although close proximity to a village could increase fishing intensity
outside reserves, village size—another proxy for potential fishing
intensity—had little effect on observed outcomes (Fig. 3). The Dr for
small fish was higher in reserves that had explicitly stated penalties
forillegalharvest,regardlessofseverity,thaninthosethatlackedsuch
community-imposed penalties (Fig. 4). Thus, it appears that merely
havinganagreed-uponenforcementpolicycanbolsterreserveprotec-
tion for some functional groups of river fishes28
.
Reserve size was among the best predictors of reserve biomass
response (Br) across all categories except for small fishes (Fig. 3),
and village proximity remained important for Br of large fishes and
herbivores(Fig. 4).Biomassgainsareparticularlyimportantforfisher-
ies, as larger fish may be expected to provide both greater yields on
fishing effort and disproportionately high reproductive capacity to
Outlet to
Salween River
2,000 m
1,000 m
250 m
Reserve length
Permanent
streams
Thailand
China
Myanmar
Salween River
basin
5 km
Ngao River
basin
N
Fig.1|RiverinereservenetworkwithintheMaeNgaobasin.Networkof52
community-basedreservesdocumentedin2018withinthe1,000-km2
Mae
NgaoRiver,atributaryoftheSalweenRiverinnorthernThailand(inset).
Reservesaredepictedbycirclesscaledaccordingtoreservelength.Purple
denotesthe23reserveswherefishcommunitieswereprofiledforthisstudy,
whichrepresentastratifiedsubsetofallknownreserves.Riverbasinand
streamdelineationaredetailedintheMethods.
–2
0
2
4
6
8
10
Reserve−non-reserve
Rr Dr
–0.5
0
0.5
1.0
1.5
2.0
2.5
log10
Reserve
Non-reserve
Br
+1,000%
+10,000%
+124%
+2,247%
No change
Fig.2|Fishresponsestoprotectioninreserves.Responsesoffish
communitiestoprotectionfromfishing,intermsofspeciesrichness(Rr),
density(Dr),andbiomass(Br).Pointsaremeanpairwisecomparisons(Rr isthe
arithmeticdifferencebetweenreserveandnon-reservespeciesrichness;Dr
andBr arelog10 responseratioscomparingreserveandnon-reserveareas).Grey
rectangles,responsemeans;redcircles,responsemedians.
3. Nature | www.nature.com | 3
sustainreservepopulationsandseedunprotectedareasbyexporting
juveniles16,17
.
Ourresultsdemonstratethatsmallreserveshavegreatbenefitsfor
intensively harvested fishes in this tropical river, even though their
collectiveareaencompassesonly2%ofthechannelinourstudycatch-
ment. The areas of individual reserves ranged from just 0.2 to 2.2 Ha
(2,003–21,629m2
),butbothfishrichnessandbiomassoutcomesscaled
with reserve size. The increase in Br with area may result from greater
resourceavailabilityprovidedbylargerreserves7
(Fig. 4),andthestrong
area dependenceofRr forlargefishessuggestsaroleforthescalingof
homerangerequirementswithbodysize29
.Notably,thelinearscaling
ofgainsinrichnessandbiomasswithreservearea(Fig. 4)suggestthat
modestexpansionsoftheboundariesofexistingsmallreservesmight
yield considerable ecological benefits.
Thesuccessofthisreservenetworkhasemergedthroughthevoluntary
actionsofnumerouscommunities.Inreturnforcreatingandenforcing
areserve,thelocalpopulationstandstobenefitdirectlyfromenhanced
fishpopulations,therebycompletingavirtuouscyclethatencourages
continuedcommunityaction30
.Successfulcommunity-basedinlandfish-
erymanagementeffortshavebeendocumentedintheAmazon31–33
,Bang-
ladesh34
,andelsewhereinSoutheastAsia25
,butoursystematicanalysis
acrossreplicatereservesintheSalweenbasinelucidateshowdecisions
regarding size, location, and enforcement affect the ecological out-
comesofprotection.Inparticular,twoaspectsofcommunityenforce-
mentmaximizereservebenefits:closeproximitybetweenreserveand
village, which increased density and biomass outcomes (Fig. 4), and
explicitpenalties,whethermonetary(about$15–$300peroffence)or
non-monetary(animalsacrificeorlibations).Thesefindingsunderscore
thefactthatempoweringcommunitiestomanagelocalresourcescan
achieveconservationandecosystemserviceoutcomesmoreeffectively
than top-down, centralized management32,35,36
. Indeed, the grassroots
reserves of the Salween basin, individually and collectively, exemplify
thecriticalhumandimensionsofachievingecological,economic,and
socialsuccessinnaturalresourcemanagement23
.
Notably,reserveagewasnearlyalwaysnegativelyassociatedwiththe
magnitudeofrichness,density,andbiomassbenefits(Fig. 3).However,
ourdatagivenoindicationthatthepositiveeffectsofreserveseventu-
ally wane. Negative responses were found in only six reserves (Fig. 2),
each of which was relatively newly established (mean age, 5.3 years;
median, 5.0 years),andsimplelinearregressionsshowedthatagehad
no independent effect on any reserve response. In the best averaged
models, age was strongly important only in conjunction with other
variables that had higher importance scores, such as size, connectiv-
ity,orenforcementvariables(Fig. 3,ExtendedDataTables 1–3).Thus,
weinferthatthegradualdeclineinreservebenefitswithtimereflects
improvements in fish communities in unprotected areas adjacent to
reservesofsufficientsize,connectivity,andenforcement.Themecha-
nismthatunderliesthereduceddisparitiesbetweenadjacentprotected
and fished areas is presumably a rise in density-dependent spillover
with reserve age (Extended Data Fig. 2). This is a critical insight with
regardtobothconservationandlocalfoodsecurityintropicalrivers.
Growingevidencefrommarinereservessuggeststhatspillovereffects
aregreatestamongnetworksofmanysmallreserves,akintoourstudy
system, rather than fewer large ones7,37
. Furthermore, estimates of
spillover distance from marine reserve boundaries range from 102
to
103
m (ref. 37
), which broadly matches the distances over which inten-
sive fishing pressure occurs between reserves among our study sites.
There is also circumstantial evidence that spillover of fish from our
study reserves enhances local fisheries: fishers regularly harvest fish
ofmanyspeciesthatarelargerthanwehaveobservedoutsidereserves
during years of field work. The ongoing proliferation of new reserves
suggests that subsistence fishing communities expect this conserva-
tion approach to improve their own food security.
Network-level benefits have emerged across our study reserves
despite a lack of formal planning or coordination among communi-
ties during creation of this de facto reserve network (see Supplemen-
tary Information). Connectivity, measured as how central a reserve is
withinthenetwork,wasimportantforRr ofallfishesandlargespecies,
suggesting the importance of dispersal among protected areas for
maintainingmetapopulations(Fig. 3,ExtendedDataFig. 3).Indendritic
rivernetworks,dispersalpathwaysareeffectivelyone-dimensional,but
centrallylocatedreservescanlinkpopulationsinmultipletributaries,
thereby stabilizing metapopulations through time38
. Nonetheless,
certain rare predators were found only in downstream reserves that
had high discharge (Fig. 4). For large-bodied (>1 m) and far-ranging
species, persistence may depend on immigration from larger rivers
downstream,andindividualreservesarelikelytobetoosmalltosustain
a viable population.
Despitetheapparenteffectivenessofsmallreservesforprotecting
the richness, density, and biomass of river fishes, questions about
(Aikake weight)
1.0
0.5
0
1.0
0.5
Positive
correlation
Negative
correlation
Allfishes
Large
Sm
all
Predators
O
m
nivores
H
erbivores
Years protected
Village distance
Road distance
Houses
Penalty
Closest reserve distance
Distance to mouth
Betweenness centrality
Discharge
Reserve area S
S
C
C
C
E
I
I
I,E
A
Rr Dr Br
Allfishes
Large
Sm
all
Predators
O
m
nivores
H
erbivores
Allfishes
Large
Sm
all
Predators
O
m
nivores
H
erbivores
Importance
Fig.3|Reservefeaturesvaryinbenefitsforfish.Richness(Rr),density(Dr),
andbiomass(Br)gainsforallfishesandparticularfunctionalgroupsinbest
averagedmodels.Cellcolouridentifiespositive(blue)ornegative(red)model
coefficientsanddeepercoloursaturationsignifiesgreaterimportanceas
Akaikeweightsummedacrossmodels.Letterson theleftindicatethemajor
categoriesofreservefeatures:S,size;C,connectivity;E,enforcement;I,
isolation;A,age.
4. 4 | Nature | www.nature.com
Article
theirlong-termimpactremain.Ifprotectedsub-populationsbecome
isolated by intensive fishing between reserves, metapopulation per-
sistence is unlikely39
. In highly seasonal rivers such as the Salween—
tropical Asia’s longest remaining free-flowing river10
—connectivity
between reserves is most likely during the wet season, when rising
water levels simultaneously cue spawning migrations by some spe-
cies and decrease the efficacy of all fishing methods. Relaxing these
constraints on movement may enable a critical influx of individuals
and alleles, alleviating demographic bottlenecks and inbreeding39
. It
remainsunclear,however,whetherseasonalmovementamongreserves
canovercomethelikelihoodofextinctiondebtswheneachindividual
protected area is so small40
. Additionally, for long-distance migrants
such as catadromous eels (Anguilla bengalensis), reserves can offer
onlypartialprotectioninthefaceofproposedhydropowerandwater
diversion projects throughout the Salween basin.
Thedemonstrablebenefitsofreservesize,enforcement,andconnec-
tivityinthisgrowingnetworkofgrassrootsriverinereservesshowthat
manyprinciplesthatweredevelopedformarinereservesareapplicable
torivers.However,ourfindingsalsorevealtheneedforcareinadapting
marinereservedesignstosuitthephysicalstructureofrivernetworks,
thedistinctivelifehistoryrequirementsoftheirfauna,andthecultures
oflocalcommunitiesandfishers.Forexample,largereservesareclearly
important, but maximizing area by exclusively creating reserves in
widedownstreamriverreacheswouldleaveuniqueheadwaterspecies
unprotected.Rather,riverinereservenetworksshouldbedesignedto
encompass both high- and low-order segments38
. Additionally, while
explicit fines did improve reserve outcomes, communal surveillance
resultingfromclosevillageproximitymaybeevenmoreimportantfor
deterringpoaching,becauseenforcementissochallenginginremote
areas within large watersheds. More generally, cultural context must
be accounted for in the design of effective enforcement strategies.
AlthoughcommunitiesinnorthwesternThailandhavecreatedriverine
reserves of their own accord, such grassroots networks may require
encouragement and even subsidies in other locations. From an eco-
logical perspective, reserves located centrally within networks may
benefit many resident species and functional groups, but upstream–
downstream connectivity along the entire river continuum will be
required to conserve the migratory species that are critical in many
river fisheries10,41
.
While surely not a panacea for all that ails the world’s rivers,
the reserves of the Salween basin demonstrate the benefits of a
community-based model for protecting the biodiversity that under-
pins ecosystem resilience and local subsistence fisheries. Like many
rivers worldwide, the Salween is threatened by a combination of land
usechange,intensifyingagriculturalpractices,non-nativespecies,flow
modification, and intensive and indiscriminate fishing pressure11,42
.
Networks of riverine reserves directly address only one stressor, but
thebiologicaldiversityandecologicalprocessesthattheyprotectare
likelytoaugmentlocalecosystemresilienceandmoderatetheimpacts
of other stressors43
.
Given the variety and magnitude of positive outcomes observed in
each of these small reserves, as well as the emergent benefits of posi-
tion within the ad hoc network, we expect that even greater fishery
and conservation gains could be achieved through a more deliberate
approach.Manyoftheprinciplesthathavebeendistilledfromsuccess-
fulmarinereservesappeartoapplytorivers,andfurtherlessonsfrom
marine and terrestrial networks of protected areas should be sought
in order to strengthen ecosystem-based protection for freshwater
systems.Accountingforbothlocalandnetwork-basedfeatureswillbe
criticalforplanninganoptimalportfolioofriverinereserves.Perhaps
evenmorecentraltoconservationsuccessarethehumanmotivations
for establishing, enforcing, and harvesting from reserves. Our find-
ings from the Salween prove that riverine reserves, when embedded
in a conducive cultural context, can yield impressive benefits for the
imperilledfreshwaterecosystemsuponwhichhundredsofmillionsof
people depend worldwide.
Onlinecontent
Anymethods,additionalreferences,NatureResearchreportingsum-
maries, source data, extended data, supplementary information,
acknowledgements, peer review information; details of author con-
tributions and competing interests; and statements of data and code
availabilityareavailableathttps://doi.org/10.1038/s41586-020-2944-y.
1. Worm, B. et al. Rebuilding global fisheries. Science 325, 578–585 (2009).
2. Costello, C. et al. Global fishery prospects under contrasting management regimes. Proc.
Natl Acad. Sci. USA 113, 5125–5129 (2016).
3. Allan, J. D. et al. Overfishing of inland waters. Bioscience 55, 1041–1051 (2005).
4. Lester, S. E. et al. Biological effects within no-take marine reserves: a global synthesis.
Mar. Ecol. Prog. Ser. 384, 33–46 (2009).
5. Halpern, B. S., Lester, S. E. & McLeod, K. L. Placing marine protected areas onto the
ecosystem-based management seascape. Proc. Natl Acad. Sci. USA 107, 18312–18317
(2010).
6. Carr, M. H. et al. Marine protected areas exemplify the evolution of science and policy.
Oceanography (Wash. D.C.) 32, 94–103 (2019).
7. Gaines, S. D., White, C., Carr, M. H. & Palumbi, S. R. Designing marine reserve networks for
both conservation and fisheries management. Proc. Natl Acad. Sci. USA 107, 18286–18293
(2010).
Partialresiduals
0 1.25 2.50
–4
0
6
Reserve area (ha)
0 9 18 27
–10
–5
0
5
Years protected
0 1 2
–2
0
2
Distance to village (km)
10 40 70
–1.5
0
1.5
Distance to mouth (km)
0 1.25 2.50
–2.5
0
2.5
Reserve area (ha)
0 1 2
–2
0
2
Distance to village (km)
All fishes
Large fishes
Small fishes
Predators
Omnivores
Herbivores
P < 0.05
P < 0.1
Rr Dr Br
Fig.4|Scalingofbenefitswithkeyreservefeatures.Partialresidualplots
illustratingrelationshipsbetweenimportantpredictorsofrichness(Rr),
density (Dr),andbiomass(Br)responsestono-takereservesinbestaveraged
models.Symbologyindicatesalternativegroupingsoffishspeciesbybodysize
andtrophicgroup.FullmodelresultsarereportedinExtendedDataTables 1–3.
6. Article
Methods
Studysite
We surveyed fish assemblages within the Mae Ngao tributary of the
Salween River, the largest free-flowing river in Southeast Asia (Fig. 1).
The Mae Ngao River basin of northwestern Thailand encompasses
approximately1,000km2
ofmixeddeciduoussecondaryforest,swid-
denandlowlandagriculturallands,andover80villages(>8,000people)
of predominately ethnic Karen people. A land use survey conducted
by the Land Development Department of Thailand in 2009 estimated
basin-wideforestcovertobe70%,withagriculturecomprisingapproxi-
mately27%oftheland,thoughtherehasbeensubstantialforestclear-
ing for intensified forms of agriculture within the basin over the past
decade44
.Duringthistimecommunitieshavemovedfromdiversified,
low-inputswiddenagriculturalpracticestorowcrops,predominately
soy,requiringsubstantialchemicalherbicideandpesticideinputs.The
MaeNgaoRiverhasastronglyseasonalhydrograph,withasinglerainy
seasonextendingfromMaytoOctoberandadryseasonfromNovember
toApril.Duringtherainyseason,thedepthoftheNgaoRiverincreases
by over 4 m relative to dry season baseflows. During dry season, the
riverbecomesclear,allowingcensusoffishusingvisualmethods(with
maskandsnorkel).Whilefishingeffortandgearsusedvaryseasonally,
thecollectivefishingeffortofcommunitiesdispersedthroughoutthe
valley encompasses nearly all unprotected waters, access to which is
facilitatedbymotorbikesandextensivestreamsidetrails.
Fishsurveys
Toestimatethepotentialforreservestoincreasefishrichness,density,
andbiomass,wesurveyed23pairedreserveandnon-reservelocations
during a single dry season between December 2017 and March 2018.
Individualreserveswereselectedtorepresentarangeinage,size,isola-
tion, size of nearest village, stream order (first to fifth), and network
position.Non-reservesurveyswereconducteddownstreamofreserves
at all locations except one, to which there was only upstream access.
Where stream segments were sufficiently narrow and shallow (19 of
23 sites), two researchers wearing dive masks and snorkels carried
outfishcensusesbyswimmingorcrawlingalong50-mtransectsfrom
downstream to upstream and enumerating all fish within a 2-m band
centred on each observer.
Inthefourlargemainstemsites(meanwidth>20m),oneresearcher
surveyed 50-m-long reaches by systematically counting fish while
movingfrombanktobankinanupstreamdirection.Eachsurveylasted
20 min, which approximated the average survey duration for shallow
reaches.Additionally,toaccountforbenthicorcrypticspeciesinshal-
lowwater(<80cm)atthesefoursites,asecondresearcherconducted
four lateral belt transects at each survey reach. Belt transects were
demarcatedwithachainplacedonthesubstrateperpendiculartoflow.
To allow disturbance effects to dissipate, we waited for 15 min after
chain placement to begin surveys, then enumerated all fish within a
2-mbandcentredonthechainforupto20mofstreamwidth.Foreach
reserve–non-reservesite,atotaloffoursurveyswereconductedattwo
reserve and two non-reserve reaches.
To estimate site-specific biomass, each researcher estimated fish
totallengthsduringeachtransect.Whenfewerthantenindividualsofa
specieswereobserved,lengthswereestimatedforeachindividual.For
species with more than ten observations in a survey, researchers esti-
matedtenlengthsrepresentingthesizedistributionobservedforthat
survey.Estimatedlengthswerecross-validatedbetweenresearchersin
thefieldusingsubmergedmeasuringtapesasreference.Weestimated
site-specificbiomassforreserveandnon-reservefishbyevaluatingthe
meanobservedlengthforeachsitewithalength–weightrelationship
developedfrompreviousworkintheNgaoRiver(A.A.K.,unpublished
data) and supplemented with literature values45
. For the four large
mainstemsites,wecombineddensityestimatesusingcount-weighted
averages of both survey techniques for each survey location.
Ethics oversight for the handling of animals was provided and the
methods approved by the University of Wisconsin Research Animals
ResourcesandComplianceandtheInstitutionalAnimalCareandUse
Committee under protocol number L00447-0-02-12.
Habitatvariables
Ateachsurveysitewemeasuredkeyaspectsofreachhabitatsthatcould
affect fish communities, then tested for habitat differences within
(reserve vs. non-reserve) and among areas. At each transect location,
wemeasureddepthandsubstratecompositionatsixlateraltransects
correspondingto0,10,20,30,40,and50mmarks.Depthandsubstrate
type were recorded at ten evenly spaced locations across the stream
width.SubstratetypesfollowedtheWentworthclassification:silt(<62.5
μm); sand (62.5 μm–2 mm); pea gravel (2–8 mm); gravel (8–32 mm);
pebble (32–64 mm); cobble (64–256 mm); boulder (>256 mm); bed-
rock(>4,000cm).Formainstemsiteswherebothsnorkelandbenthic
counts were employed, we conducted five lateral transects from the
chain counts and snorkel surveys for a total of ten transects and 100
benthicpointsamples.Tocalculatemedianparticlesizeateachsite,we
used the median size of each particle class for each observation, then
calculatedthemedianacrossall60point-samples.Wealsomeasured
discharge at each reserve–non-reserve location to account for the
effectofsegmentsizeonreserveoutcomesusingstandardmethods46
.
From these measurements we calculated mean depth, maximum
depth, mean width, median substrate particle size, and three metrics
of substrate diversity: Simpson’s diversity index of substrate types,
andtheloadingscoresforthefirsttwoaxesofaprincipalcomponent
analysisofsubstratetypesbysite.Simpson’sdiversityindexandprin-
cipal component analyses were conducted in the ‘vegan’47
package
in R48
. We tested for differences in each habitat variable using mixed
effects models with reserve protection as a fixed categorical variable
and each reserve–non-reserve location as a random term. Across all
variables, reserve habitats did not differ from non-reserves for our
study transects (P > 0.05). On the basis of these results, we ruled out
any potential contribution of habitat differences to our analysis of
reserve–non-reserve effects.
Reservefeatures
Toquantifythosereservefeaturesweconsideredpotentiallyimportant
for predicting reserve success, we either made direct field measure-
ments,extracteddatafromdigitizedmaps,orinterviewedcommunity
membersateachsurveysite.Riversizequantifiedasdischarge(m3
s−1
)
was measured in the field using standard methods. Reserve size was
quantified using field measurements of river width, multiplied by
reserve length determined as river length between upstream and
downstream reserve boundaries.
To evaluate the spatial metrics of the reserve network, we digitized
the Mae Ngao River network from a Google Earth49
satellite imagery
base map in ArcGIS 10.350
and mapped all potential stream courses
regardlessofthepresenceofvisiblesurfacewater,asnoexistinghydro-
logicalmapswereatsufficientresolutionforourstudyregion.Weused
fieldobservationstoconstrainthedigitizedstreamnetworkbasedon
in situobservationofthepresenceofwaterin20tributariesduringthe
height of dry season (early May 2016). Using our digital river network
andahydrologicallyconditioneddigitalelevationmodelof90-mreso-
lution51
,weextractedtheupstreamcatchmentarea,thenestimatedan
upstream area threshold that best separated wet from dry locations
(pROC package52
). We estimated an upstream extent of 1.02 km2
to
bestdelineateperennialflows(receiveroperatingcharacteristicarea
under the curve (ROC-AUC) = 0.89, n = 20) and trimmed our digitized
stream network accordingly to a total length of 827 km of perennial
rivers. We also delineated all roads and villages within the Ngao River
Valley from the same satellite imagery, which allowed us to calculate
Euclidean distances between each reserve and the nearest road and
the nearest village as metrics of reserve isolation.
7. Considering these reserves as a network, we calculated three addi-
tional parameters from our stream network that could influence eco-
logicalresponses:riverdistancetothenearestreserve,riverdistance
tomainstemconfluence,andbetweennesscentrality.Distancesamong
reserves and to the river confluence were calculated from reserve
boundariesandmeasuredalongtheperennialrivernetwork.Between-
nesscentrality(BC)isanindexusedinnetworkanalysisthatdescribes
therelativeimportanceofeachnode(thatis,reserve)tooverallconnec-
tivitywithinthenetwork.Specifically,thestandardizedbetweenness
centrality for a node i is calculated as:
g i g
N N
BC =
2 × ∑ ( )/
( − 1)( − 2)i
j k jk jk<
wherei≠j≠k,gjk isthenumberofequallyshortestpathsbetweennodes
j and k, gjk (i) is the number of these paths that include node i, and the
denominatorrepresentstwicethetotalnumberofnodepairswithout
node i53
.
We determined the reserve age (numbers of years since estab-
lishment), enforcement (explicit penalty for illegal harvest: yes or
no), and village size (number of households in sponsoring village)
from more than 35 interviews with village leaders and community
members.
Dataanalysis
To test for differences in species richness and abundance between
reservesandunprotectedareas,weusedmixed-effectsPoissonregres-
siontomodelspeciescounts,accountingforareasurveyedusinganoff-
set.Wetestedbiomassdifferencesbetweenreservesandnon-reserves
bymodelledbiomassperunitareausingamixed-effectslinearmodel,
again with reserve as the lone predictor and site as a random effect.
Mixed-effect models were analysed using the ‘lme4’ package54
in R48
.
Totesttheeffectsofreservefeaturesonfishspeciesrichness,density,
andbiomass,wecalculatedareserveresponseindexforeachoutcome
variable. For species richness (S), we calculated a reserve response
index (Rr) as Rreserve − Rnon-reserve, where R is the mean number of species
observed during two surveys55
. We calculated the reserve response
indices for fish density (Dr) and biomass (Br) as: log10(reserve mean/
non-reserve mean).
In addition to testing the significance of overall reserve responses
across sites, we used functional trait categorization of species to test
for differential responses by size and trophic position. Both the mag-
nitudeanddirection(±)oforganismalresponsestoreserveprotection
have been shown to vary with life history and ecological traits56
. We
dividedfishintolarger-bodiedandsmaller-bodiedcategoriesusinga
threshold of 20 cm maximum length from observations across all 23
reserves. This cutoff was derived empirically from the size frequency
distributionacrossallspeciesobserved(SupplementaryFig. 1).Trophic
positions were estimated using our own nitrogen stable isotope data
fromthestudyareawhenavailable,supplementedwithliteraturedata
for 10 of 38 species45
.
Weregressedthereserveresponseindicesforrichness(Rr),density
(Dr),andbiomass(Br) againstallpredictorvariables.Westandardized
all model coefficients, then evaluated all factorial models (n = 1,024)
andquantitativelycomparedthesubsetofmodelswhosecumulative
sum was 0.95 of the total Aikake weight, which corresponds to a 95%
credibleintervalforbestmodels57
.Forthesubsetofbest-fittingmod-
els,wesummedAikakeweights(wi)foreachpredictorandusedthem
to estimate their relative importance57
. All analyses and model fitting
were conducted using the ‘MuMIn’ package in R58
. Full model results
are reported in Extended Data Tables 1–3.
Reportingsummary
Further information on research design is available in the Nature
Research Reporting Summary linked to this paper.
Dataavailability
The datasets used and/or analysed during the current study are avail-
able in the Environmental Data Initiative repository (https://portal.
edirepository.org/nis/mapbrowse?packageid=edi.513.1).
Codeavailability
The R code used for the analyses presented here is available from
GitHub (https://github.com/aakoning/riv_res_2020).
44. Koning, A. A., Moore, J., Suttidate, N., Hannigan, R. & McIntyre, P. B. Aquatic ecosystem
impacts of land sharing versus sparing: nutrient loading to Southeast Asian rivers.
Ecosystems (N. Y.) 20, 393–405 (2017).
45. Froese, R. & Pauly, D. (eds) FishBase http://www.fishbase.org (2019).
46. Lamberti, G. A. & Hauer, F. R. Methods in Stream Ecology (Academic, 2017).
47. Jari Oksanen, F. et al. vegan: Community Ecology Package. R package version 2.5-6
https://CRAN.R-project.org/package=vegan (2019).
48. R Core Team. R: A Language and Environment for Statistical Computing https://www.
R-project.org/ (R Foundation for Statistical Computing, 2019).
49. Google Earth (November, 2015). Mae Ngao, Thailand. https://www.google.co.uk/earth/
(2020).
50. Environmental Systems Research Institute (ESRI). ArcGIS Release 10.3 (2015).
51. Yamazaki, D. et al. A high-accuracy map of global terrain elevations. Geophys. Res. Lett.
44, 5844–5853 (2017).
52. Robin, X. et al. pROC: an open-source package for R and S+ to analyze and compare ROC
curves. BMC Bioinformatics 12, 77 (2011).
53. Jordán, F., Liu, W. C. & Andrew, J. D. Topological keystone species: measures of positional
importance in food webs. Oikos 112, 535–546 (2006).
54. Bates, D., Maechler, M. & Ben Bolker, S. W. Fitting linear mixed-effects models using lme4.
J. Stat. Softw. 67, 1–48 (2015).
55. Claudet, J. et al. Marine reserves: size and age do matter. Ecol. Lett. 11, 481–489 (2008).
56. Claudet, J. et al. Marine reserves: fish life history and ecological traits matter. Ecol. Appl.
20, 830–839 (2010).
57. Johnson, J. B. & Omland, K. S. Model selection in ecology and evolution. Trends Ecol.
Evol. 19, 101–108 (2004).
58. Barton, K. MuMIn: Multi-Model Inference. R package version 1.43.6 https://CRAN.R-project.
org/package=MuMIn (2019).
Acknowledgements We thank the communities of the Mae Ngao River basin for their
participation in and support of this research, and the International Sustainable Development
Studies Institute (Chiang Mai) for logistical support. Earlier drafts of the manuscript were
improved by the McIntyre laboratory groups at the University of Wisconsin-Madison and
Cornell University, and by comments from I. Baird, B. Peckarsky, K. Winemiller, E. Stanley,
T. Ives, R. Abell and M. Thieme. Funding was provided by National Science Foundation grants
DGE-0718123, DGE-1144752, and DEB-15011836 to A.A.K. and DGE-1144752 to K.M.P., a Harvey
Fellowship and a Cornell Atkinson Center for Sustainability Postdoctoral Fellowship to
A.A.K., and a David and Lucille Packard Fellowship to P.B.M. Additional funding provided by
USAID’s ‘Wonders of the Mekong’ Cooperative Agreement No: AID-OAA-A-16-00057.
Author contributions A.A.K. conceptualized the research, acquired funding, performed
fieldwork, conducted analyses, and wrote the manuscript. K.M.P. performed fieldwork,
assisted in methodological development, and edited the manuscript. E.F.-C. conducted
analyses, contributed to creating figures, and edited the manuscript. P.B.M. contributed to
research conceptualization and methodological development, and edited the manuscript.
Competing interests The authors declare no competing interests.
Additional information
Supplementary information is available for this paper at https://doi.org/10.1038/s41586-020-
2944-y.
Correspondence and requests for materials should be addressed to A.A.K.
Peer review information Nature thanks Edward Allison and the other, anonymous, reviewer(s)
for their contribution to the peer review of this work.
Reprints and permissions information is available at http://www.nature.com/reprints.
11. Extended Data Table 1 | Results of model averaging for richness reserve response (Rr)
Aikake weight (wi), coefficient (β), and p-value (p) for two-sided z-test of predictors from best averaged models. All factorial models were fit (n = 1,024). The results reported are for the best aver-
aged model obtained from the subset of models (# Models) having highest Akaike weights (wi), corresponding to a 95% credible interval for best fitting models.
12. Article
Extended Data Table 2 | Results of model averaging for density reserve response (Dr)
Aikake weight (wi), coefficient (β), and p-value (p) for two-sided z-test of predictors from best averaged models. All factorial models were fit (n = 1,024). The results reported are for the best aver-
aged model obtained from the subset of models (# Models) having highest Akaike weights (wi), corresponding to a 95% credible interval for best fitting models.
13. Extended Data Table 3 | Results of model averaging for biomass reserve response (Br)
Aikake weight (wi), coefficient (β), and p-value (p) for two-sided z-test of predictors from best averaged models. All factorial models were fit (n = 1,024). The results reported are for the best aver-
aged model obtained from the subset of models (# Models) having highest Akaike weights (wi), corresponding to a 95% credible interval for best fitting models.
14. 1
natureresearch|reportingsummaryApril2020
Corresponding author(s): Aaron A. Koning
Last updated by author(s): Sep 8, 2020
Reporting Summary
Nature Research wishes to improve the reproducibility of the work that we publish. This form provides structure for consistency and transparency
in reporting. For further information on Nature Research policies, see our Editorial Policies and the Editorial Policy Checklist.
Statistics
For all statistical analyses, confirm that the following items are present in the figure legend, table legend, main text, or Methods section.
n/a Confirmed
The exact sample size (n) for each experimental group/condition, given as a discrete number and unit of measurement
A statement on whether measurements were taken from distinct samples or whether the same sample was measured repeatedly
The statistical test(s) used AND whether they are one- or two-sided
Only common tests should be described solely by name; describe more complex techniques in the Methods section.
A description of all covariates tested
A description of any assumptions or corrections, such as tests of normality and adjustment for multiple comparisons
A full description of the statistical parameters including central tendency (e.g. means) or other basic estimates (e.g. regression coefficient)
AND variation (e.g. standard deviation) or associated estimates of uncertainty (e.g. confidence intervals)
For null hypothesis testing, the test statistic (e.g. F, t, r) with confidence intervals, effect sizes, degrees of freedom and P value noted
Give P values as exact values whenever suitable.
For Bayesian analysis, information on the choice of priors and Markov chain Monte Carlo settings
For hierarchical and complex designs, identification of the appropriate level for tests and full reporting of outcomes
Estimates of effect sizes (e.g. Cohen's d, Pearson's r), indicating how they were calculated
Our web collection on statistics for biologists contains articles on many of the points above.
Software and code
Policy information about availability of computer code
Data collection Stream pathways were digitized using Google Earth satellite imagery version 7.1 (Google Earth, 2015). The digital elevation map used to
generate upstream catchment data for trimming stream lengths is available upon request at http://hydro.iis.u-tokyo.ac.jp/~yamadai/
MERIT_Hydro/ (Yamazaki et al, 2017).
Data analysis All statistical analyses and model fittings were conducted in R version 3.6.1 (R Core Team 2019) using the packages 'lme4' version 1.1-21
(Bates et al. 2015) or 'MuMIn' version 1.43.6 (Barton, 2019). Habitat diversity was analyzed using the 'vegan' package version 2.5-6 in R
(Oksanen et al, 2019). Spatial analyses was conducted using ArcGIS version 10.3 (ESRI 2015). Custom R code for analyses are available on
GitHub (https://github.com/aakoning/riv_res_2020).
For manuscripts utilizing custom algorithms or software that are central to the research but not yet described in published literature, software must be made available to editors and
reviewers. We strongly encourage code deposition in a community repository (e.g. GitHub). See the Nature Research guidelines for submitting code & software for further information.
Data
Policy information about availability of data
All manuscripts must include a data availability statement. This statement should provide the following information, where applicable:
- Accession codes, unique identifiers, or web links for publicly available datasets
- A list of figures that have associated raw data
- A description of any restrictions on data availability
The data sets used and/or analyzed during the current study are available in the Environmental Data Initiative repository, (doi:10.6073/pasta/
e81a8c6eceff001e3e8b7062ad2ea483).
15. 2
natureresearch|reportingsummaryApril2020
Field-specific reporting
Please select the one below that is the best fit for your research. If you are not sure, read the appropriate sections before making your selection.
Life sciences Behavioural & social sciences Ecological, evolutionary & environmental sciences
For a reference copy of the document with all sections, see nature.com/documents/nr-reporting-summary-flat.pdf
Ecological, evolutionary & environmental sciences study design
All studies must disclose on these points even when the disclosure is negative.
Study description This study compared the richness, density, and biomass of fish from 23 protected river reaches and paired adjacent unprotected
reaches. To evaluate the effect of protection on fish, we treated the protected and unprotected reaches at each site (n = 23) as
experimental units within which each of two observers made fish observations at each of two plots per reach (n=184 total: 23 sites x
2 reaches per site x 2 plots per reach x 2 observers per plot x 1 observation per observer). In mixed effects models, protection status
was coded as a binary fixed effect (N = no community protection, Y = community protection), and site (n = 23) was used as a random
effect to account for site-level variation among paired reaches. Fish were enumerated during visual surveys conducted using mask
and snorkel along longitudinal transects, as well as supplemental lateral transects at 4 of 23 sites where the river size was wide (>15
m width). Lengths of fish were estimated by eye for up to 10 individuals of each species; where >10 individuals were observed, only
10 lengths were estimated from a representative, haphazardly selected subset of individuals. Estimated lengths were used to
calculate estimated biomass of each fish using species-specific regressions from captured conspecifics. Reserve characteristics were
determined using GIS analysis, field measurements, and interviews with community leaders.
Research sample We sampled (observed) only fish (Class: Actinopterygii) along 50-m-long transects, enumerating all fish observed within A 2-m-wide
transect. In all study reaches, 100 square meters was sufficient to include observations from all major habitat types. Samples
consisted of underwater fish counts made along transects by [two] observers wearing masks and snorkels. Because we made
underwater observations of fish, it was not possible to determine the age range of fishes nor their sexes. While it is possible to
estimate the age of fish based on their lengths, these statistical relationships have not been determined for nearly all of the species
we observed, making it impossible to accurately determine their ages from estimated body length data. The sample population of
fish observed along each transect is interpreted to represent the local fish community within the reach, whether it was an protected
or unprotected reach.
Sampling strategy We did not perform sample size calculations. We selected two locations (plots) within each protected and unprotected reach within
each site. Plots were typically separated by 50+ meters along the river length, and individual plots were selected to capture a range
of habitat types. Observers moved in an upstream direction. These replicate observations in every reach are adequate to represent
the local fish community at the scale of our study. Similar methods using 50 m transects and underwater counts have been used to
estimate fish community composition for marine protected areas that are far larger than the systems we studied (e.g. Edgar et al.,
2014 in references). Our paired observations from protected and unprotected reaches at each site were then used to calculate a
suite of metrics of fish responses to reserve protection based on response ratios. Response ratios were then compared across all 23
sites.
Data collection Data collection in the field was performed by Aaron Koning and Martin Perales. Fish count data were collected using the methods
described above under Sampling strategy. Additional data collected included habitat survey: substrate classification, stream width
and depth measurements, and stream discharge. Substrate analysis was done by categorizing the substrate particle size (using a
modified Wentworth particle size classification) at 10 points along 6 lateral stream transects at each survey plot (n = 60). Stream
widths was measured 6 times (at fish count transect meters 0, 10, 20, 30, 40, 50), and depth was measured at ten points evenly
spaced across each of these width transects (n = 60 total). Stream discharge was measured once at each site using a USGS pygmy
flow meter following standard methods. Reserve feature information was collected from community members. Prior to surveying any
location, we explained the purpose of our study and requested approval from community leaders. At this point we collected
information from community members regarding the age of the local reserve, the penalty associated with illegal fishing activity, etc.
Reserve size, connectivity, and proximity to the nearest village and nearest road were all done using GIS.
Timing and spatial scale Sampling was conducted between December 2017 and March 2018. Sampling was conducted during the dry season, which extends
from November to April or early May. During this time, water clarity increases and depth decreases sufficiently to allow for visual
snorkel surveys. The Mae Ngao River Basin, in which each of our 23 survey sites is located, is approximately 1,000 square kilometers
in area. Our 23 sites were distributed throughout this valley (see Figure 1), and sampling at each site (including both protected and
unprotected reaches) extending along approximately 1 km of channel length.
Data exclusions No data were excluded from this analysis.
Reproducibility There was no experimental treatment used in this study. The protection status of each reach was considered to be a treatment for
statistical analysis. This designation of each reach as protected or unprotected was made by local communities, not by researchers.
The results reported herein are qualitatively similar to our observations from other years and locations. All aspects of this study could
be replicated, given community approvals to do so. Given limitations of timing and funding, we made the decision to sample a wider
number of sites for our study only once rather than sampling fewer sites multiple times. This decision enabled us to increase the
inferential power regarding which features or characteristics of reserves were most important for predicting outcomes of community
protection for fish diversity and abundance.
Randomization The 23 sites used in this study represent a gradient in the predictor variables of interest. Thus, while sites weren't randomly selected,
they did span differences in key parameters including reserve length, river size, local population size, years of protection, etc. Due to
16. 3
natureresearch|reportingsummaryApril2020
the pairing of protected and unprotected reaches at each site, we were able to rigorously control for larger-scale spatial variation in
drawing inferences about the outcomes of community protection.
Blinding Blinding was not relevant to our study; under field conditions, observers could not be prevented from perceiving whether a reach
was protected or not. However, the same pair of investigators collected data in parallel from every reach, minimizing risk of bias
during observations.
Did the study involve field work? Yes No
Field work, collection and transport
Field conditions This study was conducted in the dry season, which extends from November through May. During this time water clarity allows for
visual census of fish. Daily temperatures are generally cooler (highs:26º-30ºC, lows: 9º-12ºC) in December, January, and February,
and become increasingly warm in March, April, and May (highs: 31º-34ºC, lows: 14º-20ºC). Surveys were conducted during daylight
hours to ensure maximal fish visibility. Flow and habitat conditions at each site are reported in the supplemental information.
Location This study was conducted in the Mae Ngao River Basin, in northwestern Thailand. The mouth of the river is located at N17.865980
E97.963357, an elevation of 145 m.
Access & import/export There were no samples imported or exported for this study. We worked with community members to acquire permission to access
community protected and unprotected areas of the Mae Ngao River.
Disturbance Our study caused little to no disturbance because we used entirely non-destructive sampling (i.e., snorkel counts, habitat
measurements, etc.). We minimized our disturbance by accessing locations using only existing paths and trails to access each reach.
In the stream, we made efforts to avoid disturbing substrates, avoided causing bankside erosion, and ensured all flagging and
marking materials were removed upon completion of our surveys. The individual surveys were of relatively short duration 20-45
minutes, allowing fishes to return to their habitats quickly.
Reporting for specific materials, systems and methods
We require information from authors about some types of materials, experimental systems and methods used in many studies. Here, indicate whether each material,
system or method listed is relevant to your study. If you are not sure if a list item applies to your research, read the appropriate section before selecting a response.
Materials & experimental systems
n/a Involved in the study
Antibodies
Eukaryotic cell lines
Palaeontology and archaeology
Animals and other organisms
Human research participants
Clinical data
Dual use research of concern
Methods
n/a Involved in the study
ChIP-seq
Flow cytometry
MRI-based neuroimaging
Animals and other organisms
Policy information about studies involving animals; ARRIVE guidelines recommended for reporting animal research
Laboratory animals No laboratory animals were used in this study.
Wild animals Only fish (Class: Actinopterygii) were observed in the field. The species observed include: Parambassis vollmeri, Danio albolineatus,
Pethia stoliczkana, Folifer brevifilis, Hara filamentosa, Nemacheiline loach, Chagunius bayeli, Xenentodon cancila, Barilius ornatus,
Glyptothorax sp., Mystacoleucus argenteus, Systomus rubriprinnis, Garra salweenica, Poropuntius sp., Scaphiodonichthys
burmanicus, Hampala salweenensis, Hypsibarbus salweenensis, Crossocheilus burmanicus, Mastacembelus armatus, Neolissochilus
stracheyi, Tor sinensis, Raimas guttatus, Bangana devdevi, Sperata acicularis, Hemibagrus micropthalmus. Age-length relationships
are unknown for nearly all of these species, and thus we were unable to determine their ages. However, from previous work we had
already established length-weight regression relationship for nearly all species. For those species that we lacked robust length-weight
relationships, we used publicly available published relationships (Froese and Pualy 2019). Additionally, determining the sex of these
fish requires handling them (either to express gametes or dissection), which was not possible in the study due to local regulations
that forbid catching fish in reserve areas.
Field-collected samples This study did not involve laboratory study of field-collected samples.
Ethics oversight Ethics oversight for the handling of animals was provided and the methods approved by the University of Wisconsin Research
Animals Resources and Compliance and the Institutional Animal Care and Use Committee under protocol number L00447-0-02-12.
Note that full information on the approval of the study protocol must also be provided in the manuscript.