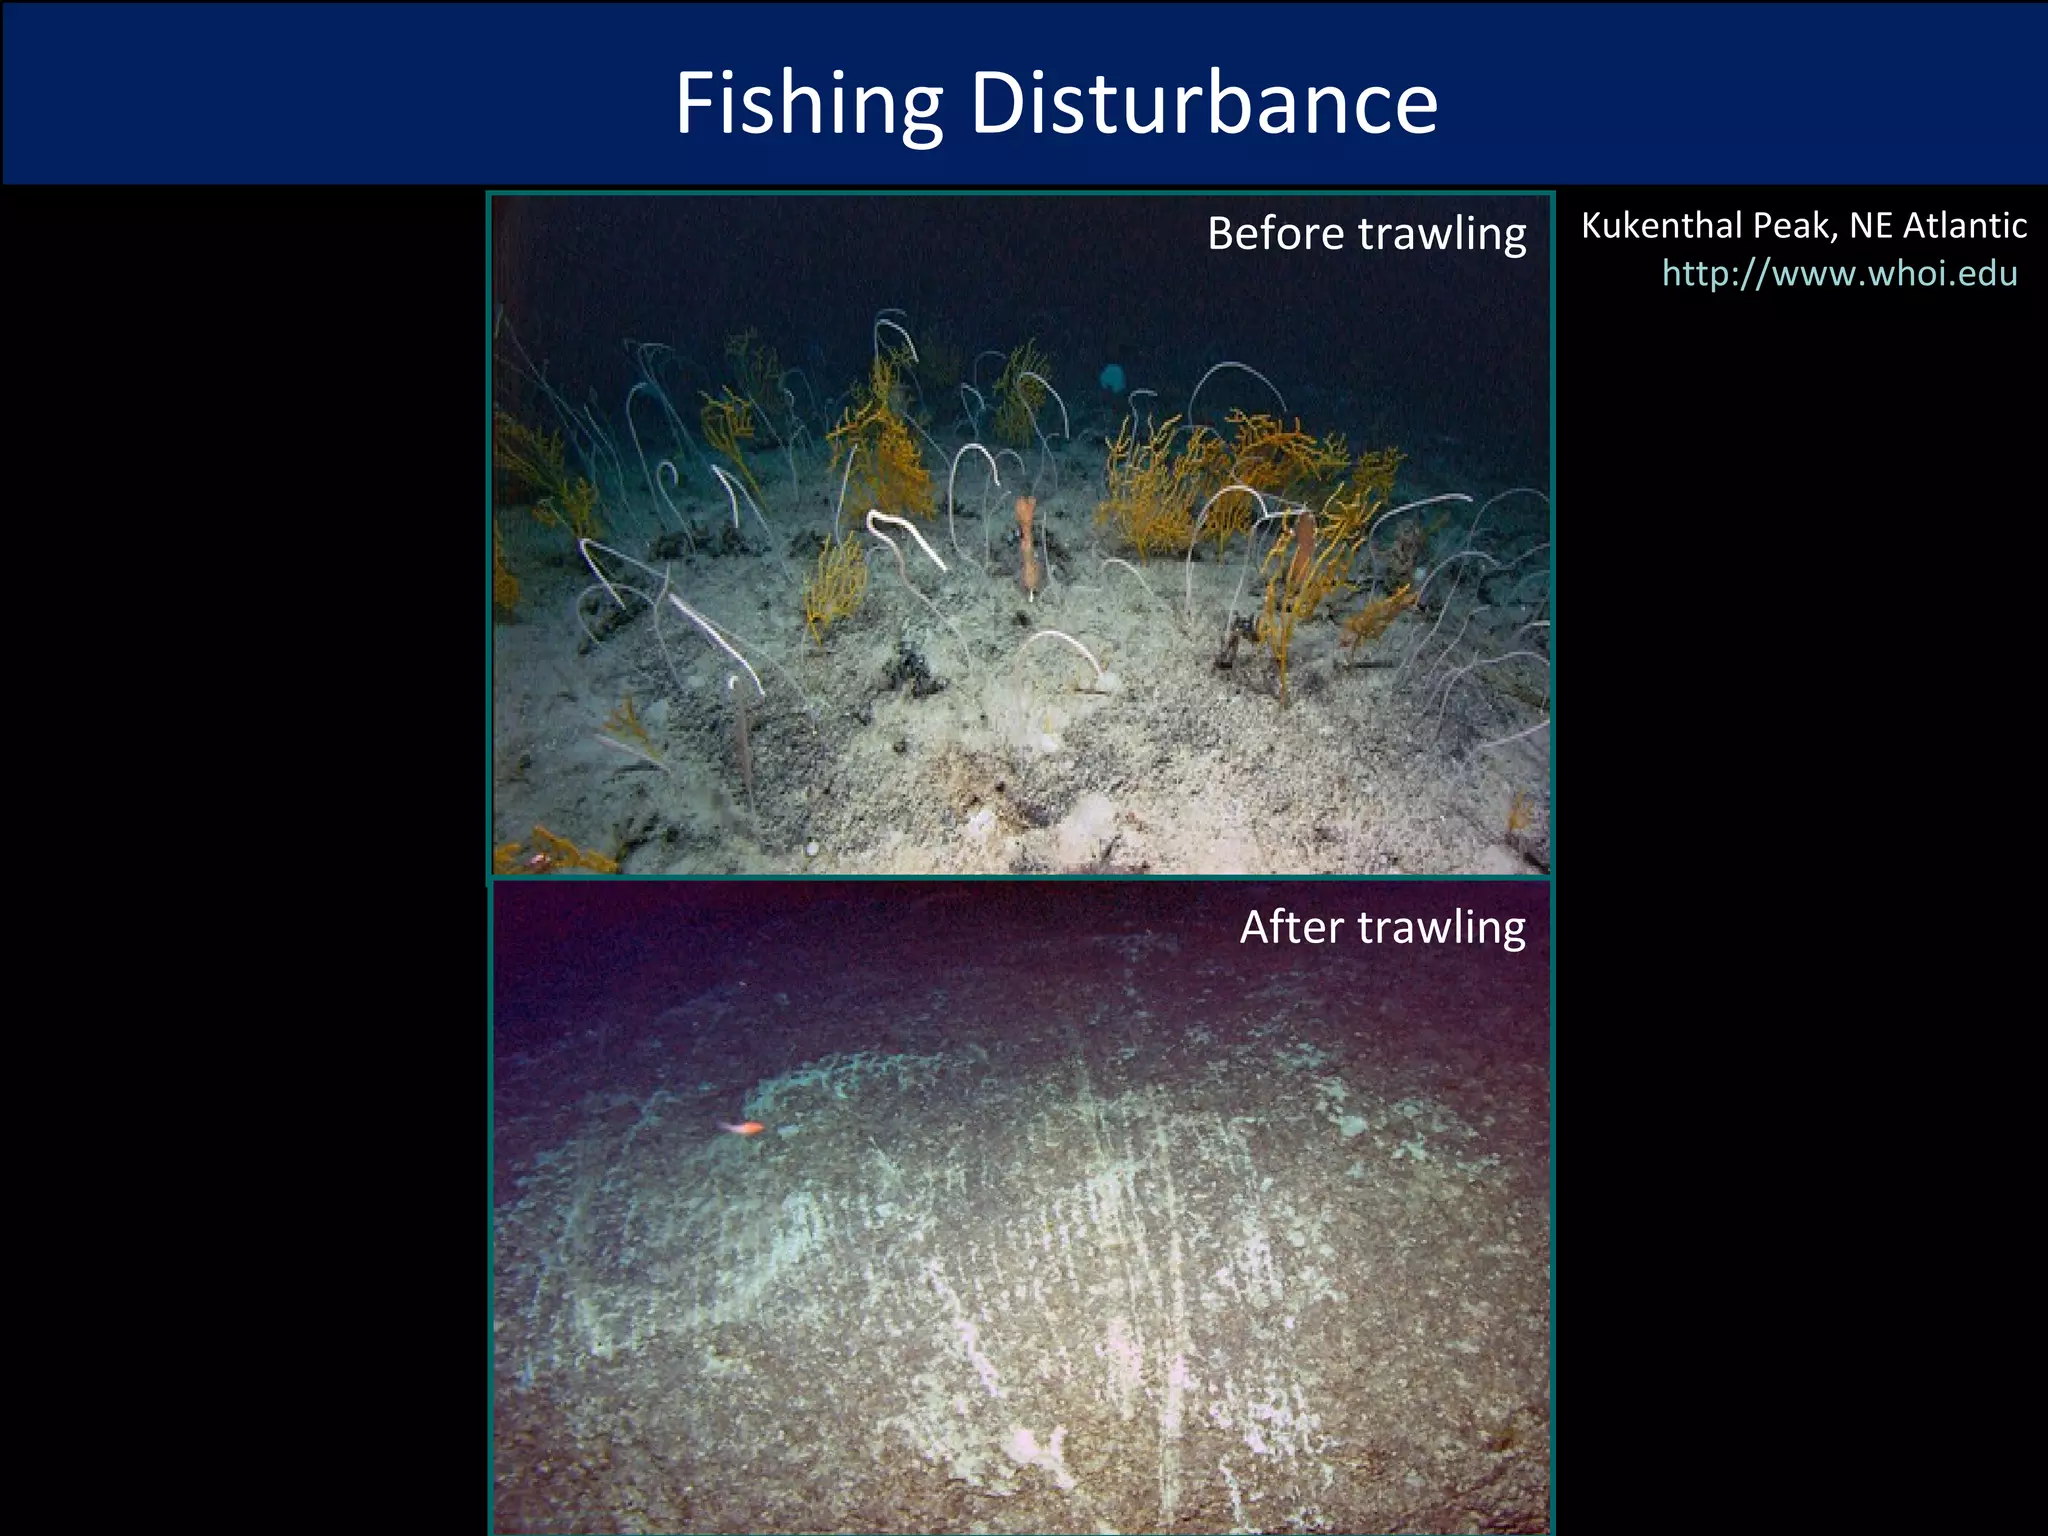
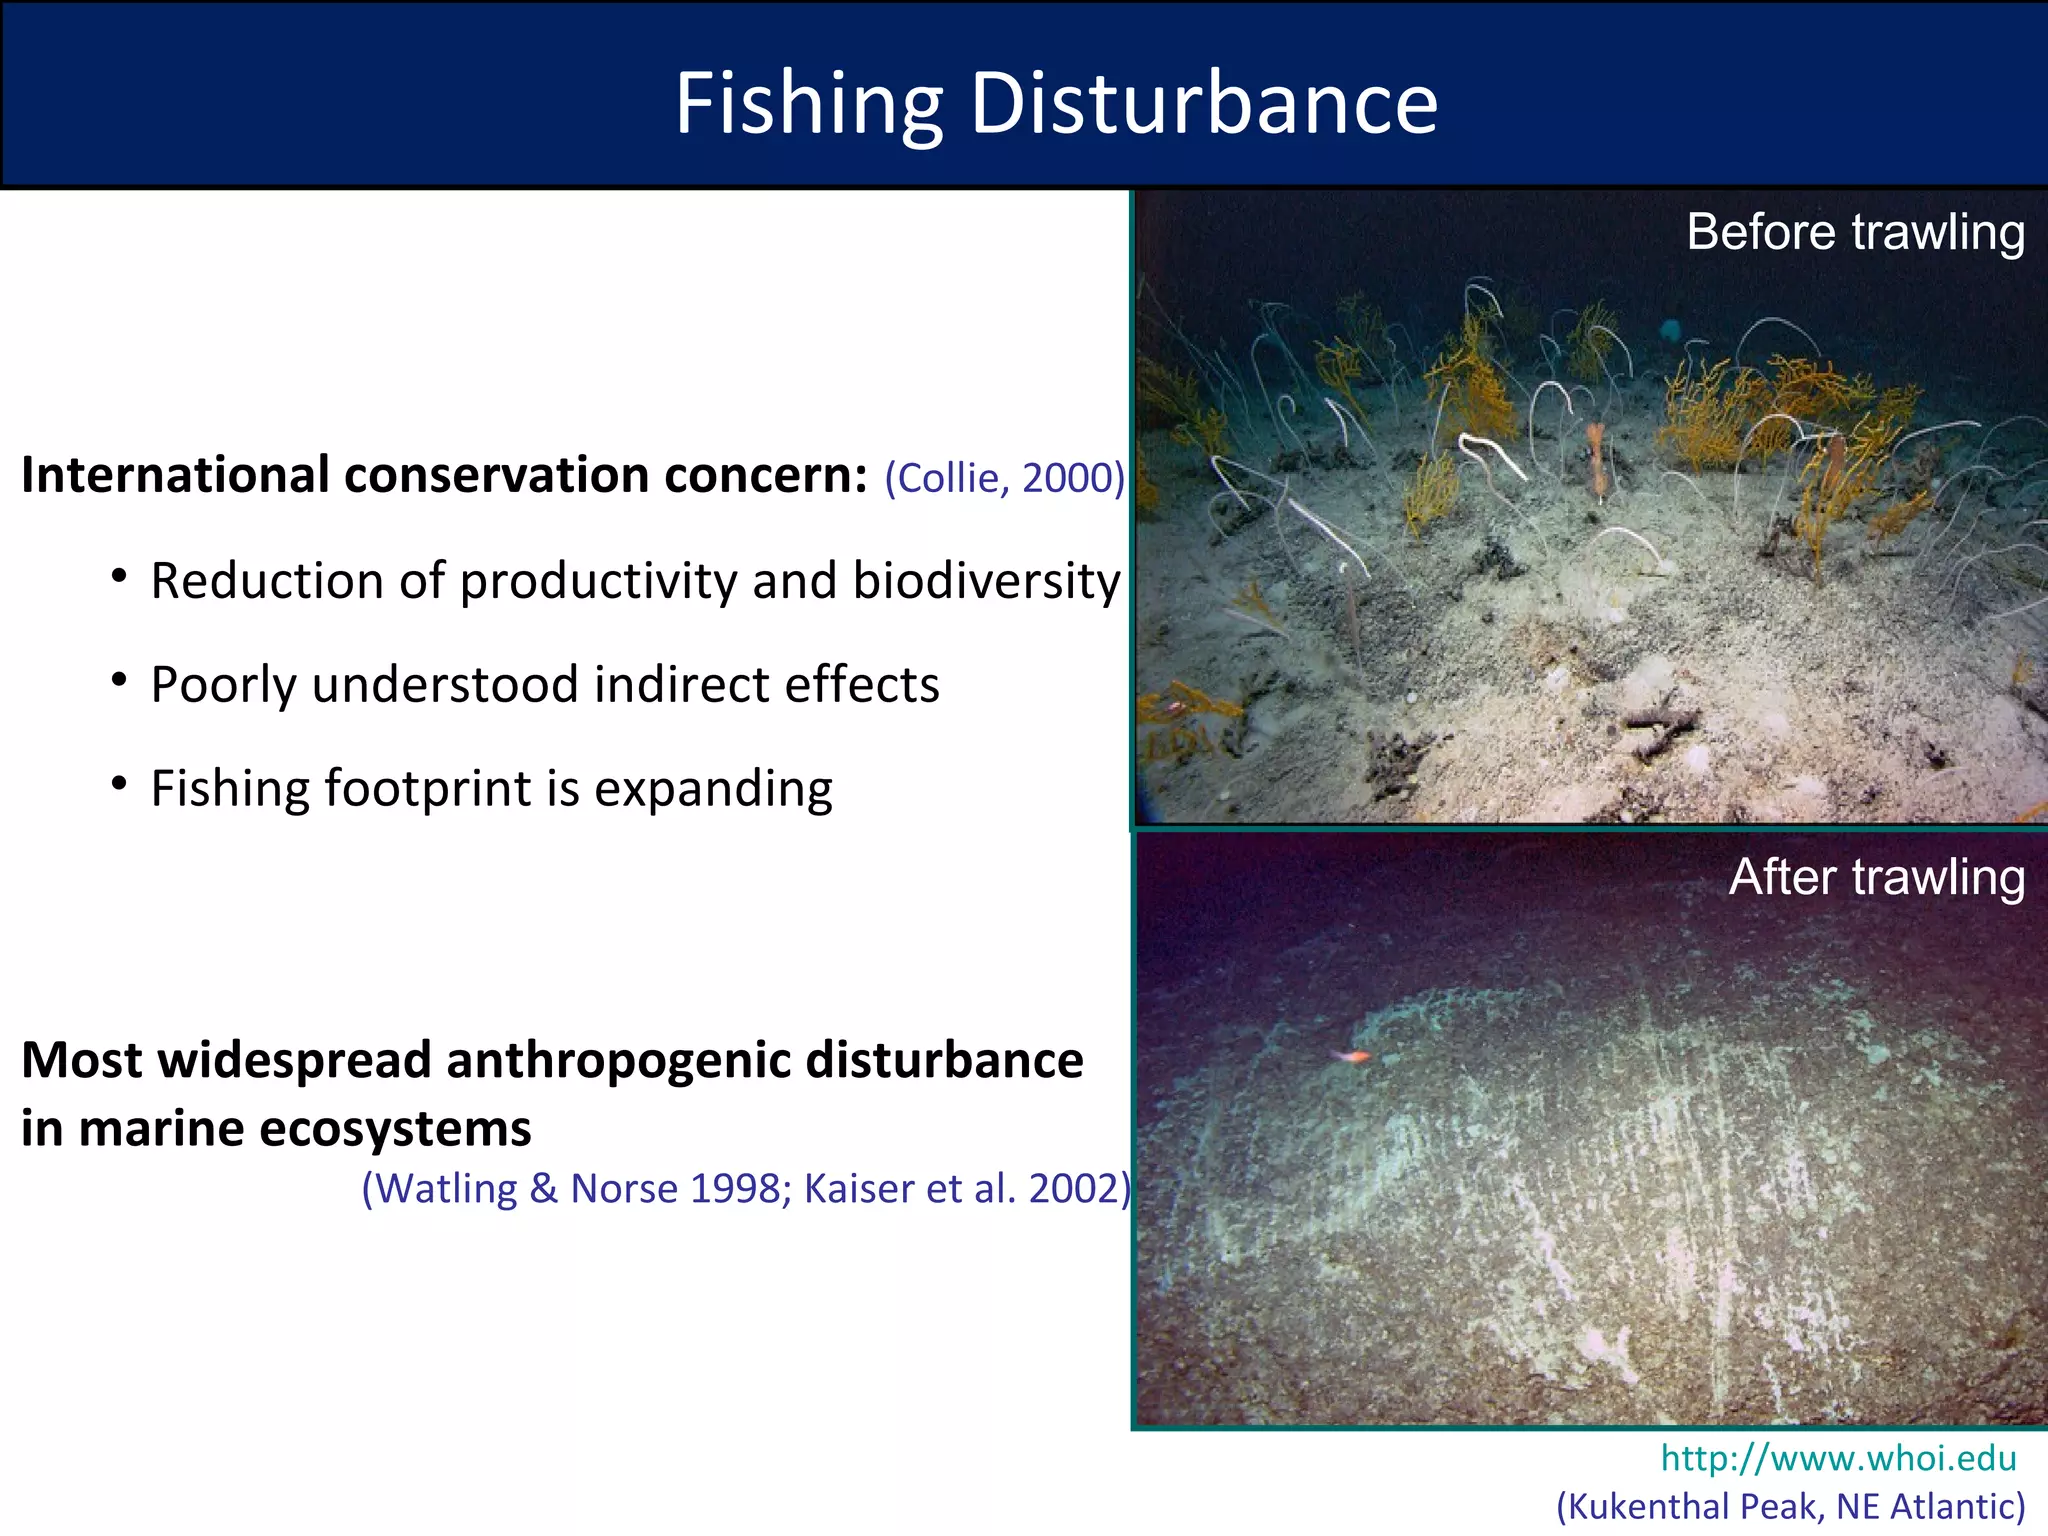
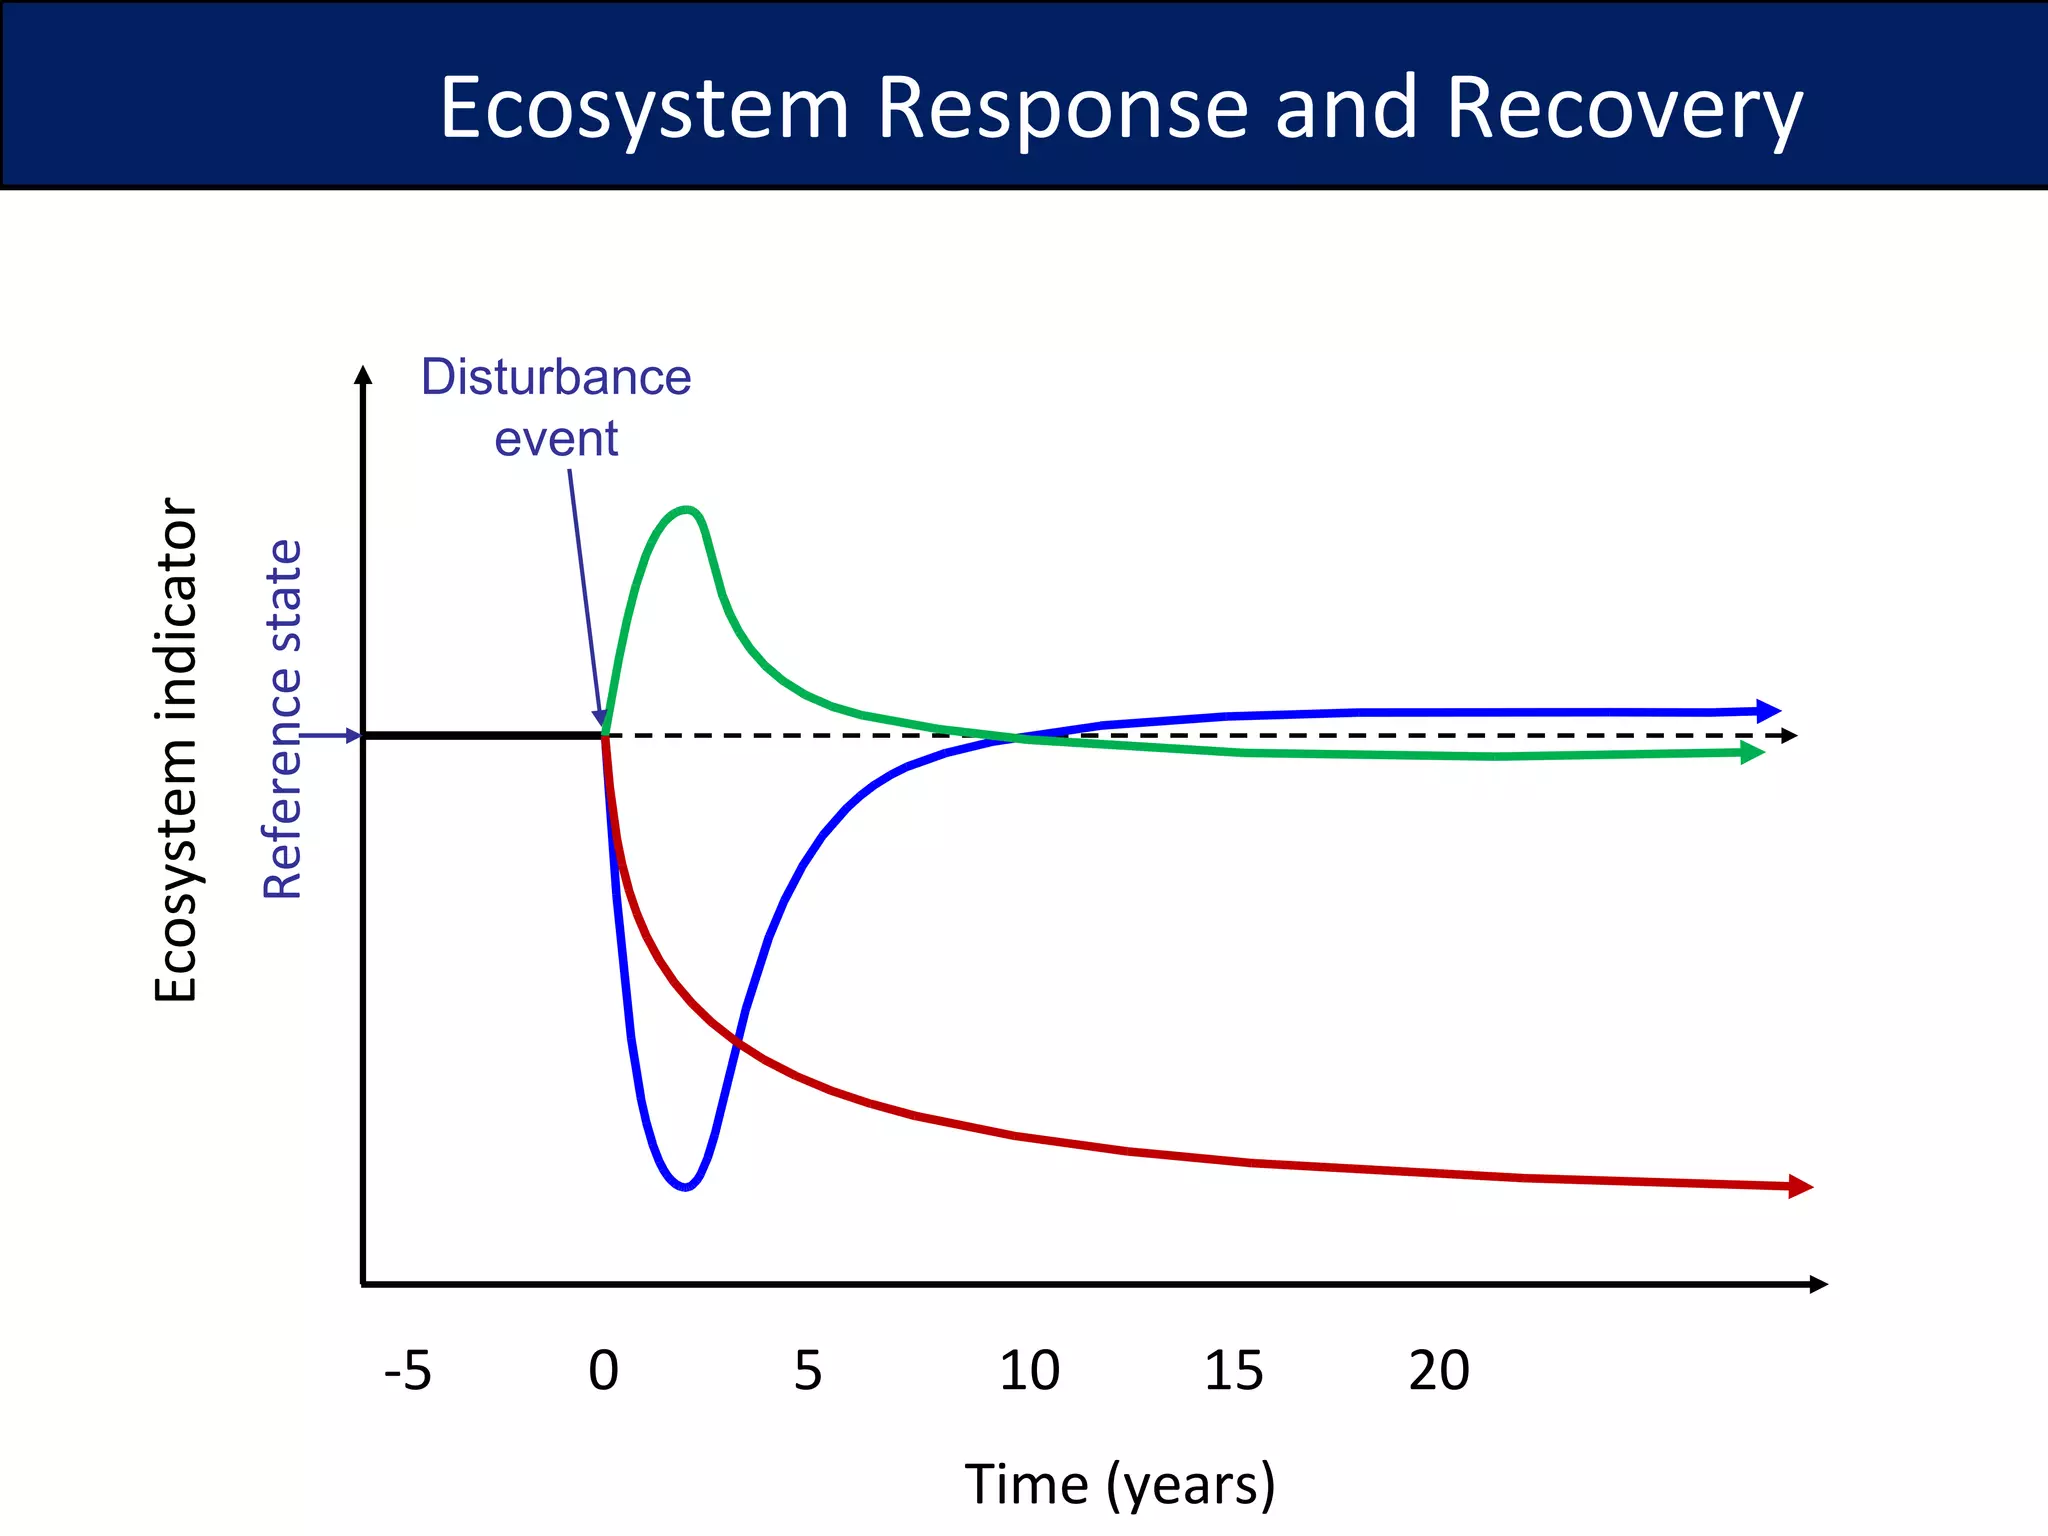
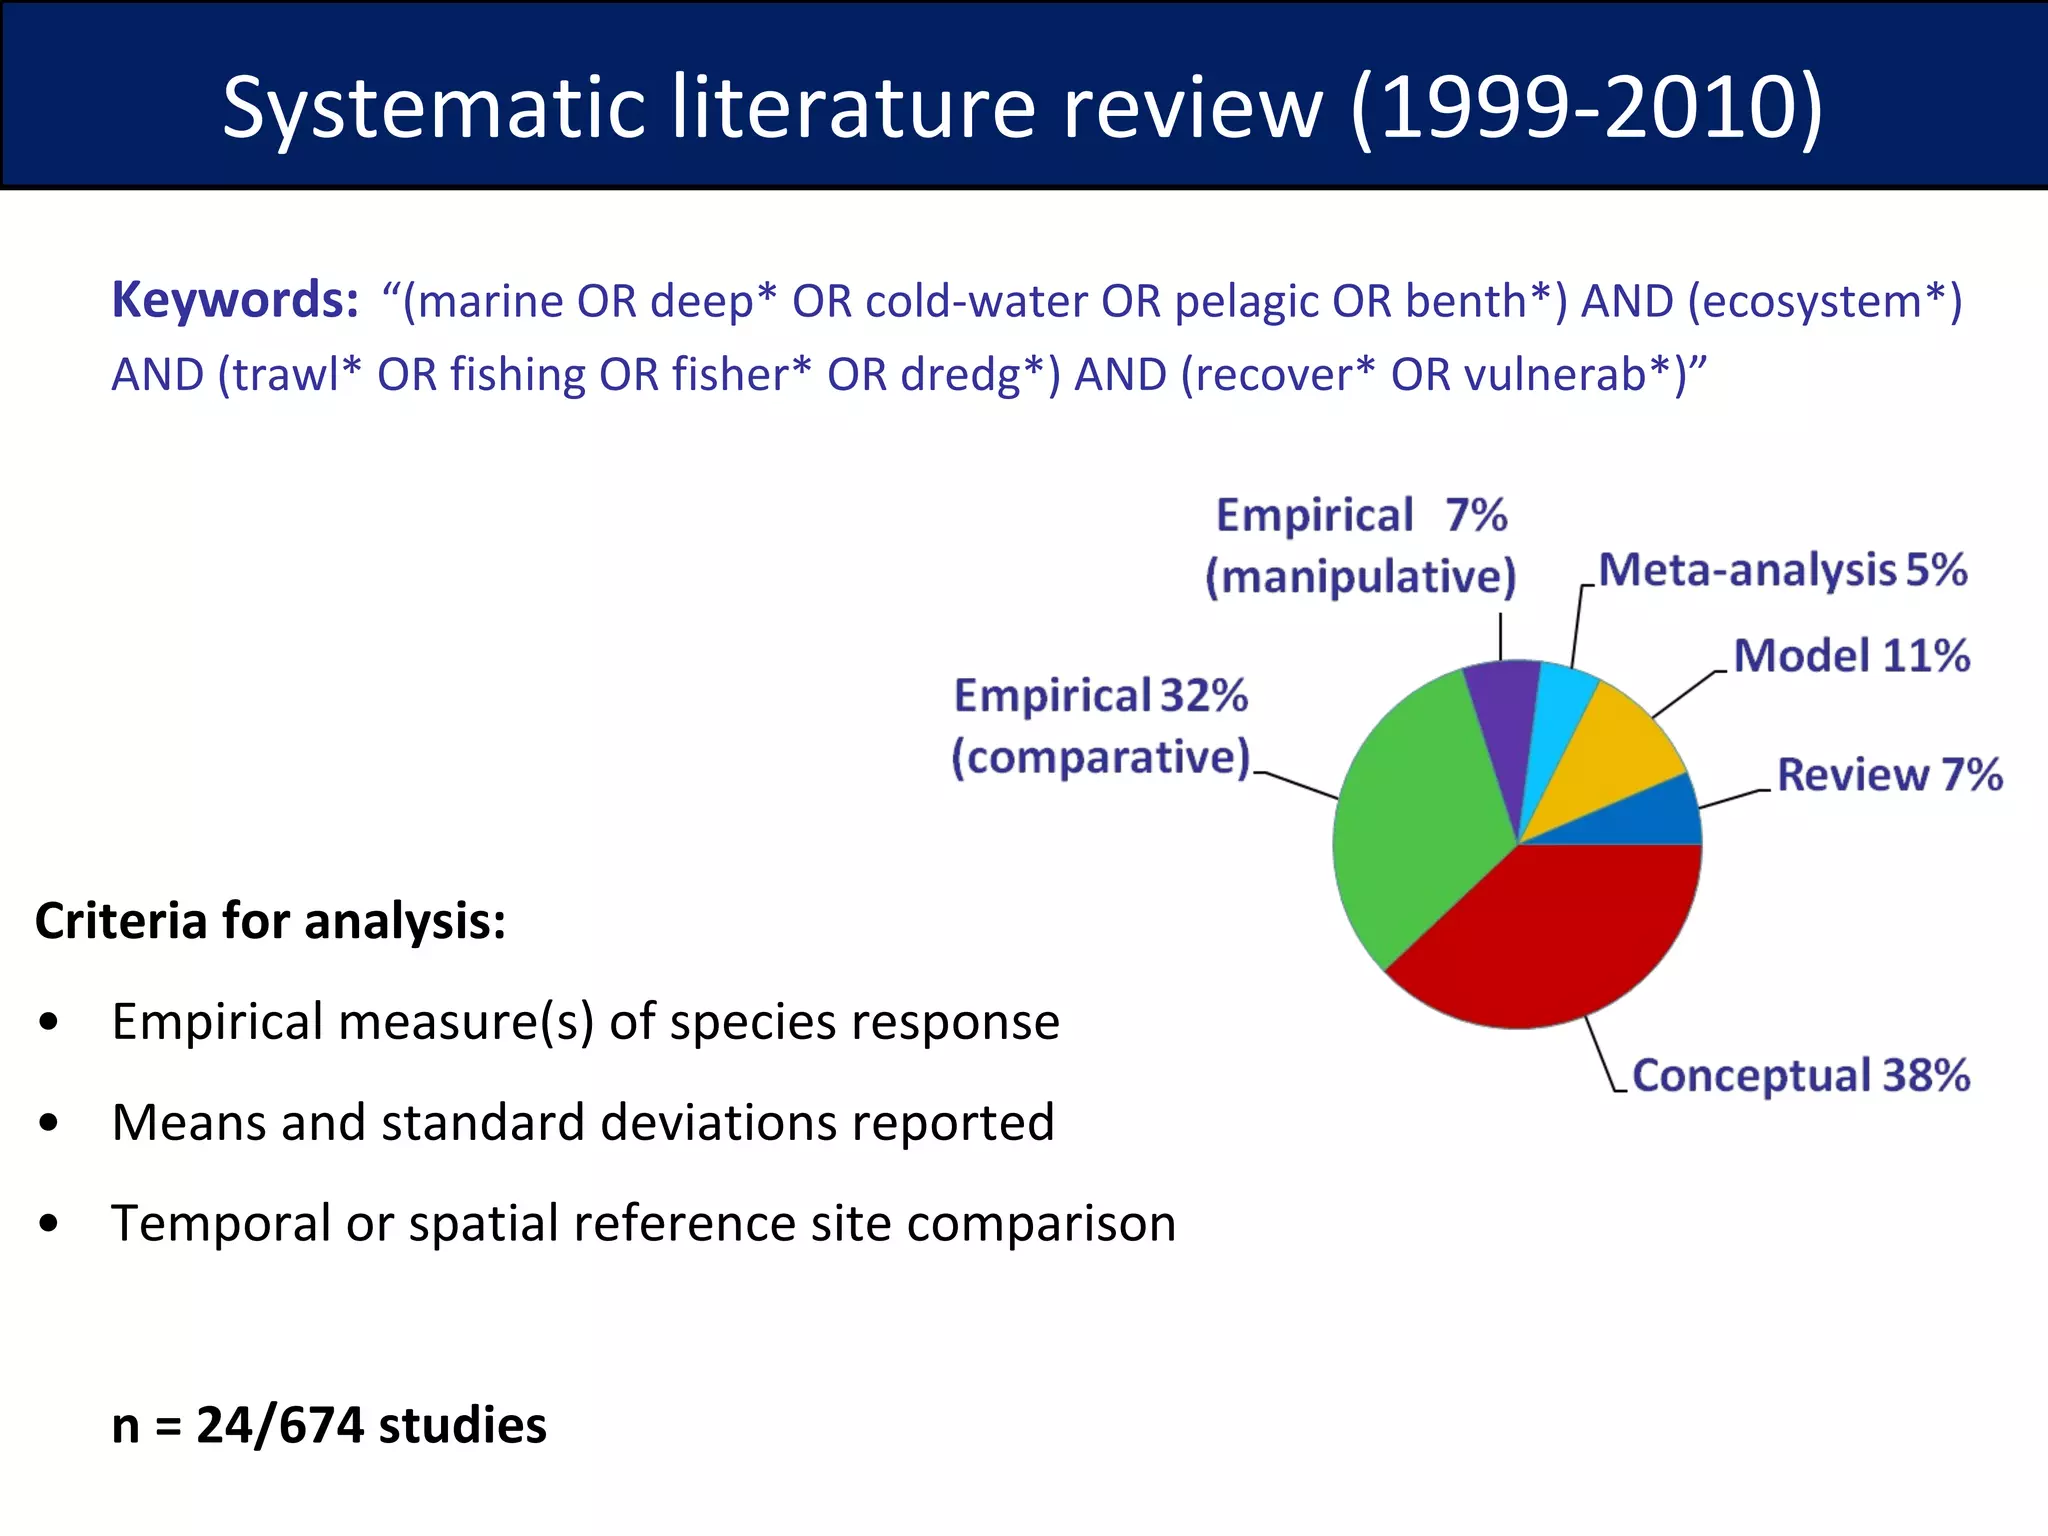
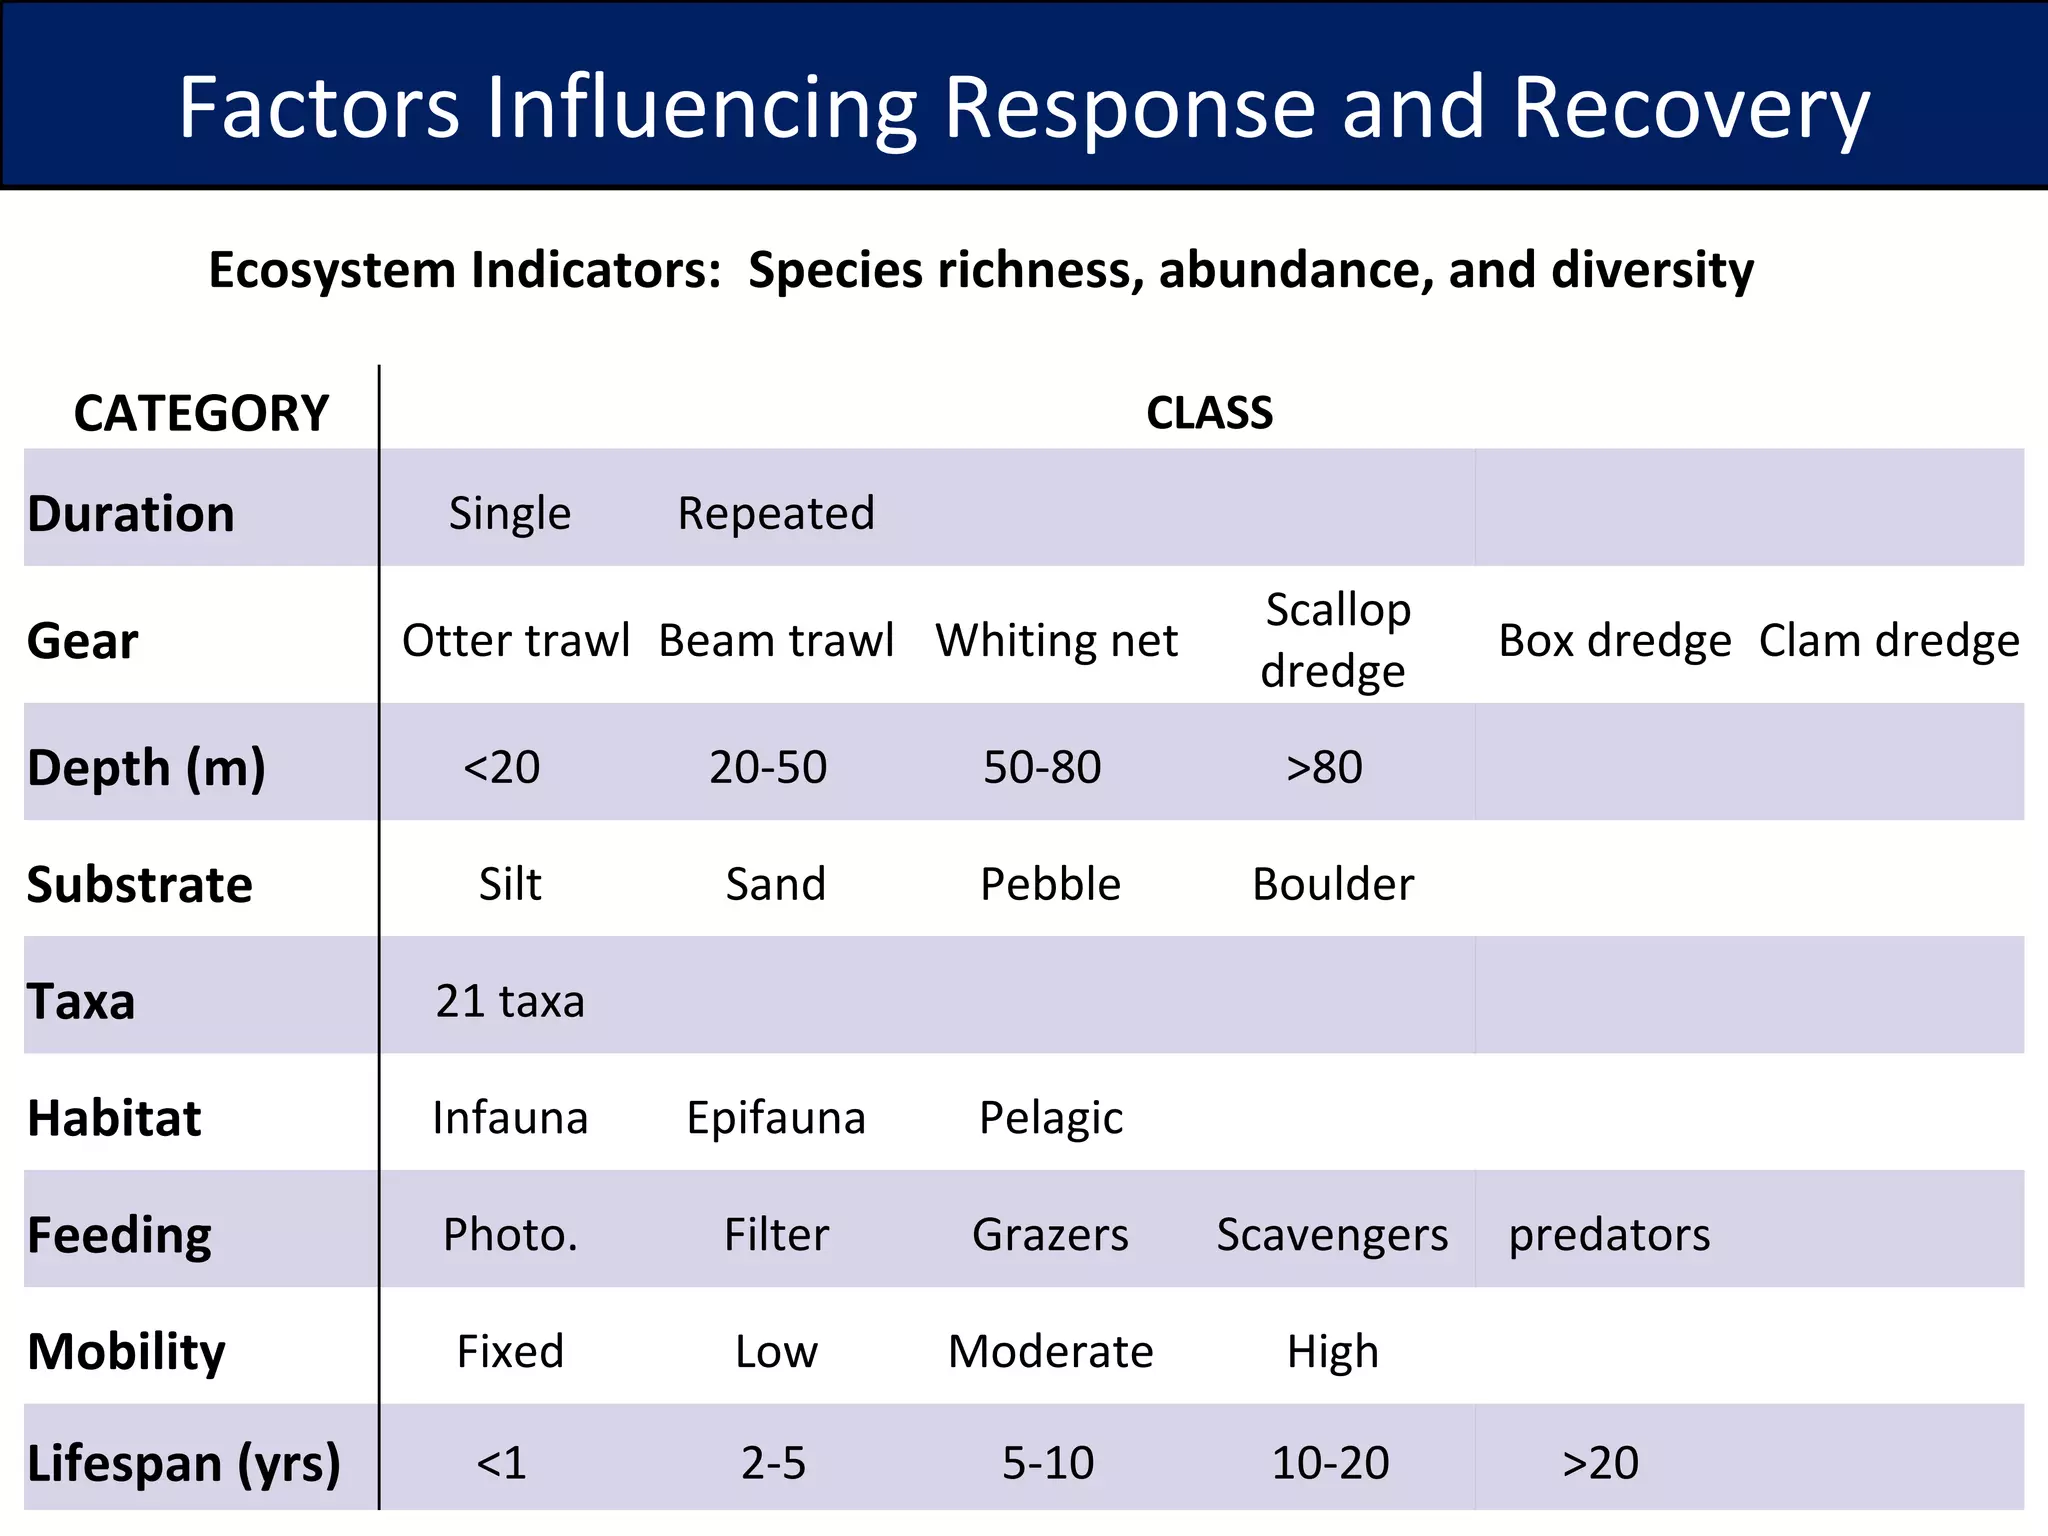
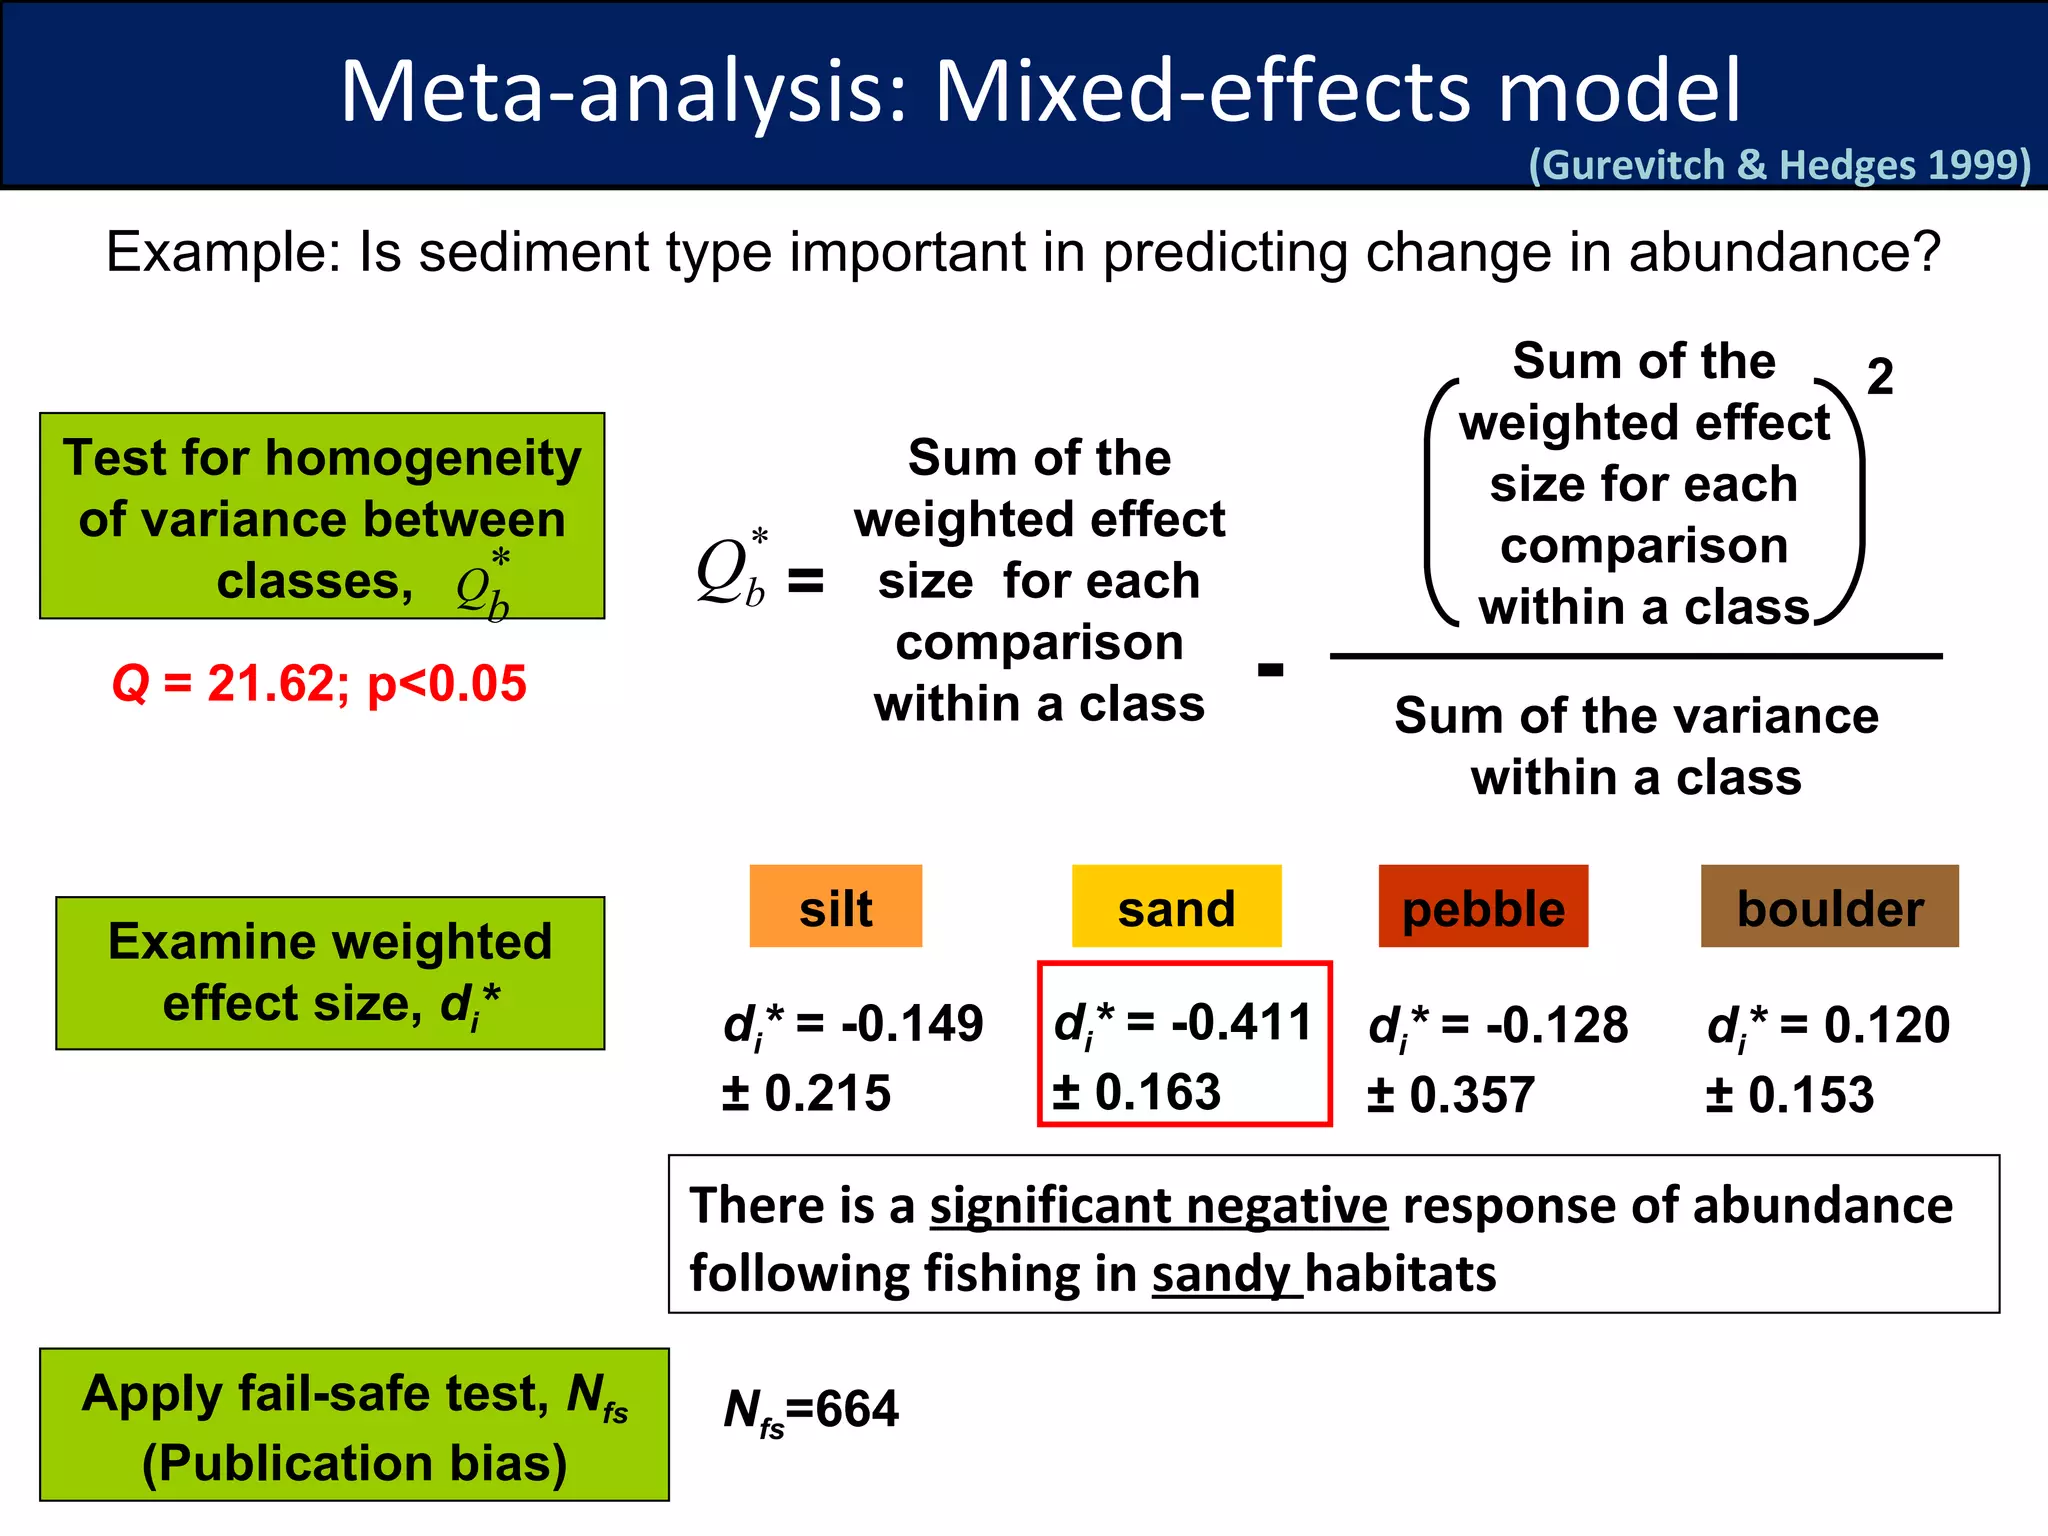
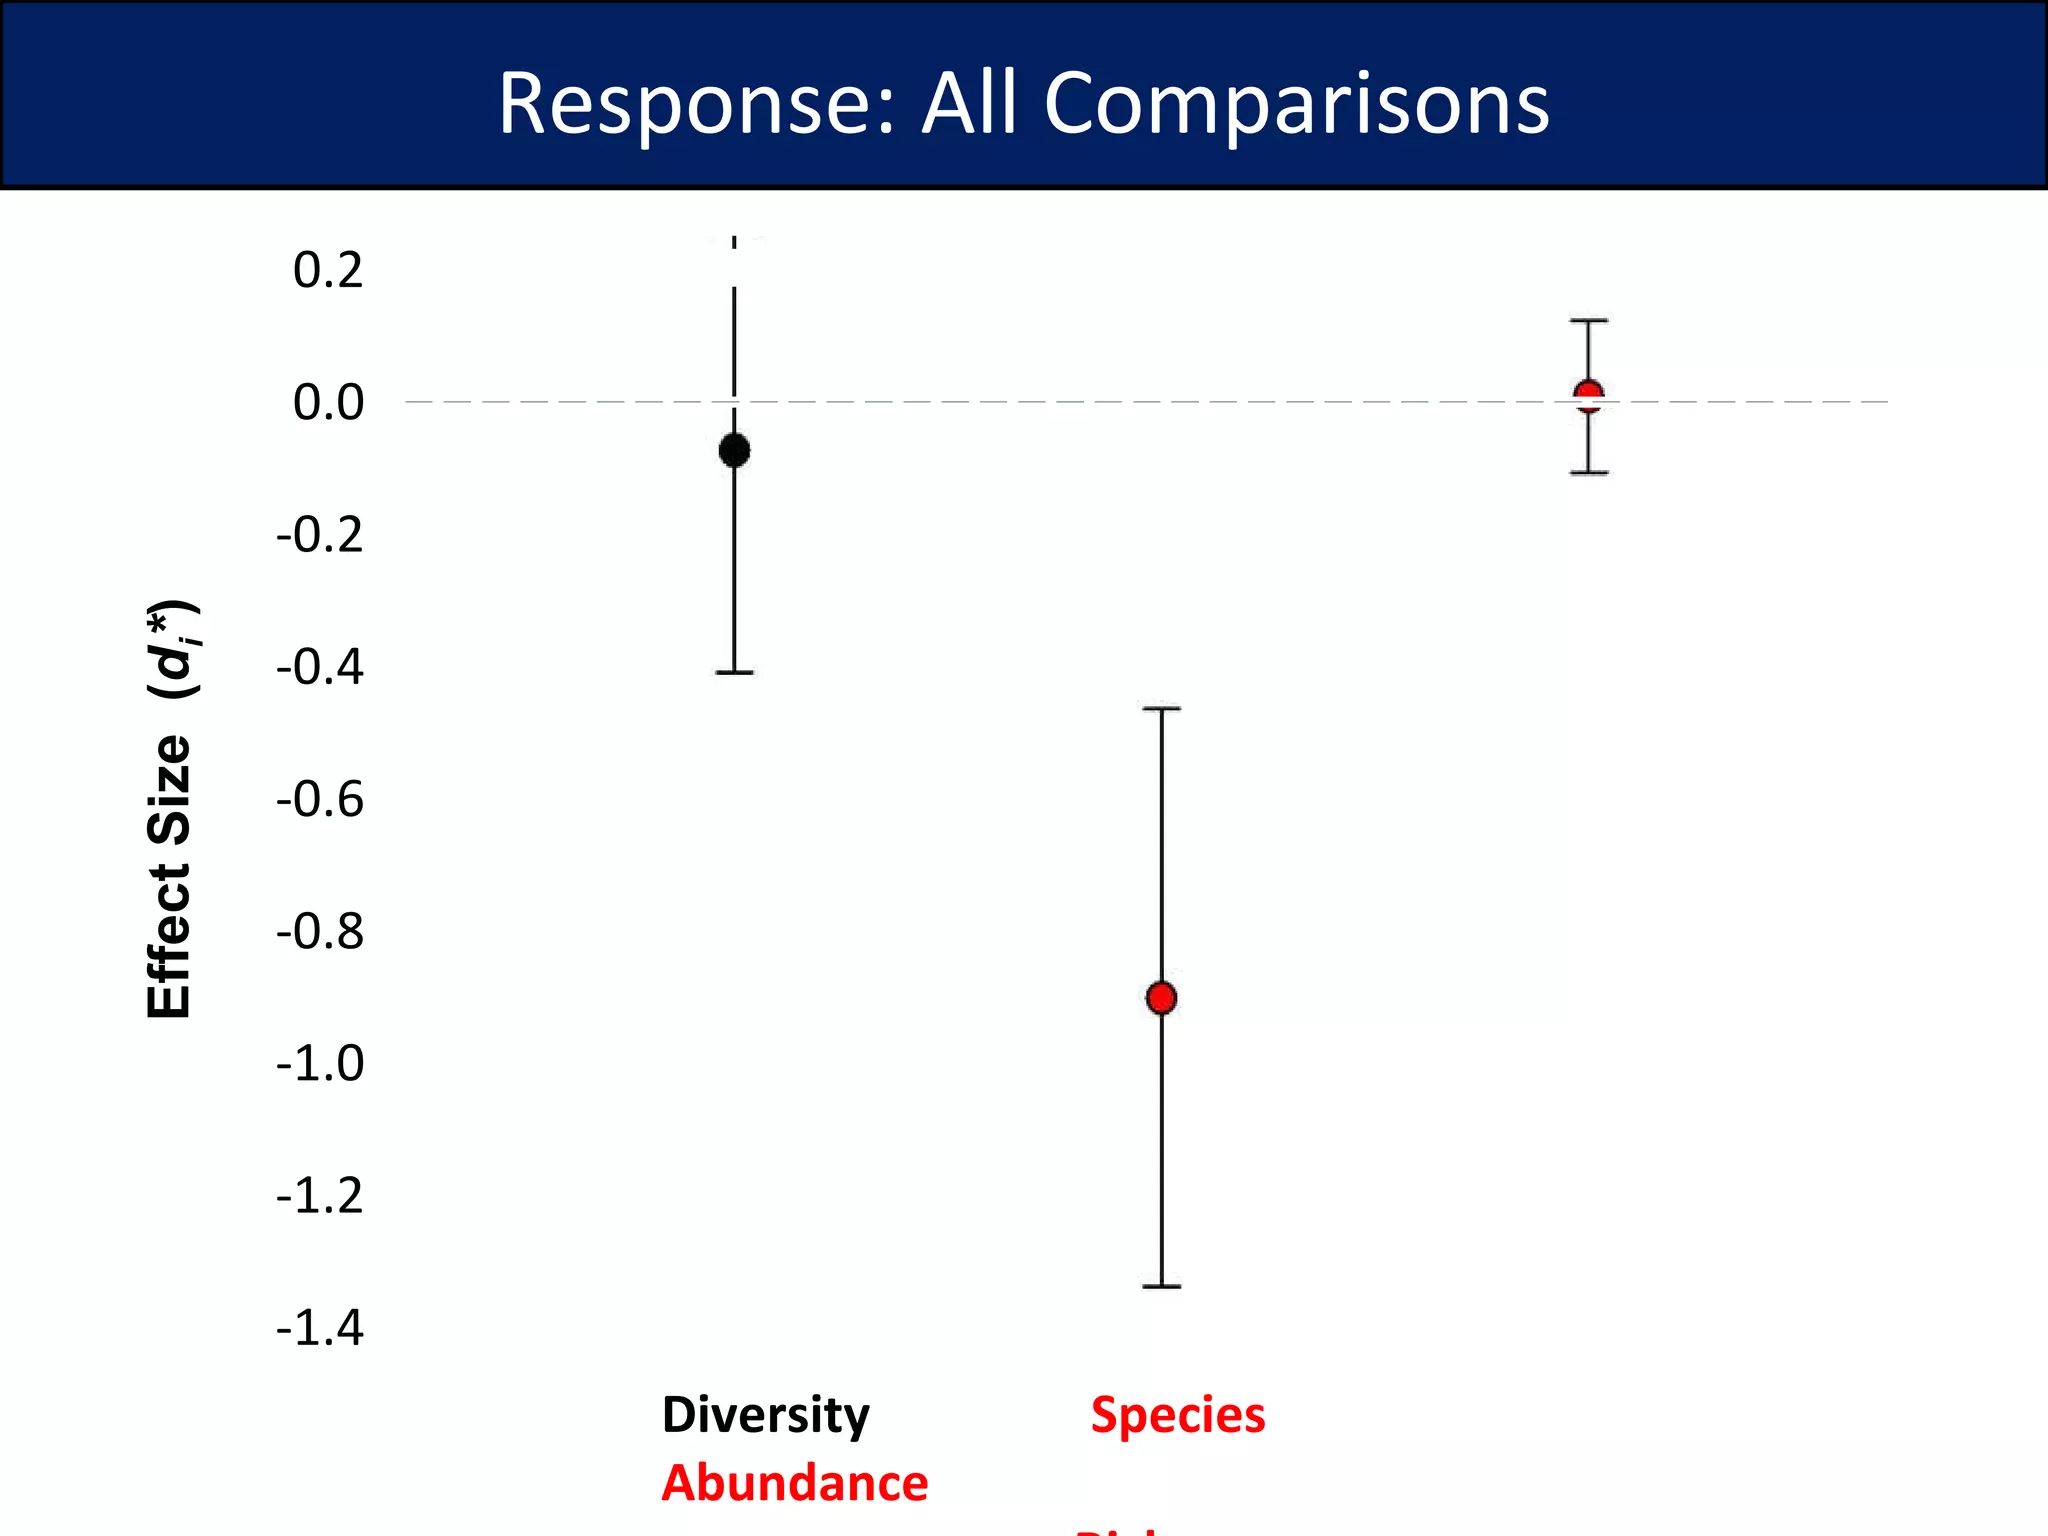
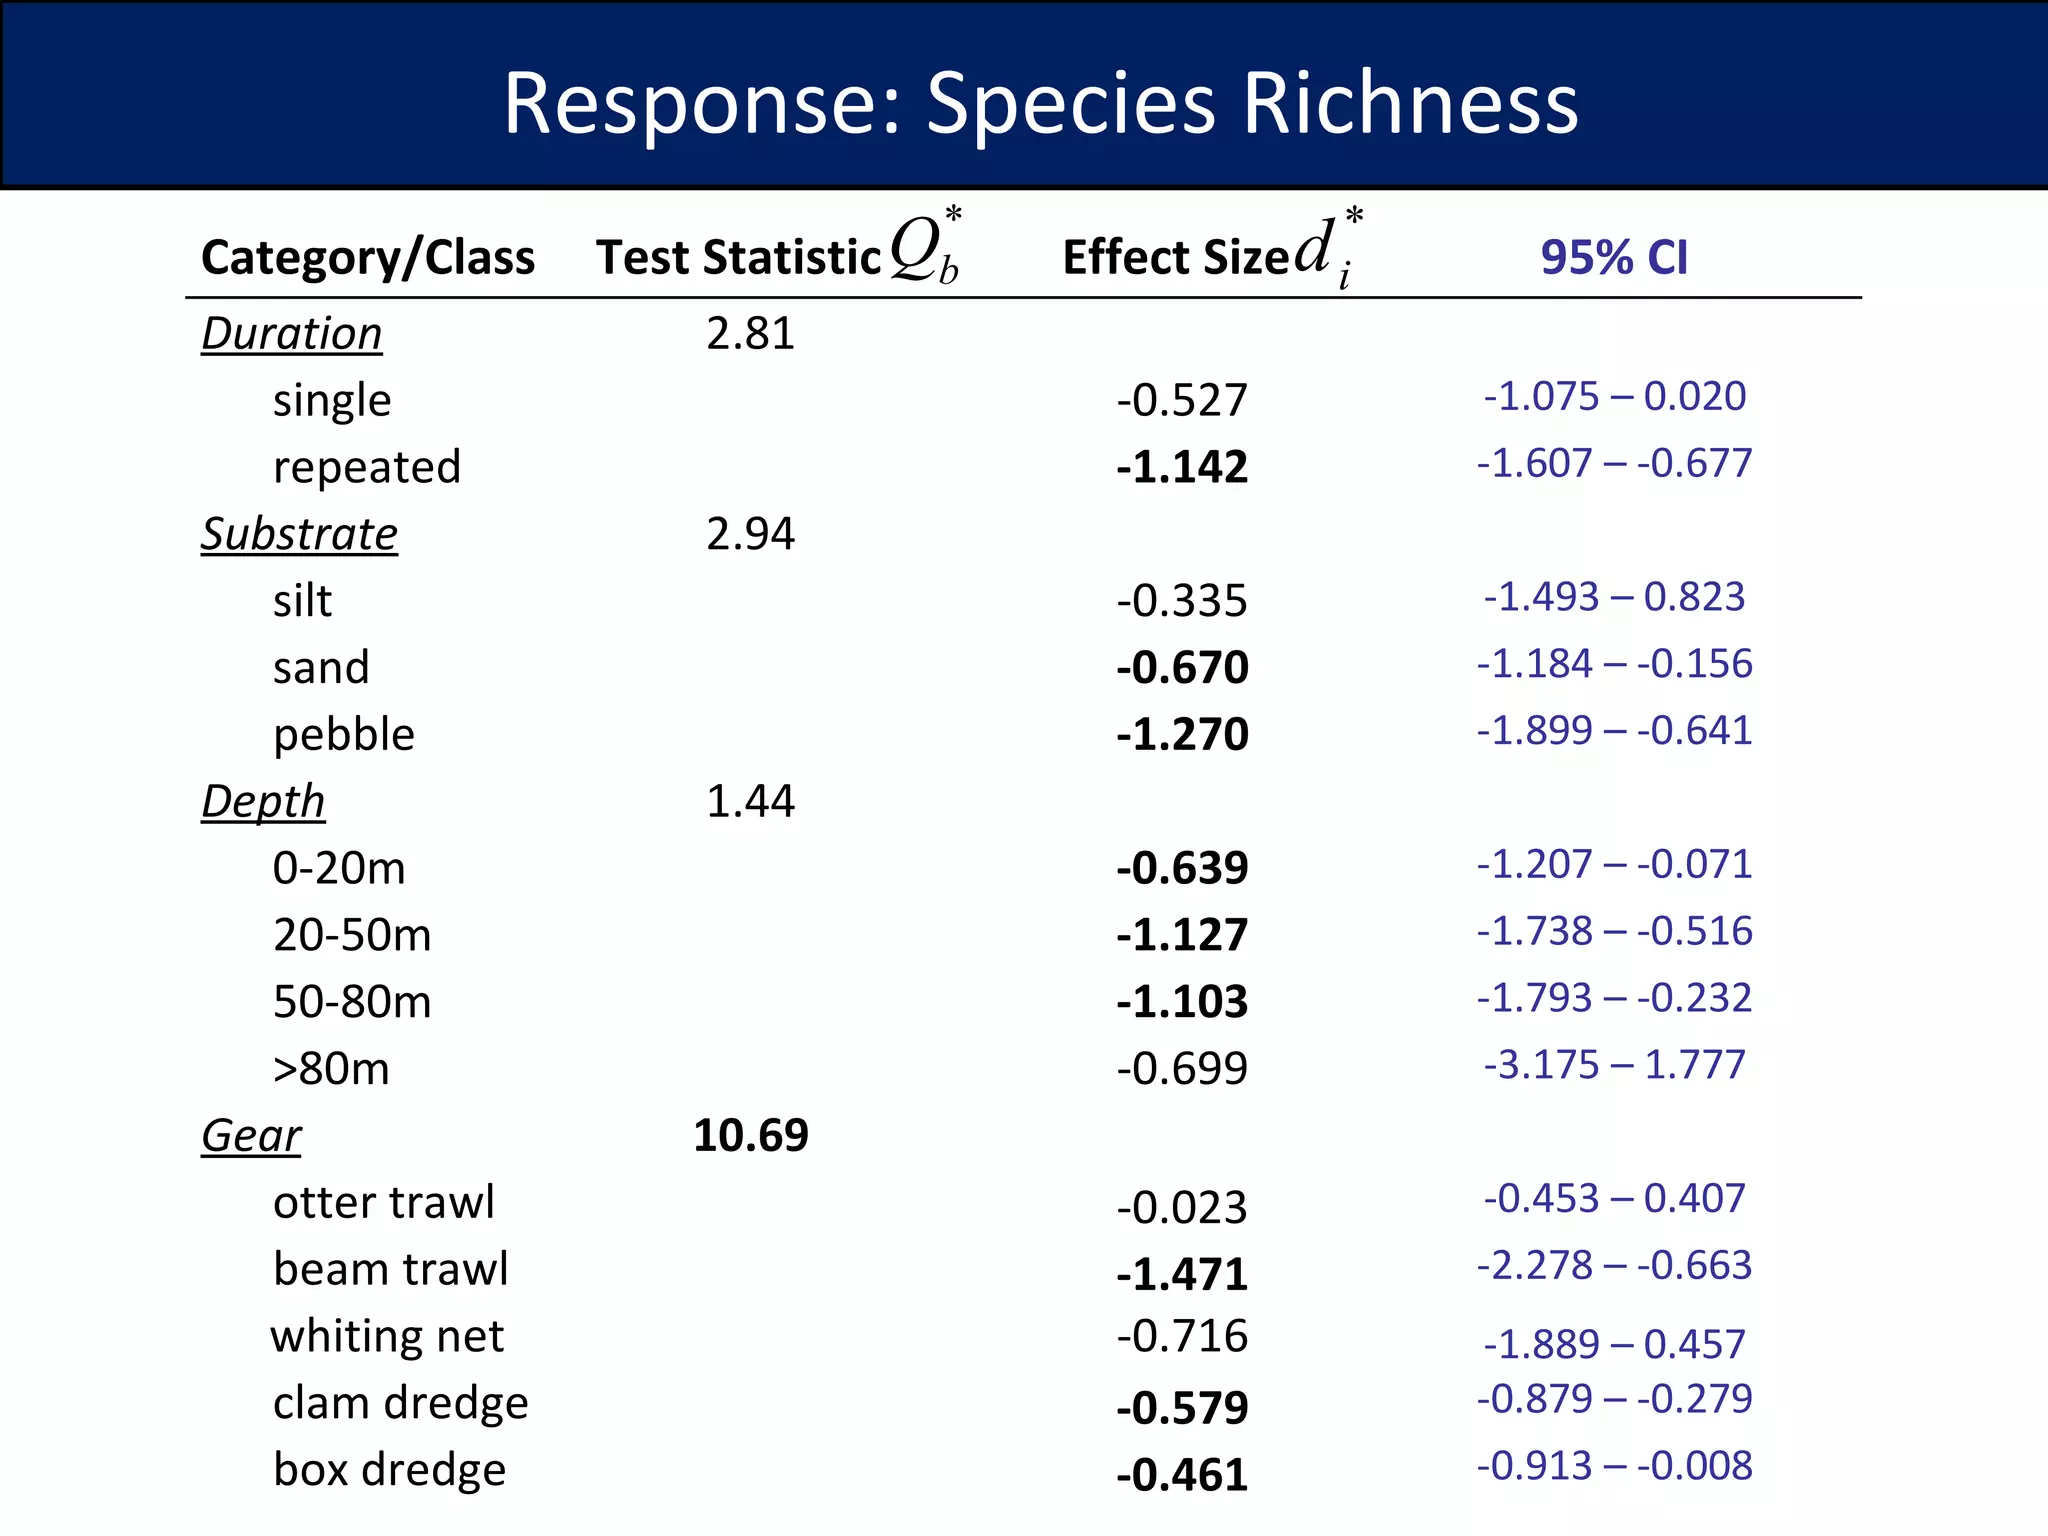
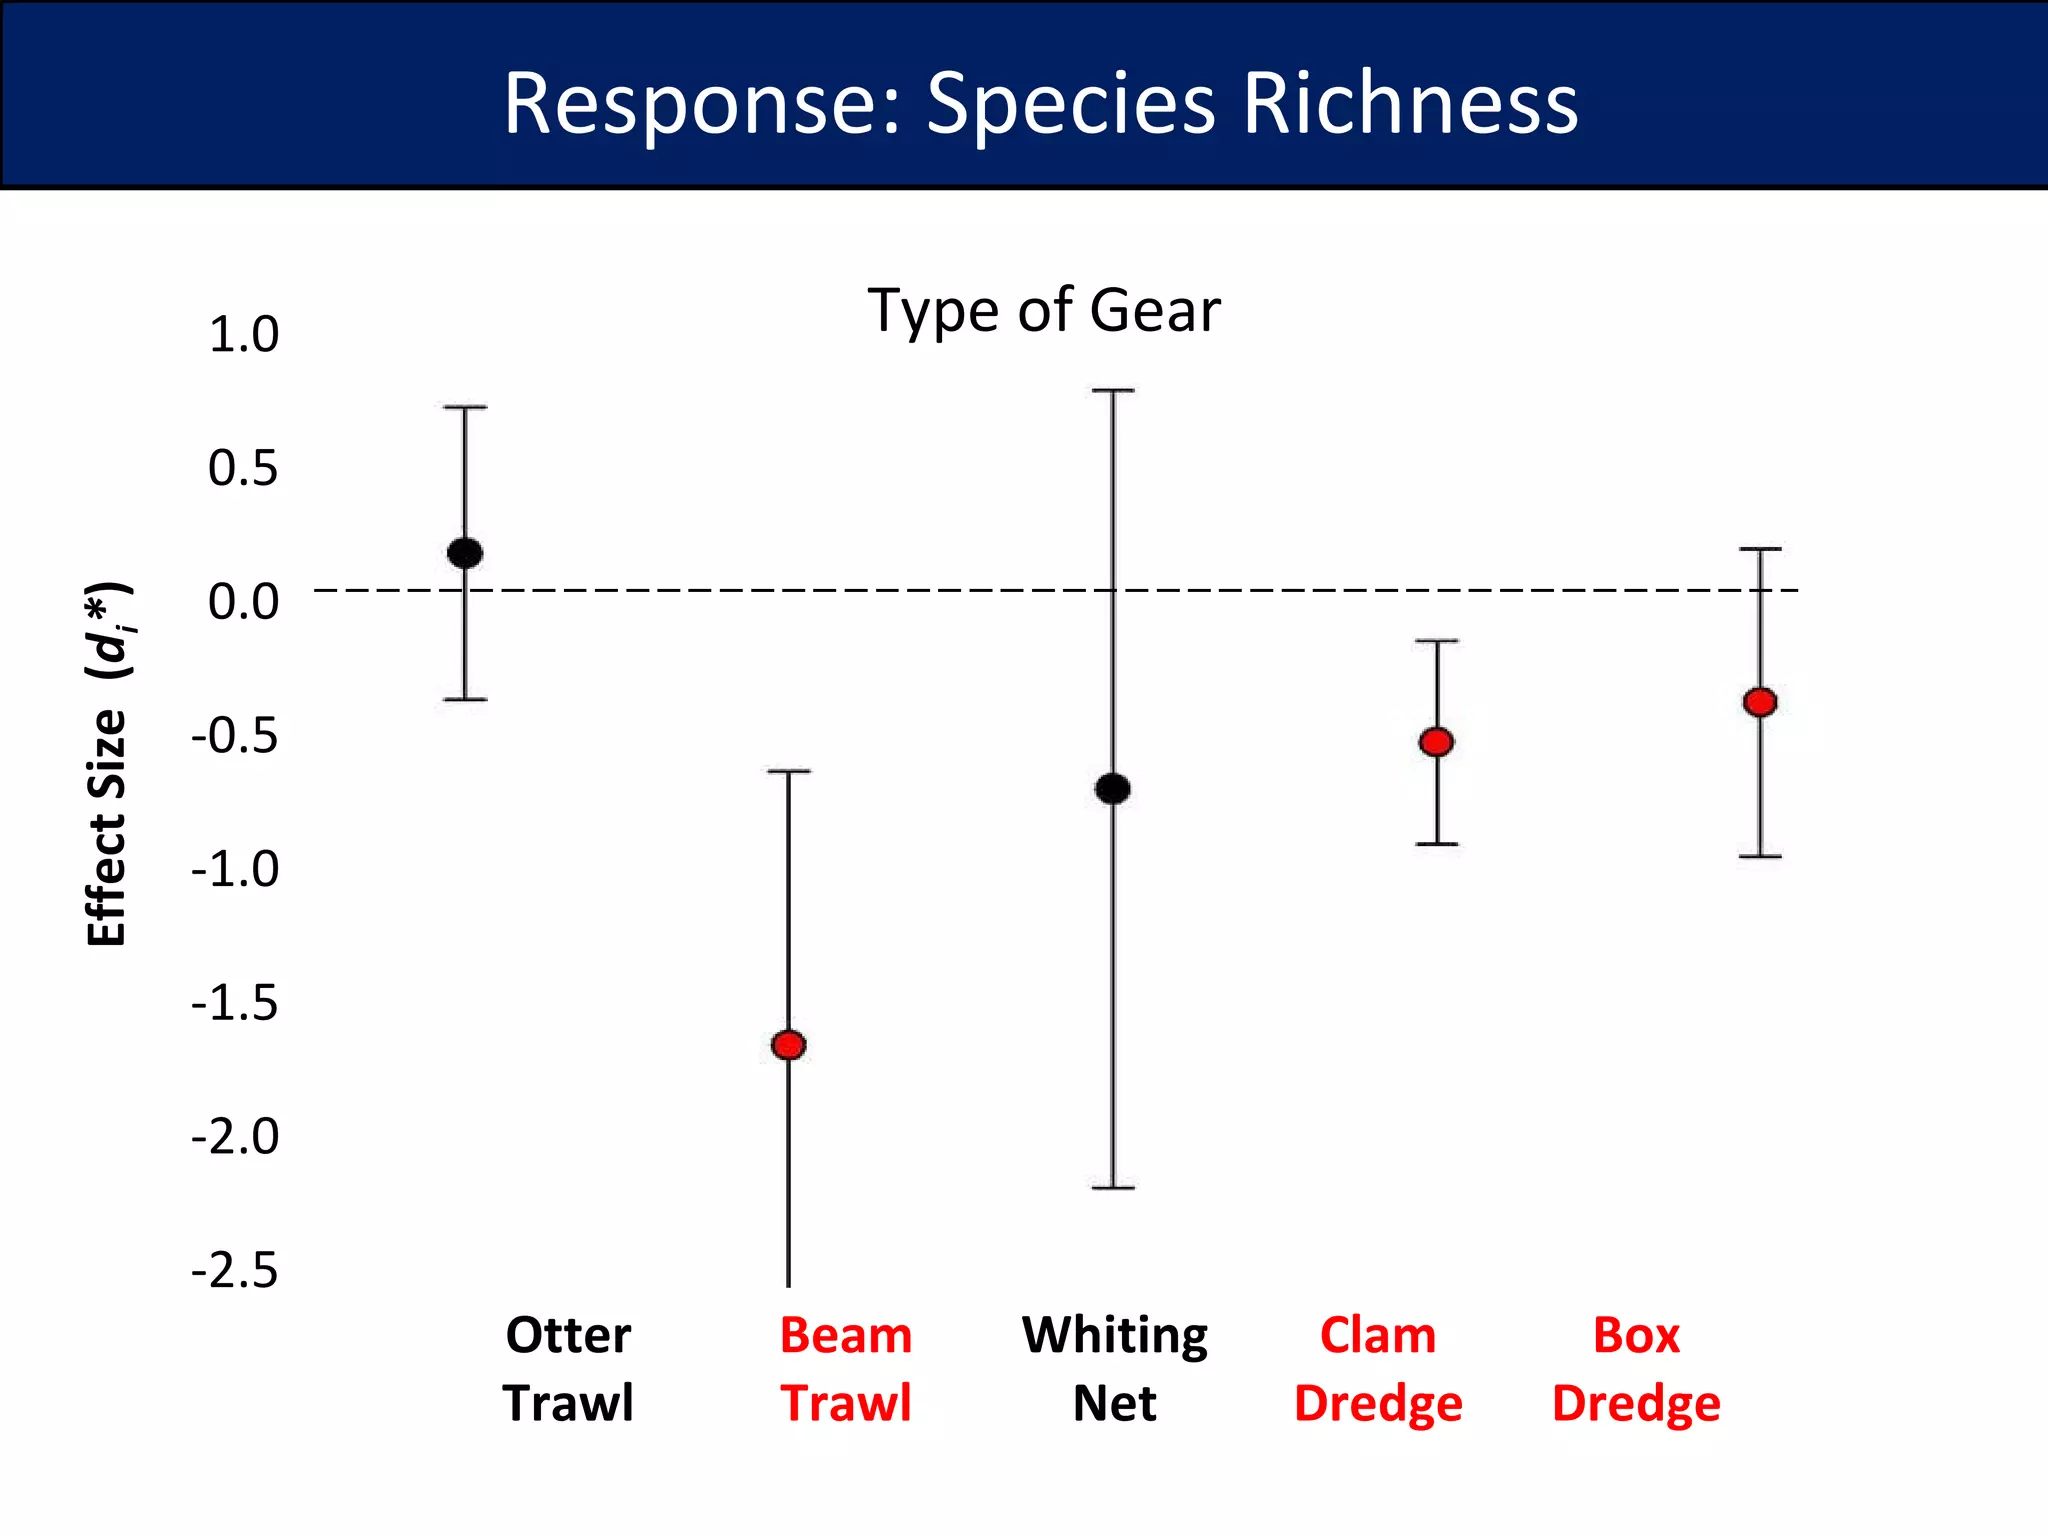
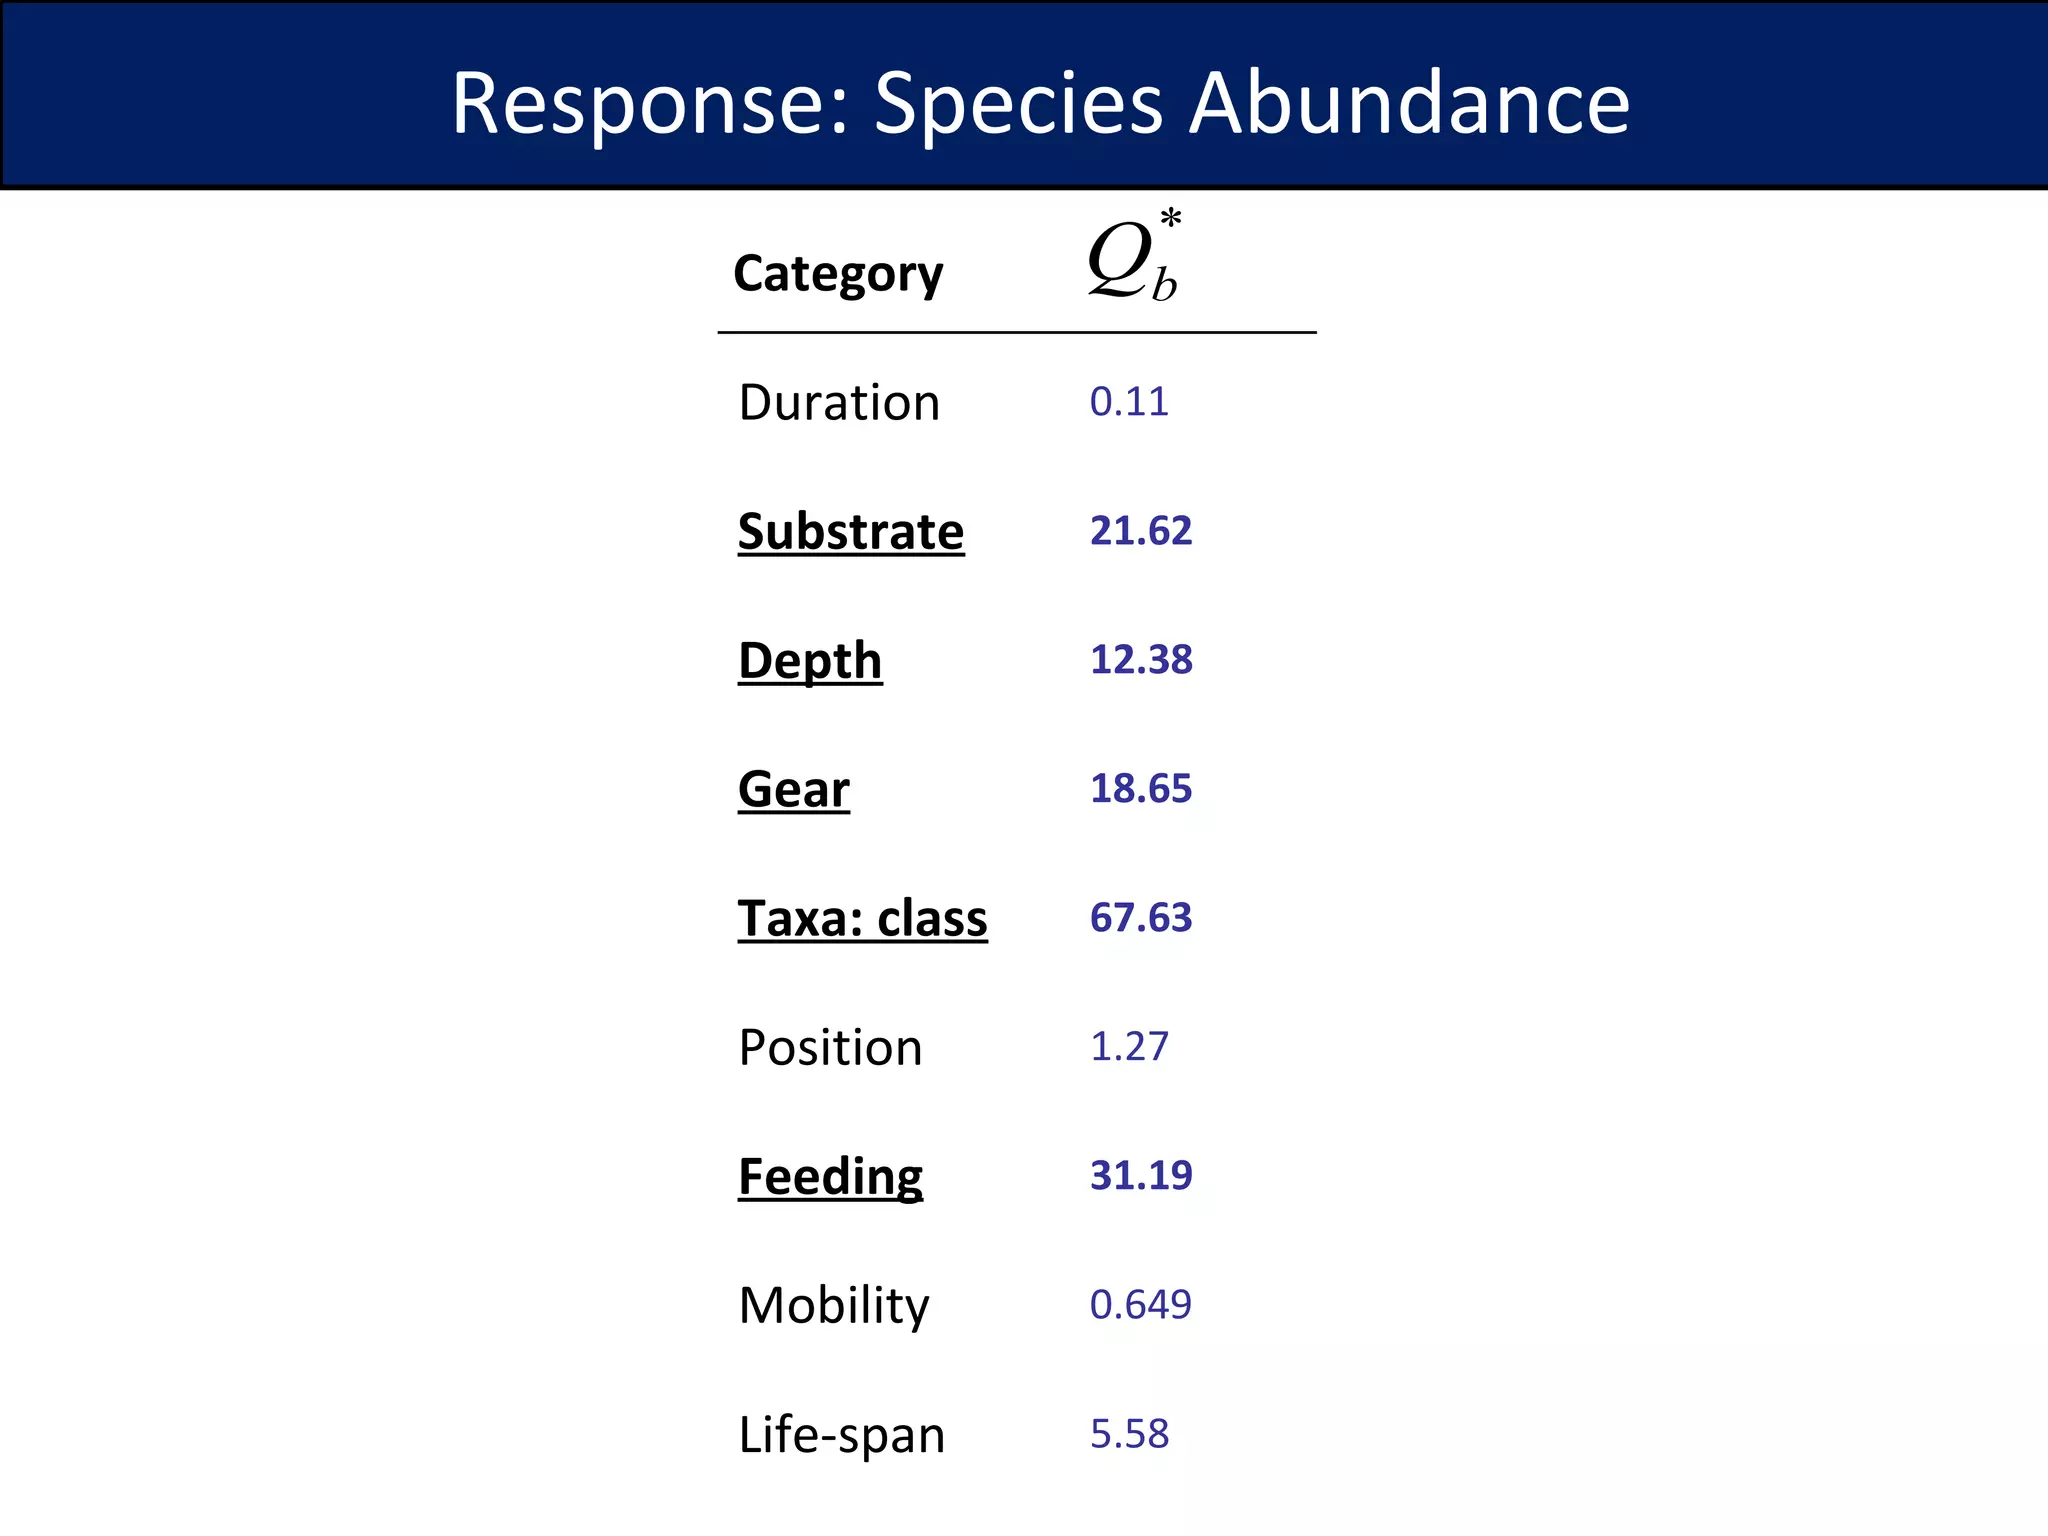
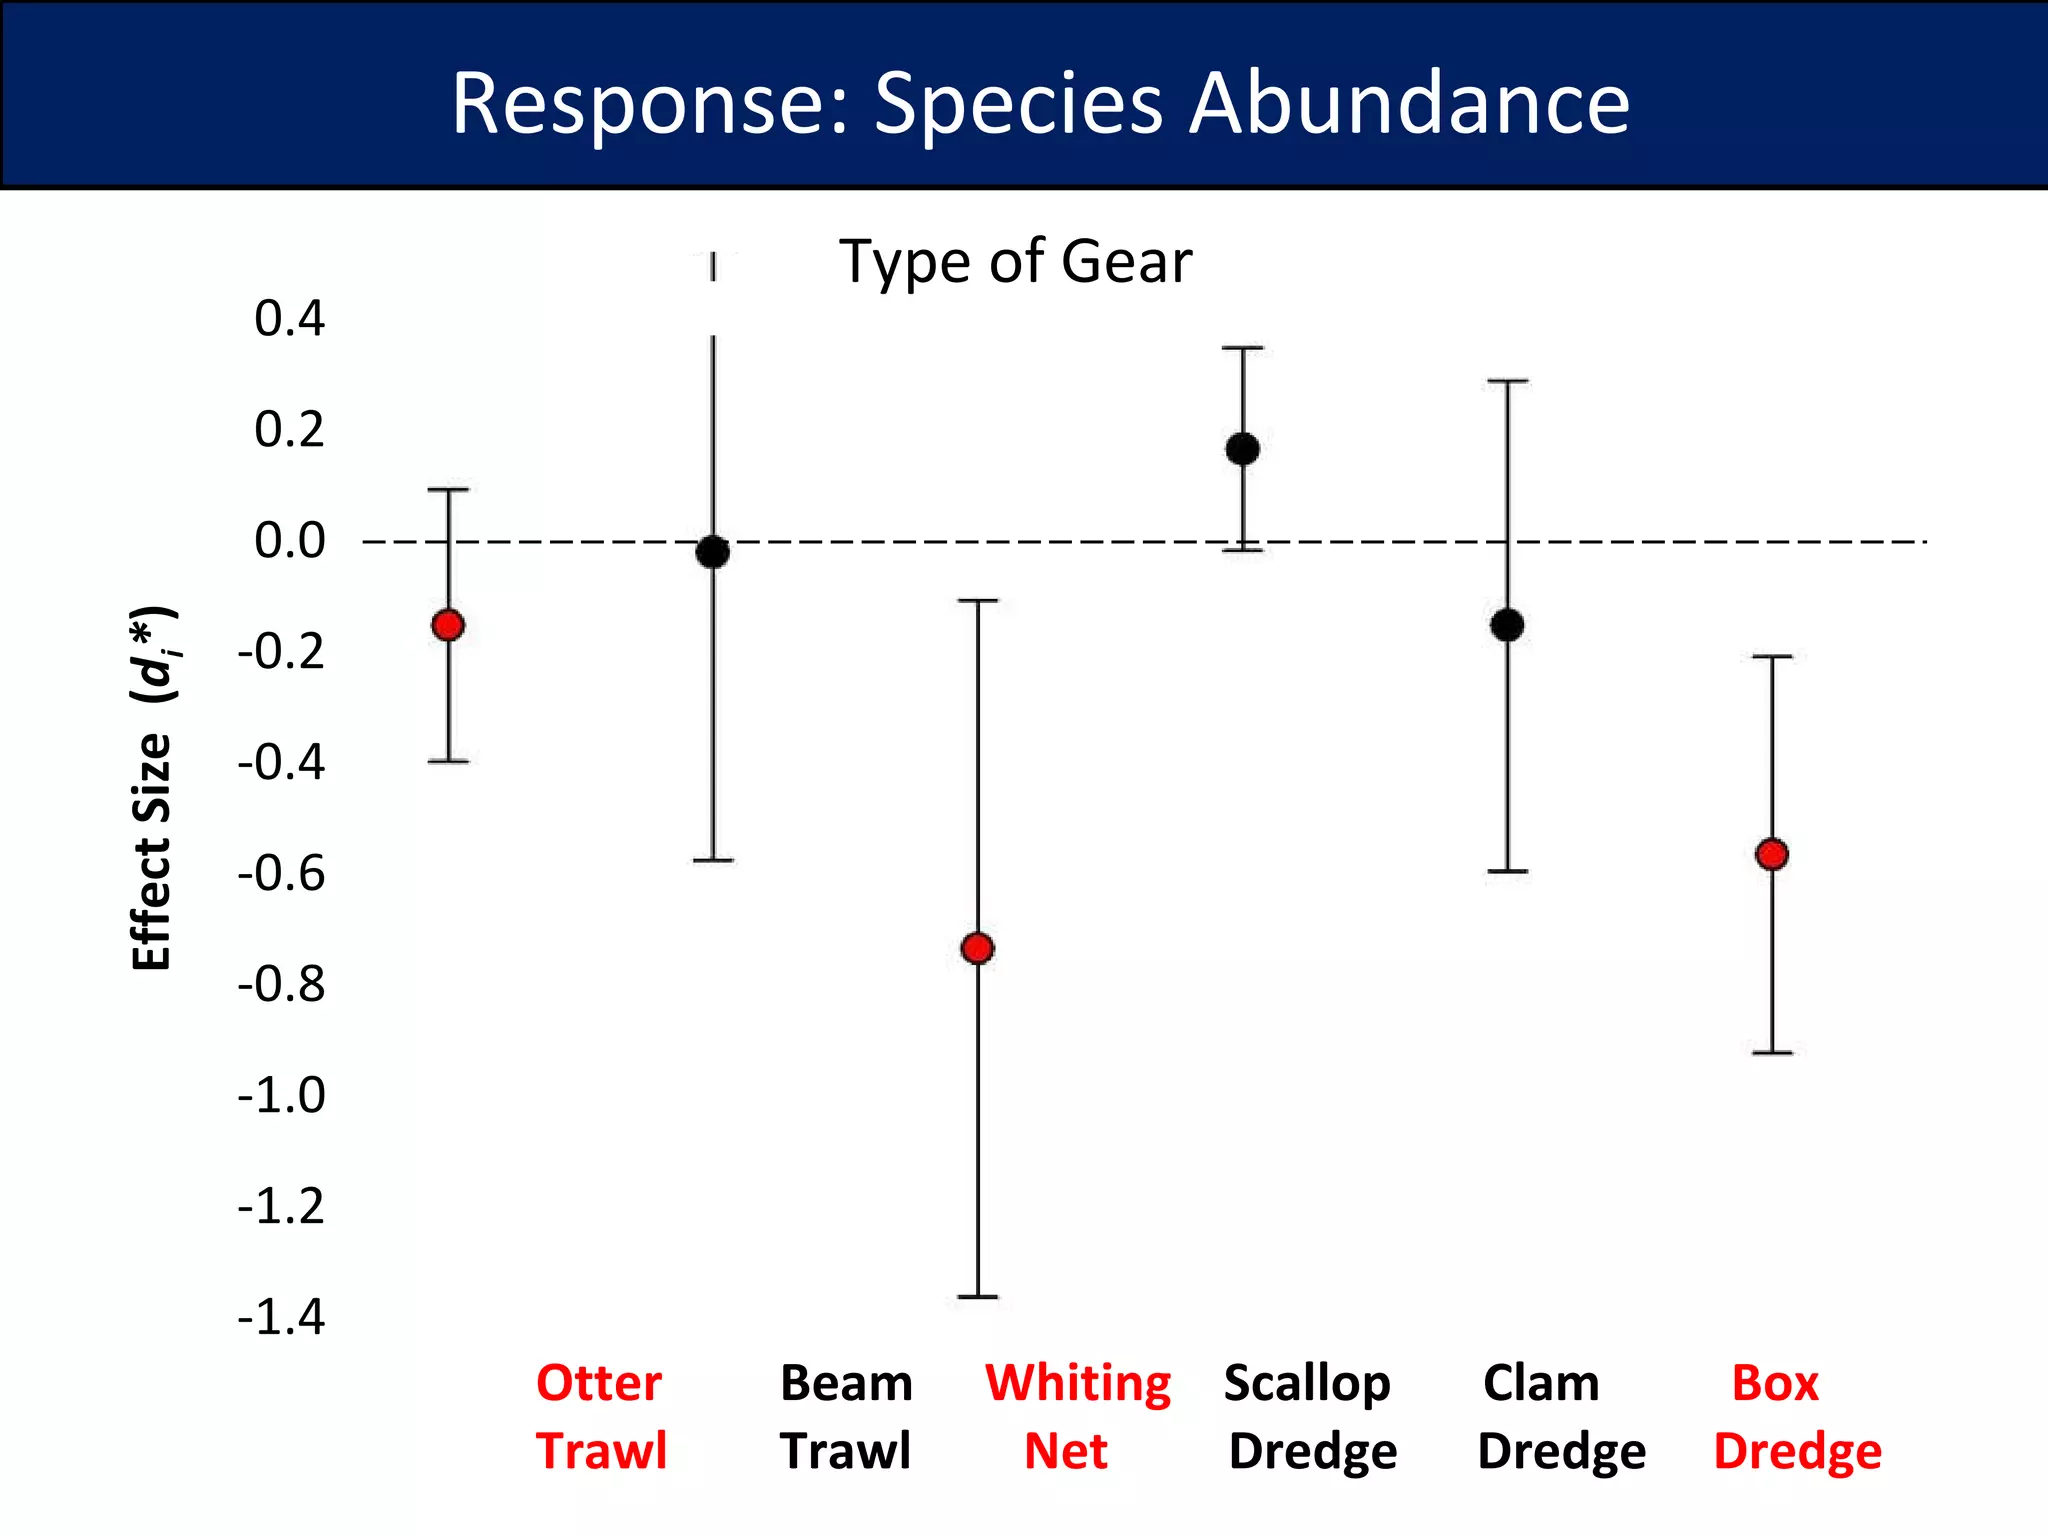
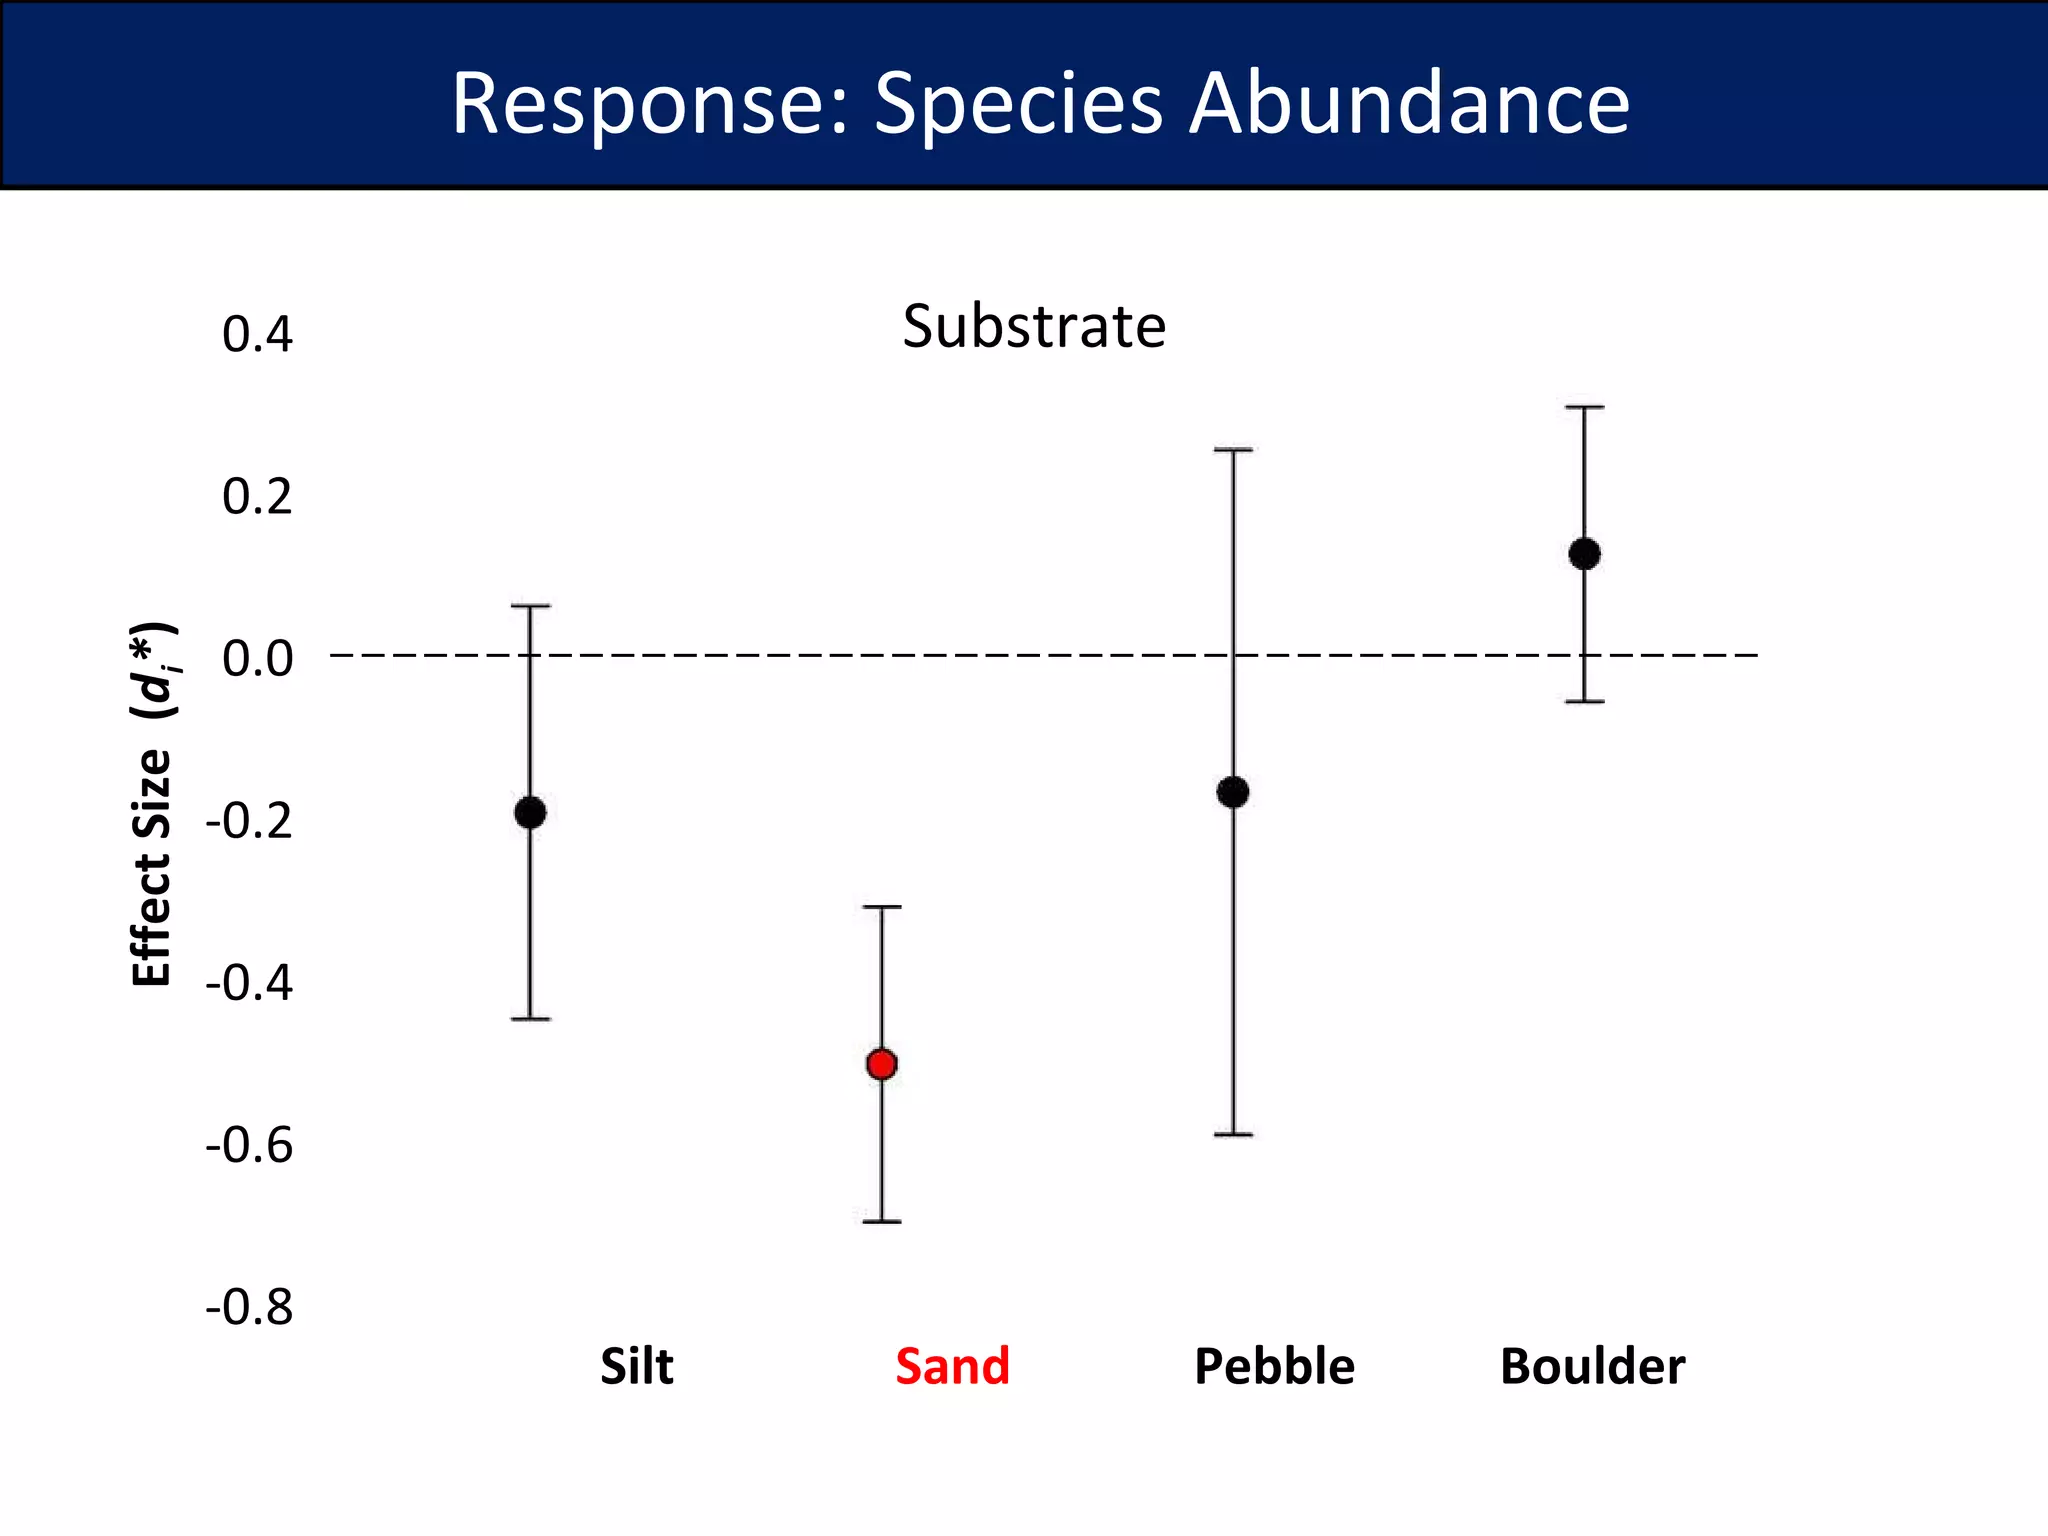
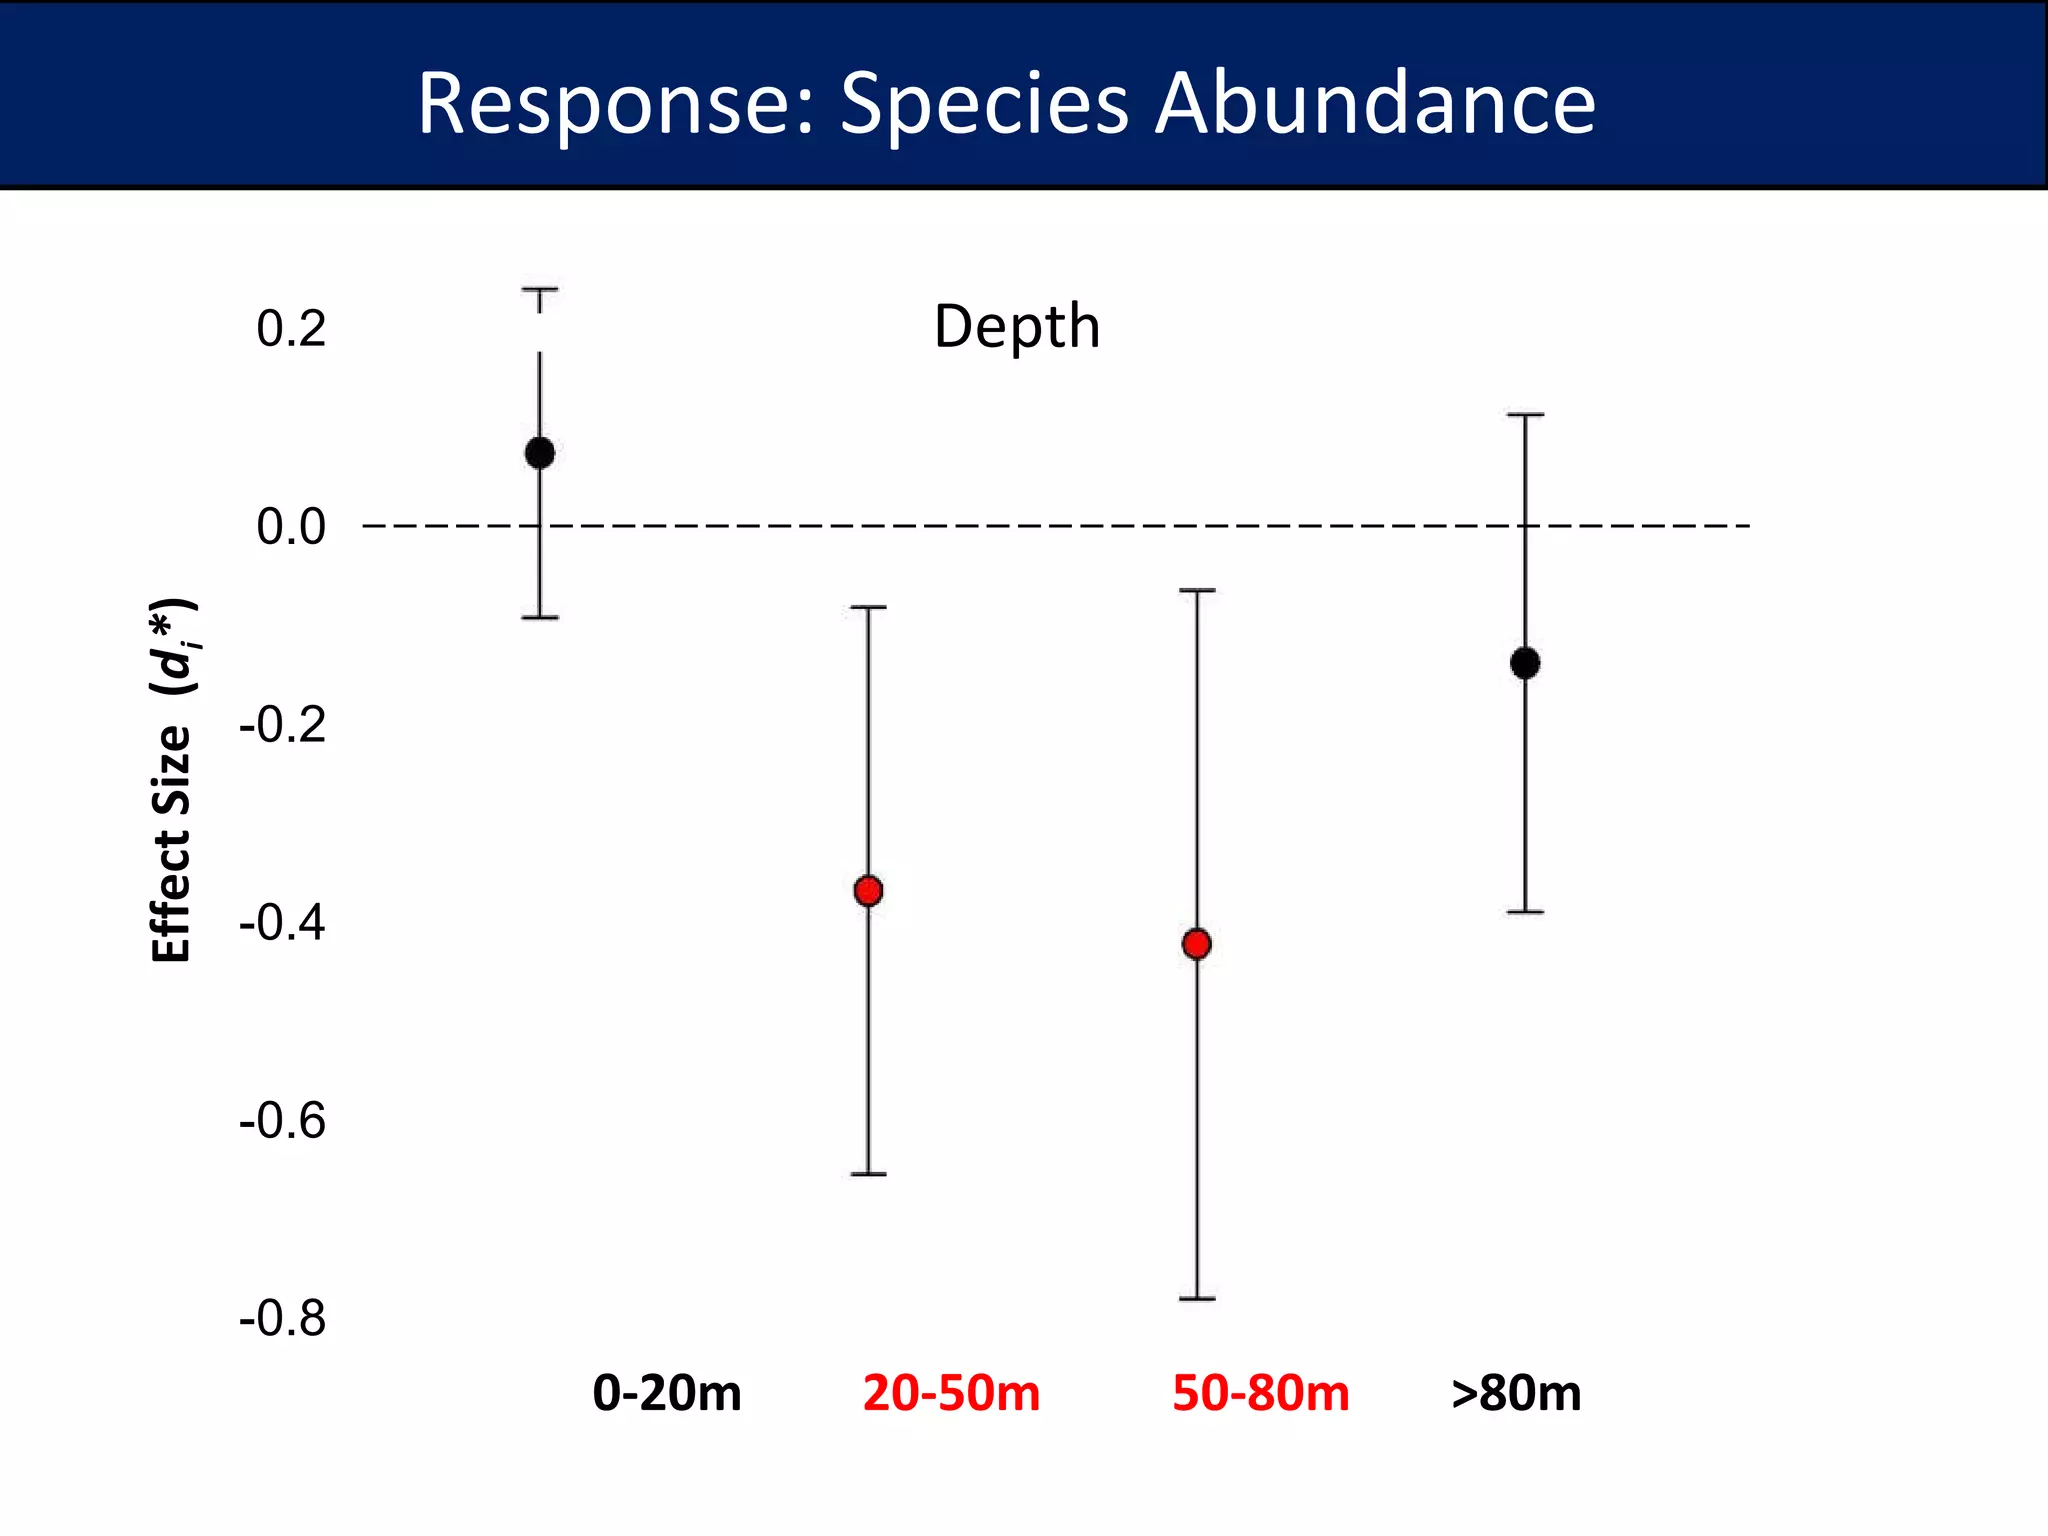
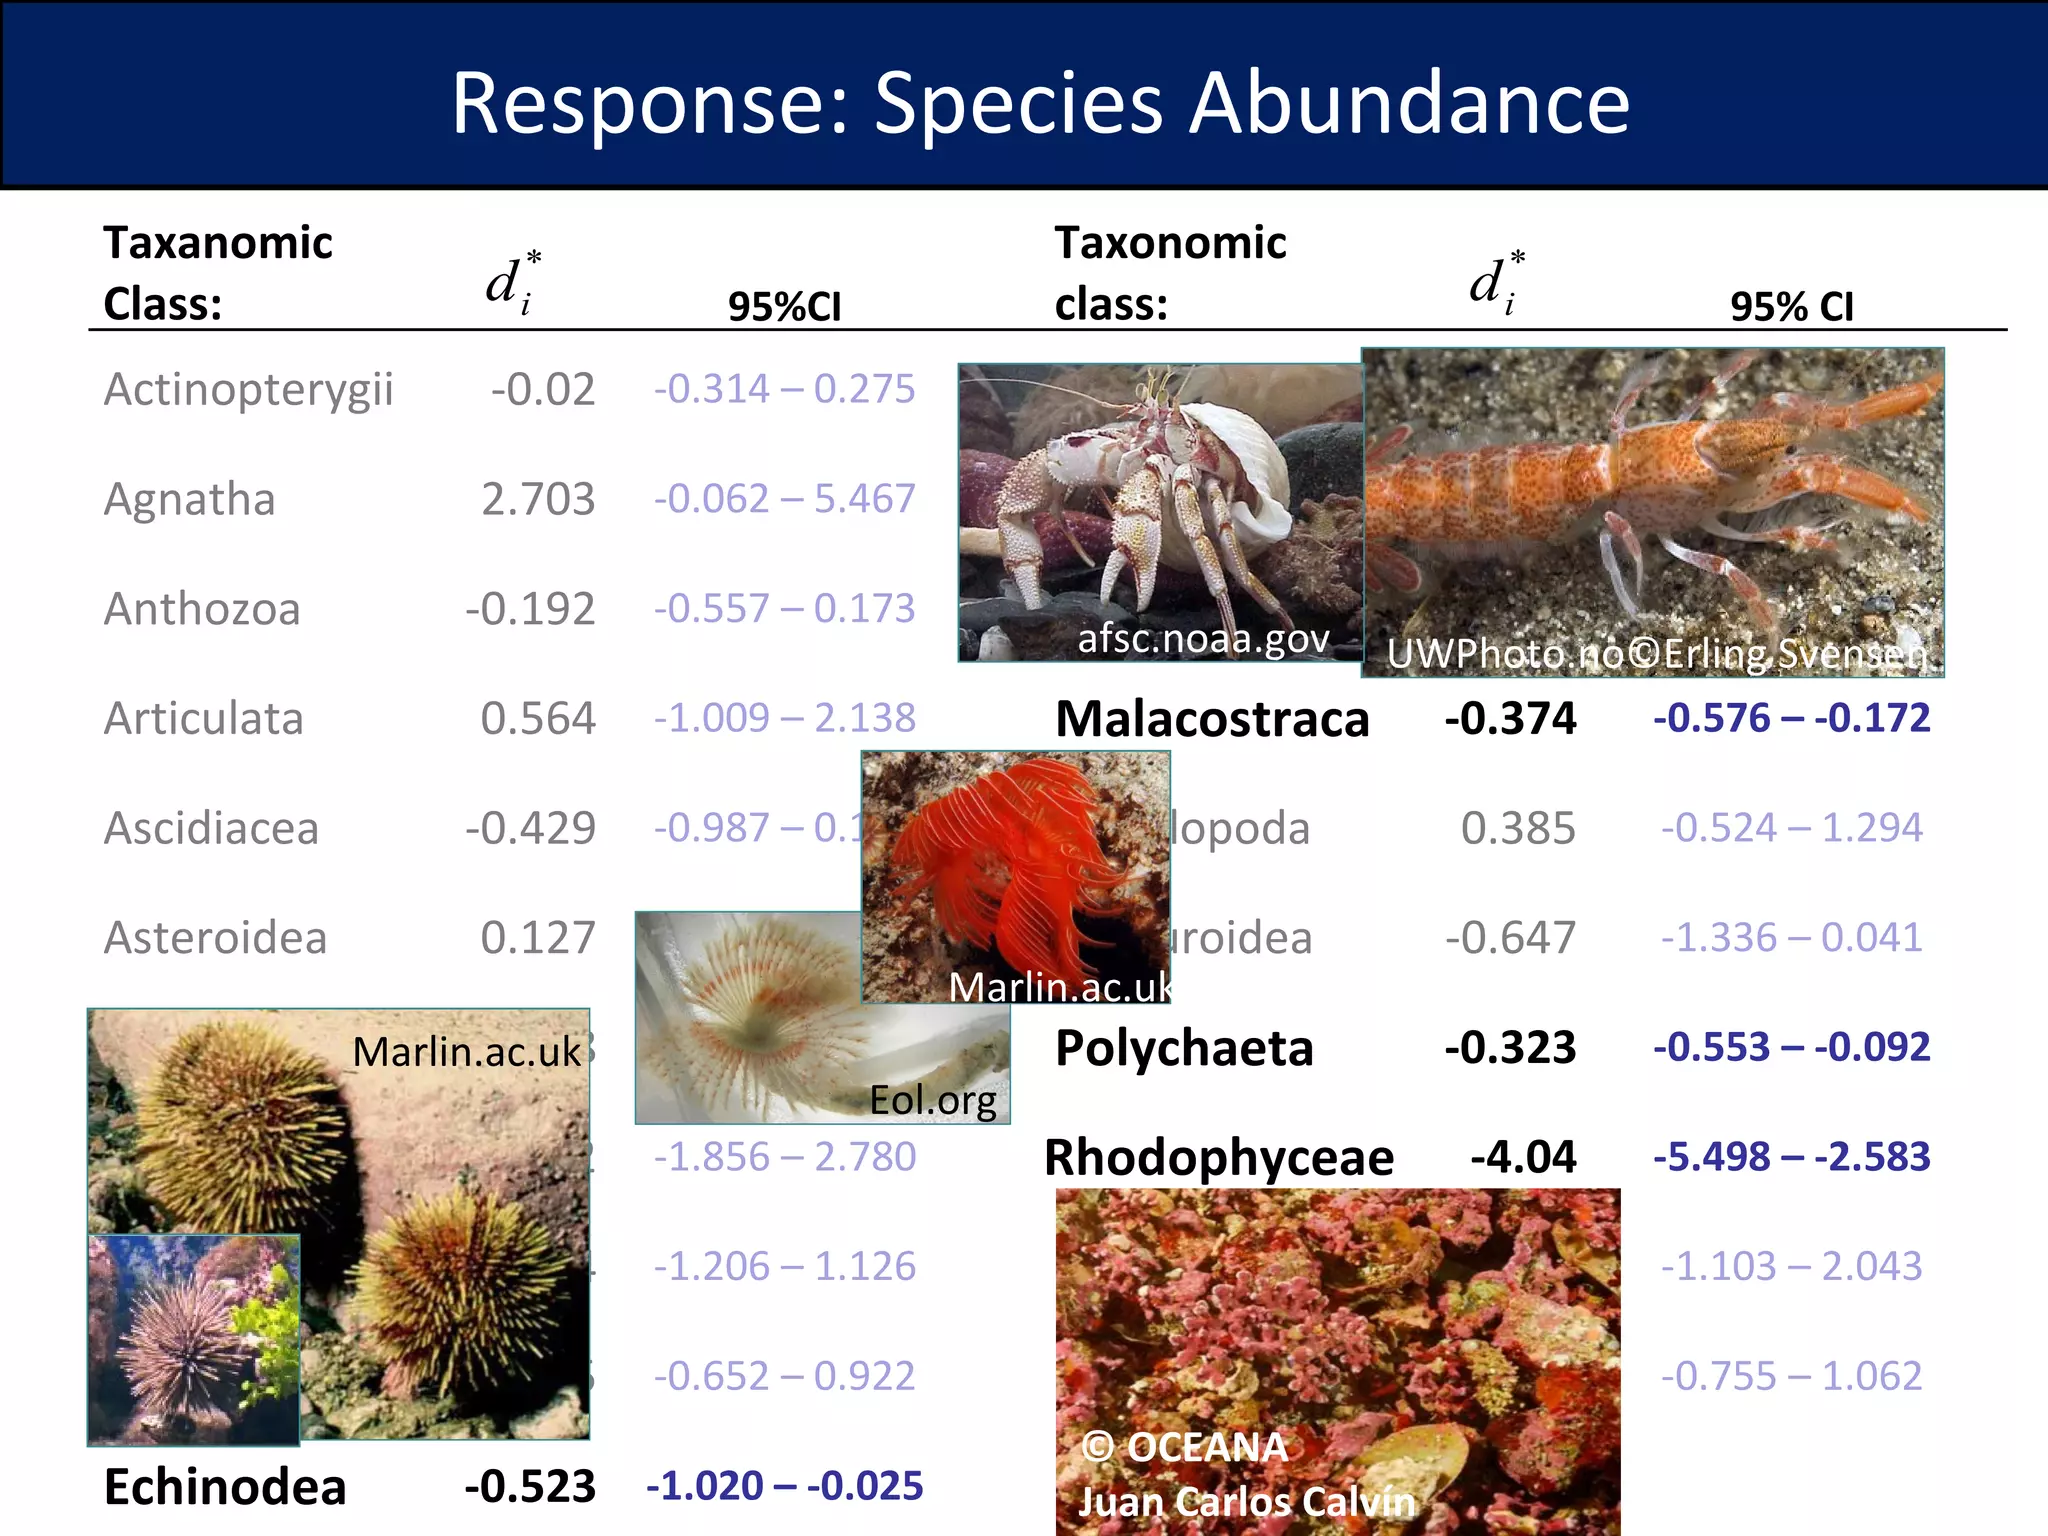
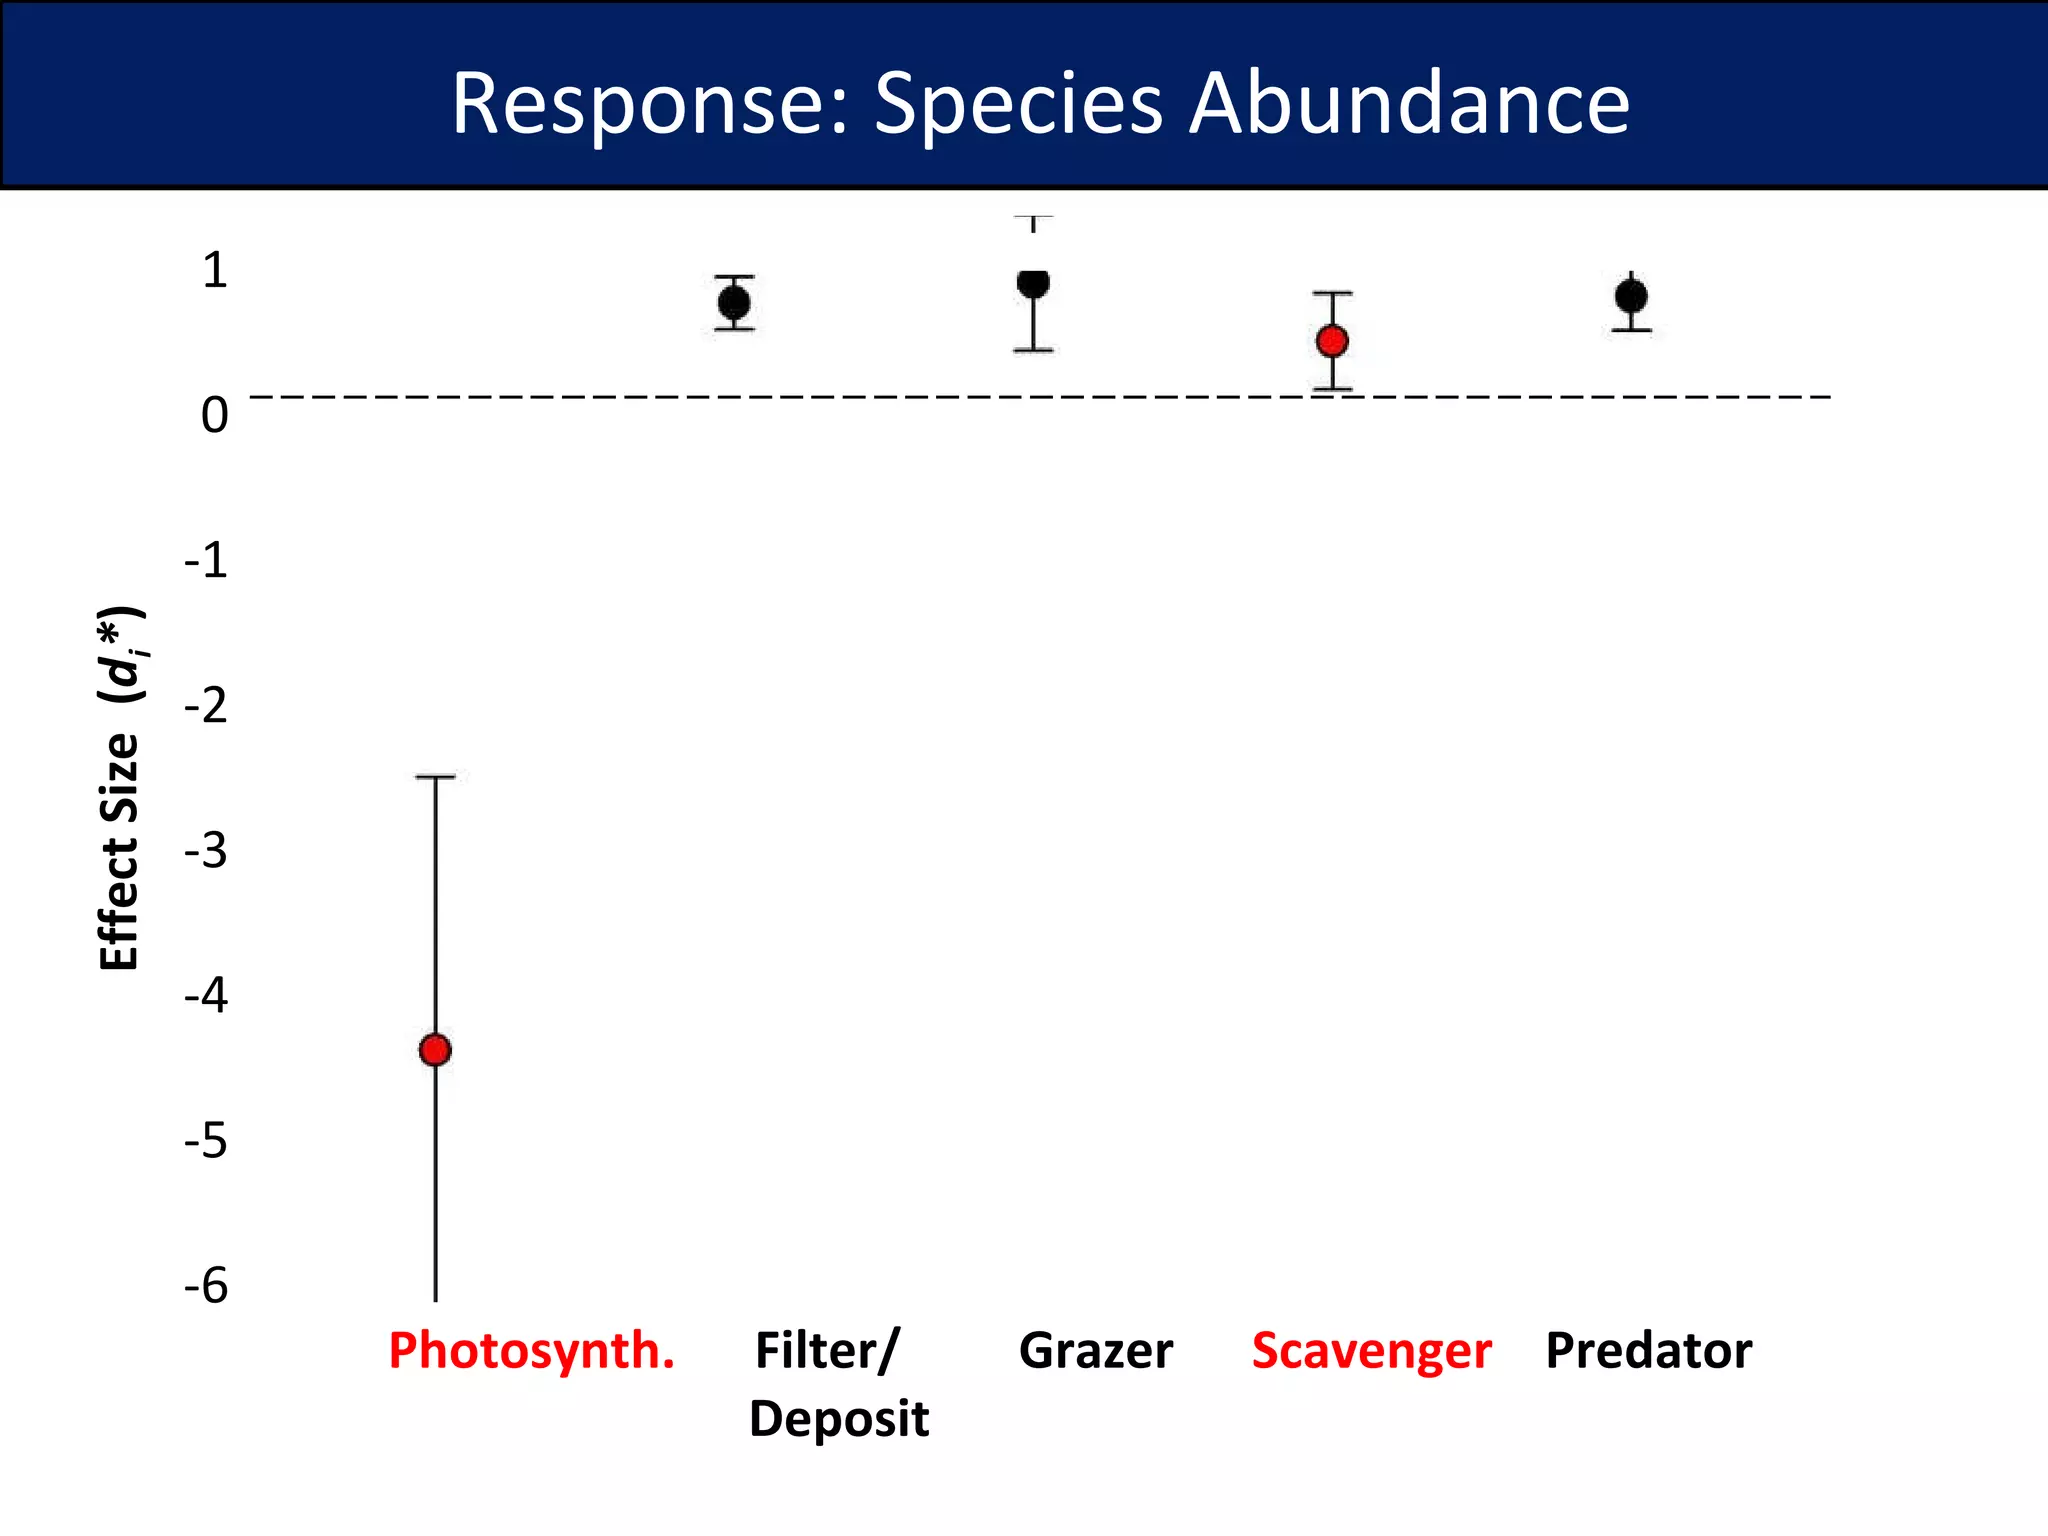
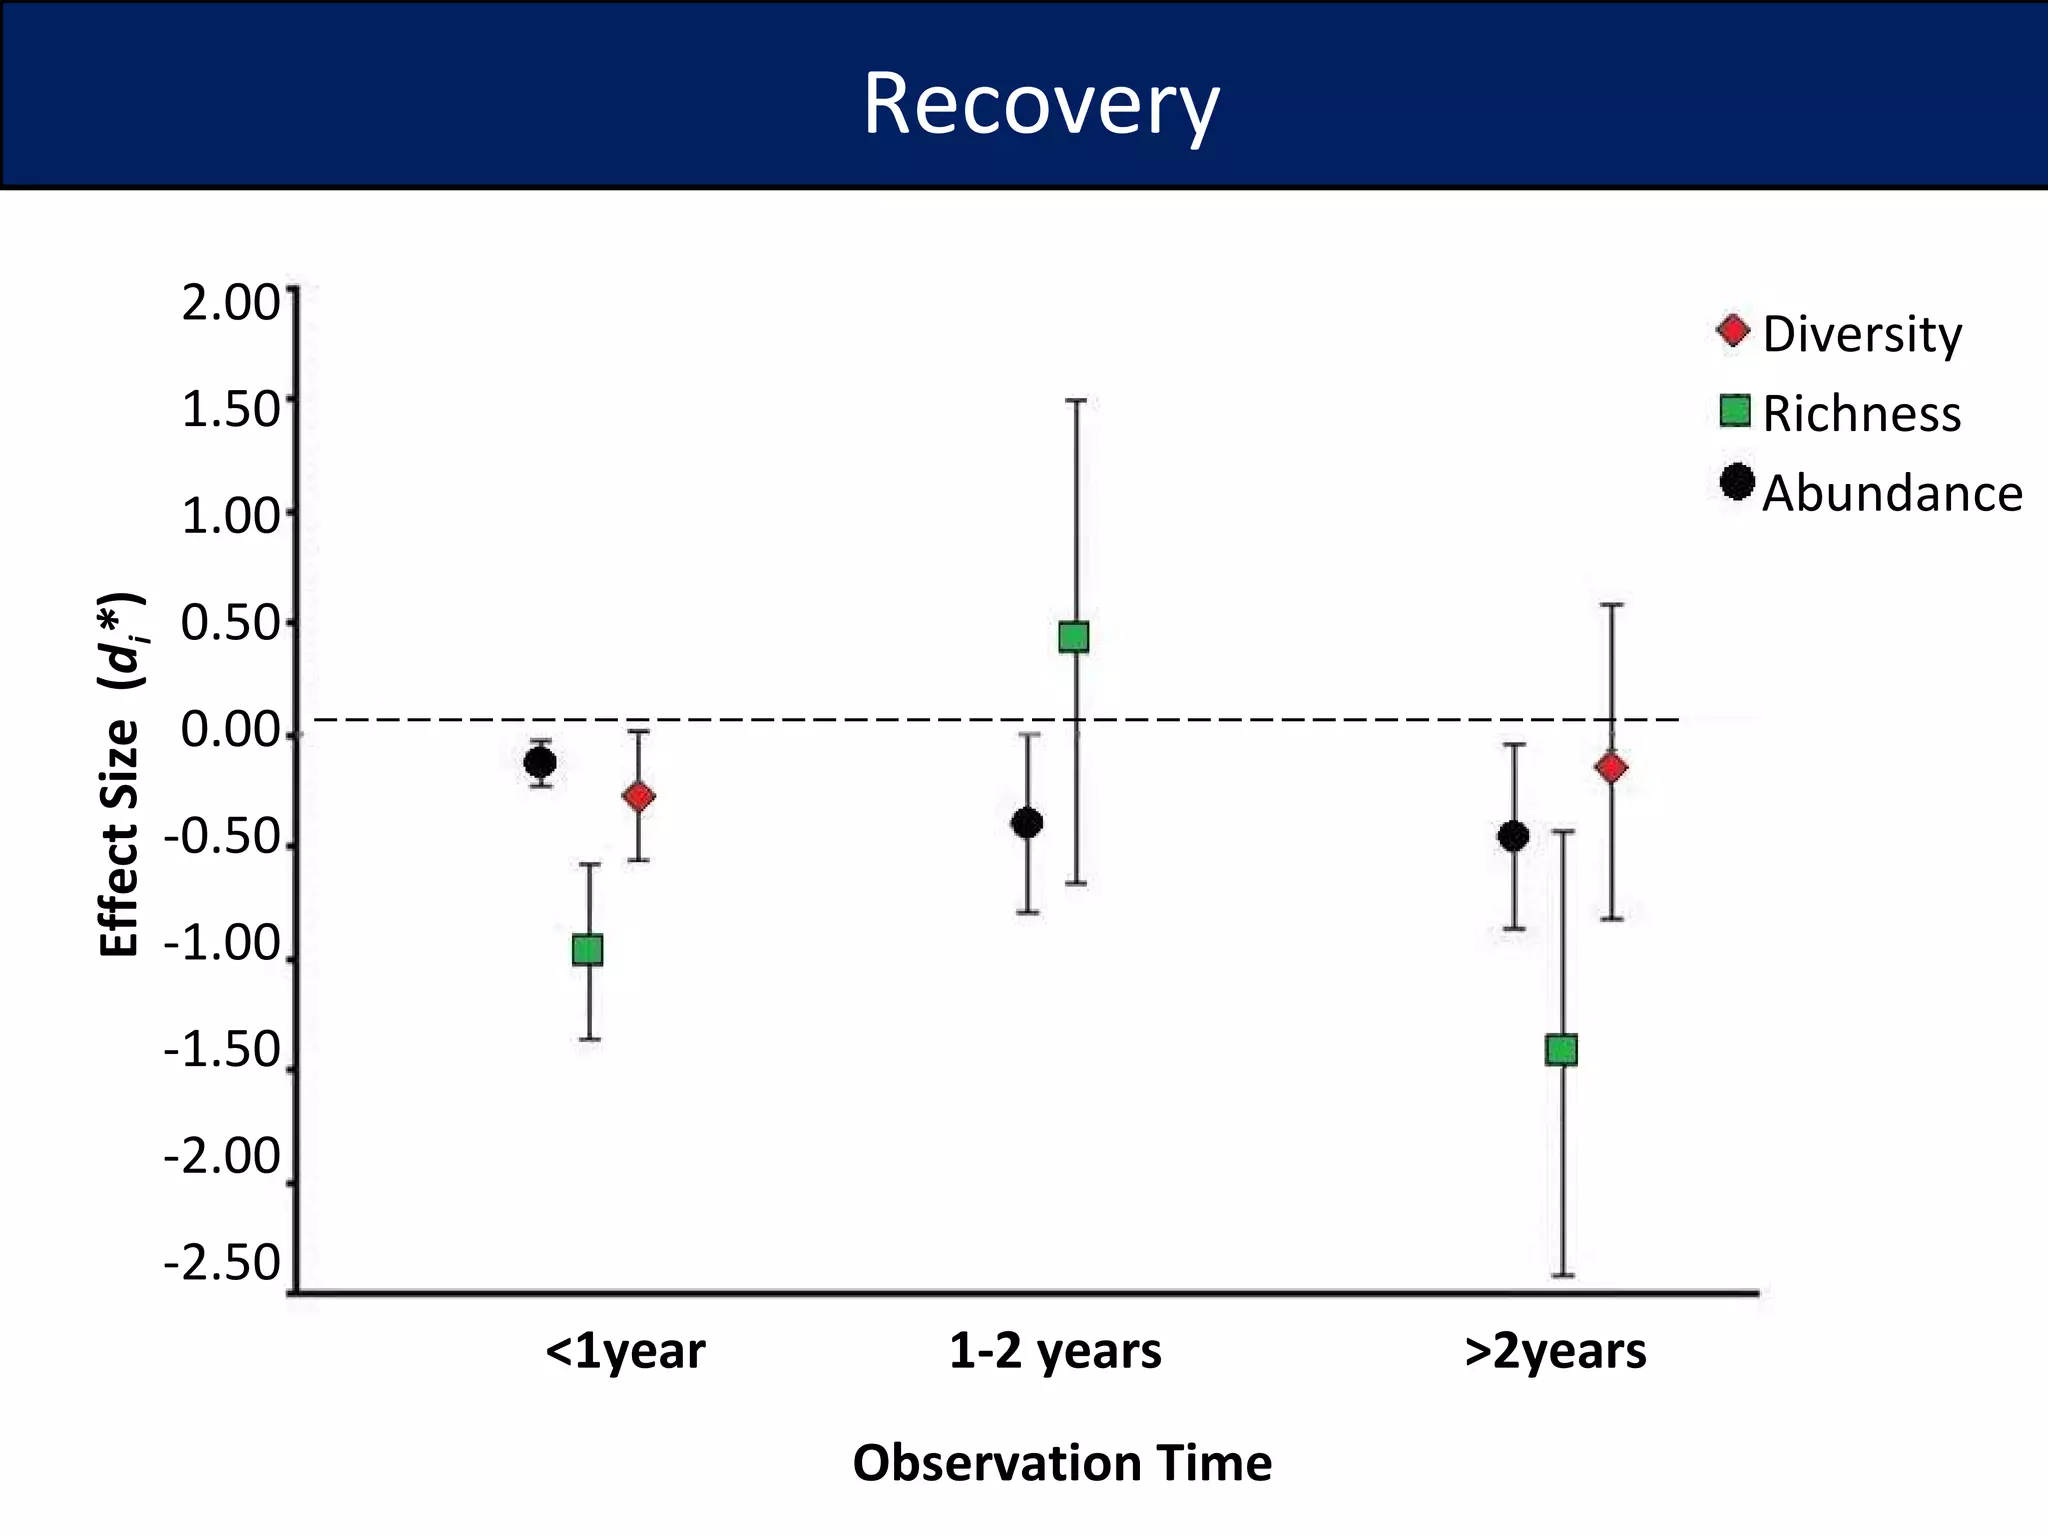
SlideShare a Scribd company logo
Response and recovery potential of temperate benthic marine ecosystems following human disturbance Sciencedaily.com Nationalgeographic.com Sciencedaily.com Erin McClelland Janelle Curtis Chris Wood Devon Warawa  [email_address] Katrina Poppe
Fishing Disturbance Kukenthal Peak, NE Atlantic http://www.whoi.edu  Before trawling After trawling
[object Object],[object Object],[object Object],[object Object],Fishing Disturbance http://www.whoi.edu   (Kukenthal Peak, NE Atlantic) Before trawling After trawling Most widespread anthropogenic disturbance  in marine ecosystems  (Watling & Norse 1998;   Kaiser et al. 2002)
[object Object],[object Object],[object Object],[object Object],[object Object],[object Object],[object Object],[object Object],International Commitments and Technical Advice
Ecosystem Response and Recovery Ecosystem indicator Reference state -5 0 5 10 15 20 Time (years) Disturbance event
Objectives Focus: ,[object Object],[object Object],Temperate and polar  areas Subtidal ecosystems Fishing disturbance
[object Object],[object Object],[object Object],[object Object],[object Object],[object Object],Systematic literature review (1999-2010)
Factors Influencing Response and Recovery Ecosystem Indicators:  Species richness, abundance, and diversity CATEGORY CLASS Duration  Single  Repeated  Gear  Otter trawl  Beam trawl  Whiting net  Scallop dredge  Box dredge  Clam dredge  Depth (m)  <20  20-50  50-80  >80  Substrate  Silt  Sand  Pebble  Boulder  Taxa  21 taxa  Habitat  Infauna  Epifauna  Pelagic  Feeding  Photo.  Filter  Grazers  Scavengers  predators  Mobility  Fixed  Low  Moderate  High  Lifespan (yrs)  <1  2-5 5-10 10-20 >20
Meta-analysis: Mixed-effects model Sum of the weighted effect size for each comparison within a class ,[object Object],silt sand Examine weighted effect size,  d i * d i *  = -0.149  ± 0.215 Apply fail-safe test,  N fs (Publication bias) N fs =664 Test for homogeneity of variance between classes,  boulder pebble d i *  = -0.411  ± 0.163 d i *  = -0.128  ± 0.357 d i *  = 0.120  ± 0.153 Q  = 21.62; p<0.05 There is a  significant negative  response of abundance following fishing in  sandy  habitats Example: Is sediment type important in predicting change in abundance? = - Sum of the variance within a class Sum of the weighted effect size  for each comparison within a class 2
Response: All Comparisons Effect Size  ( d i * ) Diversity  Species    Abundance   Richness 0.2 0.0 -0.2 -0.4 -0.6 -0.8 -1.0 -1.2 -1.4
Response: Species Richness Category/Class Test Statistic Effect Size 95% CI Duration 2.81  single -0.527 -1.075 – 0.020 repeated -1.142 -1.607 – -0.677 Substrate   2.94  silt -0.335 -1.493 – 0.823 sand -0.670 -1.184 – -0.156 pebble -1.270 -1.899 – -0.641 Depth 1.44  0-20m -0.639 -1.207 – -0.071 20-50m -1.127 -1.738 – -0.516 50-80m -1.103 -1.793 – -0.232 >80m -0.699 -3.175 – 1.777 Gear 10.69   otter trawl -0.023 -0.453 – 0.407 beam trawl -1.471 -2.278 – -0.663 whiting net -0.716 -1.889 – 0.457 clam dredge -0.579 -0.879 – -0.279 box dredge -0.461 -0.913 – -0.008
Otter Trawl Beam Trawl Whiting Net Clam Dredge Box Dredge Effect Size  ( d i * ) Response: Species Richness Type of Gear 1.0 0.5 0.0 -0.5 -1.0 -1.5 -2.0 -2.5
Response: Species Abundance Category Duration 0.11 Substrate 21.62 Depth 12.38 Gear 18.65 Taxa: class 67.63 Position 1.27 Feeding 31.19 Mobility 0.649 Life-span 5.58
Response: Species Abundance Effect Size  ( d i * ) Otter   Beam    Whiting   Scallop  Clam  Box   Trawl   Trawl   Net   Dredge  Dredge  Dredge Type of Gear 0.4 0.2 0.0 -0.2 -0.4 -0.6 -0.8 -1.0 -1.2 -1.4
Response: Species Abundance Silt  Sand  Pebble  Boulder Substrate Effect Size  ( d i * ) 0.4 0.2 0.0 -0.2 -0.4 -0.6 -0.8
Response: Species Abundance Effect Size  ( d i * ) 0-20m   20-50m  50-80m   >80m Depth 0.2 0.0 -0.2 -0.4 -0.6 -0.8
Marlin.ac.uk UWPhoto.no©Erling Svensen afsc.noaa.gov Eol.org Marlin.ac.uk © OCEANA  Juan Carlos Calvín Response: Species Abundance Taxanomic Class: 95%CI Taxonomic class: 95% CI Actinopterygii -0.02 -0.314 – 0.275 Gastropoda 0.602 0.164 – 1.039 Agnatha 2.703 -0.062 – 5.467 Holothuroidea 0.38 -0.075 – 0.835 Anthozoa -0.192 -0.557 – 0.173 Hydrozoa 0.251 -0.387 – 0.888 Articulata 0.564 -1.009 – 2.138 Malacostraca -0.374 -0.576 – -0.172 Ascidiacea -0.429 -0.987 – 0.129 Maxillopoda 0.385 -0.524 – 1.294 Asteroidea 0.127 -0.342 – 0.596 Ophiuroidea -0.647 -1.336 – 0.041 Bivalvia -0.128 -0.384 – 0.128 Polychaeta -0.323 -0.553 – -0.092 Cephalopoda 0.462 -1.856 – 2.780 Rhodophyceae -4.04 -5.498 – -2.583 Chondricthyes -0.04 -1.206 – 1.126 Staurozoa 0.47 -1.103 – 2.043 Demospongiae 0.135 -0.652 – 0.922 Stelleroidea 0.153 -0.755 – 1.062 Echinodea -0.523 -1.020 – -0.025
Response: Species Abundance Effect Size  ( d i * ) Photosynth.  Filter/  Grazer  Scavenger   Predator   Deposit 1 0 -1 -2 -3 -4 -5 -6
Recovery <1year 1-2 years >2years Observation Time Diversity Richness Abundance 2.00 1.50 1.00 0.50 0.00 -0.50 -1.00 -1.50 -2.00 -2.50 Effect Size  ( d i * )
[object Object],[object Object],[object Object],[object Object],Concluding Remarks
Collaborators: Erin McClelland  Janelle Curtis Chris Wood Katrina Poppe  Acknowledgements Special thanks to: Jim Boutillier Michael Kaiser Jon Schnute Buzz Holling Funding:  International Governance Strategy Sciencedaily.com Nationalgeographic.com Sciencedaily.com
[object Object],[object Object],[object Object],[object Object],[object Object],[object Object],[object Object],[object Object],Fail-safe #  = # comparisons  Sum of the reciprocal of the variances for each comparison sum of squares of the weighted effect size divided by the critical value of a t-test with significance level 0.05 Publication Bias: Fail-Safe Number
[object Object],[object Object],[object Object],[object Object],[object Object]

More Related Content

Similar to Response and Recovery Potential of Benthic Marine Ecosystems

Women farmers’ participation in the agricultural research process: Implicatio...
Women farmers’ participation in the agricultural research process: Implicatio...Women farmers’ participation in the agricultural research process: Implicatio...
Women farmers’ participation in the agricultural research process: Implicatio...
ILRI
 
An Ecosystems Approach to Water and Food Security
An Ecosystems Approach to Water and Food SecurityAn Ecosystems Approach to Water and Food Security
An Ecosystems Approach to Water and Food Security
AFRIKASOURCES
 
Landslide Risk Reduction Plan for Pashupati Monument Zone (Kathmandu Valley ...
Landslide Risk Reduction Plan for Pashupati Monument Zone  (Kathmandu Valley ...Landslide Risk Reduction Plan for Pashupati Monument Zone  (Kathmandu Valley ...
Landslide Risk Reduction Plan for Pashupati Monument Zone (Kathmandu Valley ...
Akrur Mahat
 
Ecological Statistics
Ecological StatisticsEcological Statistics
Ecological Statistics
Gururaja KV
 
Optimising the ripening period of Slow Sand filter
Optimising the ripening period of Slow Sand filter  Optimising the ripening period of Slow Sand filter
Optimising the ripening period of Slow Sand filter
Hemant Arora
 
Sustainable agriculture under climate change in the Aral Sea Basin. Maryse Bo...
Sustainable agriculture under climate change in the Aral Sea Basin. Maryse Bo...Sustainable agriculture under climate change in the Aral Sea Basin. Maryse Bo...
Sustainable agriculture under climate change in the Aral Sea Basin. Maryse Bo...
Joanna Hicks
 
Effect of Temperature on Stream Fish Energetics and Tolerance to Increasing U...
Effect of Temperature on Stream Fish Energetics and Tolerance to Increasing U...Effect of Temperature on Stream Fish Energetics and Tolerance to Increasing U...
Effect of Temperature on Stream Fish Energetics and Tolerance to Increasing U...
Marylou Moore
 
SmithOSM20160226
SmithOSM20160226SmithOSM20160226
SmithOSM20160226
S. Lan Smith
 
Climate-Smart Conservation: Putting Adaptation Principles into Practice
Climate-Smart Conservation: Putting Adaptation Principles into PracticeClimate-Smart Conservation: Putting Adaptation Principles into Practice
Climate-Smart Conservation: Putting Adaptation Principles into Practice
National Wildlife Federation
 
Interdisciplinary Science Biosphere Student Document
Interdisciplinary Science Biosphere Student DocumentInterdisciplinary Science Biosphere Student Document
Interdisciplinary Science Biosphere Student Document
Skills for Scientists
 
Phenotypic and genetic dissection of water stress adaptations in pearl millet...
Phenotypic and genetic dissection of water stress adaptations in pearl millet...Phenotypic and genetic dissection of water stress adaptations in pearl millet...
Phenotypic and genetic dissection of water stress adaptations in pearl millet...
ICRISAT
 
Distribution, Diet, and Age(Final)2
Distribution, Diet, and Age(Final)2Distribution, Diet, and Age(Final)2
Distribution, Diet, and Age(Final)2
Michelle Warren
 
Development of marker-assisted selection (MAS) technology in crop improvement...
Development of marker-assisted selection (MAS) technology in crop improvement...Development of marker-assisted selection (MAS) technology in crop improvement...
Development of marker-assisted selection (MAS) technology in crop improvement...
International Institute of Tropical Agriculture
 
ICES ASC Plenary lecture "Integrated science for integrated management: fair...
ICES ASC Plenary lecture "Integrated science for integrated management:  fair...ICES ASC Plenary lecture "Integrated science for integrated management:  fair...
ICES ASC Plenary lecture "Integrated science for integrated management: fair...
ICES - International Council for the Exploration of the Sea
 
Jayne Brim-Box et al: 'Monitoring the impact of feral camels on water places ...
Jayne Brim-Box et al: 'Monitoring the impact of feral camels on water places ...Jayne Brim-Box et al: 'Monitoring the impact of feral camels on water places ...
Jayne Brim-Box et al: 'Monitoring the impact of feral camels on water places ...
Ninti_One
 
Romer session presentation
Romer session presentationRomer session presentation
Romer session presentation
Jonathan Tennant
 
Silage Runoff Characterization
Silage Runoff CharacterizationSilage Runoff Characterization
Silage Runoff Characterization
LPE Learning Center
 
Drivers for change in fish community structure
Drivers for change in fish community structureDrivers for change in fish community structure
Drivers for change in fish community structure
Leo Nagelkerke
 
Ci primates in-peril-25-most-endangered-primates_2012-2014
Ci primates in-peril-25-most-endangered-primates_2012-2014Ci primates in-peril-25-most-endangered-primates_2012-2014
Ci primates in-peril-25-most-endangered-primates_2012-2014
Projeto Golfinho Rotador
 
Presentation lecture w3_2015_v2
Presentation lecture w3_2015_v2Presentation lecture w3_2015_v2
Presentation lecture w3_2015_v2
Robert Williamson
 

Similar to Response and Recovery Potential of Benthic Marine Ecosystems (20)

Women farmers’ participation in the agricultural research process: Implicatio...
Women farmers’ participation in the agricultural research process: Implicatio...Women farmers’ participation in the agricultural research process: Implicatio...
Women farmers’ participation in the agricultural research process: Implicatio...
 
An Ecosystems Approach to Water and Food Security
An Ecosystems Approach to Water and Food SecurityAn Ecosystems Approach to Water and Food Security
An Ecosystems Approach to Water and Food Security
 
Landslide Risk Reduction Plan for Pashupati Monument Zone (Kathmandu Valley ...
Landslide Risk Reduction Plan for Pashupati Monument Zone  (Kathmandu Valley ...Landslide Risk Reduction Plan for Pashupati Monument Zone  (Kathmandu Valley ...
Landslide Risk Reduction Plan for Pashupati Monument Zone (Kathmandu Valley ...
 
Ecological Statistics
Ecological StatisticsEcological Statistics
Ecological Statistics
 
Optimising the ripening period of Slow Sand filter
Optimising the ripening period of Slow Sand filter  Optimising the ripening period of Slow Sand filter
Optimising the ripening period of Slow Sand filter
 
Sustainable agriculture under climate change in the Aral Sea Basin. Maryse Bo...
Sustainable agriculture under climate change in the Aral Sea Basin. Maryse Bo...Sustainable agriculture under climate change in the Aral Sea Basin. Maryse Bo...
Sustainable agriculture under climate change in the Aral Sea Basin. Maryse Bo...
 
Effect of Temperature on Stream Fish Energetics and Tolerance to Increasing U...
Effect of Temperature on Stream Fish Energetics and Tolerance to Increasing U...Effect of Temperature on Stream Fish Energetics and Tolerance to Increasing U...
Effect of Temperature on Stream Fish Energetics and Tolerance to Increasing U...
 
SmithOSM20160226
SmithOSM20160226SmithOSM20160226
SmithOSM20160226
 
Climate-Smart Conservation: Putting Adaptation Principles into Practice
Climate-Smart Conservation: Putting Adaptation Principles into PracticeClimate-Smart Conservation: Putting Adaptation Principles into Practice
Climate-Smart Conservation: Putting Adaptation Principles into Practice
 
Interdisciplinary Science Biosphere Student Document
Interdisciplinary Science Biosphere Student DocumentInterdisciplinary Science Biosphere Student Document
Interdisciplinary Science Biosphere Student Document
 
Phenotypic and genetic dissection of water stress adaptations in pearl millet...
Phenotypic and genetic dissection of water stress adaptations in pearl millet...Phenotypic and genetic dissection of water stress adaptations in pearl millet...
Phenotypic and genetic dissection of water stress adaptations in pearl millet...
 
Distribution, Diet, and Age(Final)2
Distribution, Diet, and Age(Final)2Distribution, Diet, and Age(Final)2
Distribution, Diet, and Age(Final)2
 
Development of marker-assisted selection (MAS) technology in crop improvement...
Development of marker-assisted selection (MAS) technology in crop improvement...Development of marker-assisted selection (MAS) technology in crop improvement...
Development of marker-assisted selection (MAS) technology in crop improvement...
 
ICES ASC Plenary lecture "Integrated science for integrated management: fair...
ICES ASC Plenary lecture "Integrated science for integrated management:  fair...ICES ASC Plenary lecture "Integrated science for integrated management:  fair...
ICES ASC Plenary lecture "Integrated science for integrated management: fair...
 
Jayne Brim-Box et al: 'Monitoring the impact of feral camels on water places ...
Jayne Brim-Box et al: 'Monitoring the impact of feral camels on water places ...Jayne Brim-Box et al: 'Monitoring the impact of feral camels on water places ...
Jayne Brim-Box et al: 'Monitoring the impact of feral camels on water places ...
 
Romer session presentation
Romer session presentationRomer session presentation
Romer session presentation
 
Silage Runoff Characterization
Silage Runoff CharacterizationSilage Runoff Characterization
Silage Runoff Characterization
 
Drivers for change in fish community structure
Drivers for change in fish community structureDrivers for change in fish community structure
Drivers for change in fish community structure
 
Ci primates in-peril-25-most-endangered-primates_2012-2014
Ci primates in-peril-25-most-endangered-primates_2012-2014Ci primates in-peril-25-most-endangered-primates_2012-2014
Ci primates in-peril-25-most-endangered-primates_2012-2014
 
Presentation lecture w3_2015_v2
Presentation lecture w3_2015_v2Presentation lecture w3_2015_v2
Presentation lecture w3_2015_v2
 

Response and Recovery Potential of Benthic Marine Ecosystems

  • 1. Response and recovery potential of temperate benthic marine ecosystems following human disturbance Sciencedaily.com Nationalgeographic.com Sciencedaily.com Erin McClelland Janelle Curtis Chris Wood Devon Warawa [email_address] Katrina Poppe
  • 2. Fishing Disturbance Kukenthal Peak, NE Atlantic http://www.whoi.edu Before trawling After trawling
  • 3.
  • 4.
  • 5. Ecosystem Response and Recovery Ecosystem indicator Reference state -5 0 5 10 15 20 Time (years) Disturbance event
  • 6.
  • 7.
  • 8. Factors Influencing Response and Recovery Ecosystem Indicators: Species richness, abundance, and diversity CATEGORY CLASS Duration Single Repeated Gear Otter trawl Beam trawl Whiting net Scallop dredge Box dredge Clam dredge Depth (m) <20 20-50 50-80 >80 Substrate Silt Sand Pebble Boulder Taxa 21 taxa Habitat Infauna Epifauna Pelagic Feeding Photo. Filter Grazers Scavengers predators Mobility Fixed Low Moderate High Lifespan (yrs) <1 2-5 5-10 10-20 >20
  • 9.
  • 10. Response: All Comparisons Effect Size ( d i * ) Diversity Species Abundance Richness 0.2 0.0 -0.2 -0.4 -0.6 -0.8 -1.0 -1.2 -1.4
  • 11. Response: Species Richness Category/Class Test Statistic Effect Size 95% CI Duration 2.81 single -0.527 -1.075 – 0.020 repeated -1.142 -1.607 – -0.677 Substrate 2.94 silt -0.335 -1.493 – 0.823 sand -0.670 -1.184 – -0.156 pebble -1.270 -1.899 – -0.641 Depth 1.44 0-20m -0.639 -1.207 – -0.071 20-50m -1.127 -1.738 – -0.516 50-80m -1.103 -1.793 – -0.232 >80m -0.699 -3.175 – 1.777 Gear 10.69 otter trawl -0.023 -0.453 – 0.407 beam trawl -1.471 -2.278 – -0.663 whiting net -0.716 -1.889 – 0.457 clam dredge -0.579 -0.879 – -0.279 box dredge -0.461 -0.913 – -0.008
  • 12. Otter Trawl Beam Trawl Whiting Net Clam Dredge Box Dredge Effect Size ( d i * ) Response: Species Richness Type of Gear 1.0 0.5 0.0 -0.5 -1.0 -1.5 -2.0 -2.5
  • 13. Response: Species Abundance Category Duration 0.11 Substrate 21.62 Depth 12.38 Gear 18.65 Taxa: class 67.63 Position 1.27 Feeding 31.19 Mobility 0.649 Life-span 5.58
  • 14. Response: Species Abundance Effect Size ( d i * ) Otter Beam Whiting Scallop Clam Box Trawl Trawl Net Dredge Dredge Dredge Type of Gear 0.4 0.2 0.0 -0.2 -0.4 -0.6 -0.8 -1.0 -1.2 -1.4
  • 15. Response: Species Abundance Silt Sand Pebble Boulder Substrate Effect Size ( d i * ) 0.4 0.2 0.0 -0.2 -0.4 -0.6 -0.8
  • 16. Response: Species Abundance Effect Size ( d i * ) 0-20m 20-50m 50-80m >80m Depth 0.2 0.0 -0.2 -0.4 -0.6 -0.8
  • 17. Marlin.ac.uk UWPhoto.no©Erling Svensen afsc.noaa.gov Eol.org Marlin.ac.uk © OCEANA Juan Carlos Calvín Response: Species Abundance Taxanomic Class: 95%CI Taxonomic class: 95% CI Actinopterygii -0.02 -0.314 – 0.275 Gastropoda 0.602 0.164 – 1.039 Agnatha 2.703 -0.062 – 5.467 Holothuroidea 0.38 -0.075 – 0.835 Anthozoa -0.192 -0.557 – 0.173 Hydrozoa 0.251 -0.387 – 0.888 Articulata 0.564 -1.009 – 2.138 Malacostraca -0.374 -0.576 – -0.172 Ascidiacea -0.429 -0.987 – 0.129 Maxillopoda 0.385 -0.524 – 1.294 Asteroidea 0.127 -0.342 – 0.596 Ophiuroidea -0.647 -1.336 – 0.041 Bivalvia -0.128 -0.384 – 0.128 Polychaeta -0.323 -0.553 – -0.092 Cephalopoda 0.462 -1.856 – 2.780 Rhodophyceae -4.04 -5.498 – -2.583 Chondricthyes -0.04 -1.206 – 1.126 Staurozoa 0.47 -1.103 – 2.043 Demospongiae 0.135 -0.652 – 0.922 Stelleroidea 0.153 -0.755 – 1.062 Echinodea -0.523 -1.020 – -0.025
  • 18. Response: Species Abundance Effect Size ( d i * ) Photosynth. Filter/ Grazer Scavenger Predator Deposit 1 0 -1 -2 -3 -4 -5 -6
  • 19. Recovery <1year 1-2 years >2years Observation Time Diversity Richness Abundance 2.00 1.50 1.00 0.50 0.00 -0.50 -1.00 -1.50 -2.00 -2.50 Effect Size ( d i * )
  • 20.
  • 21. Collaborators: Erin McClelland Janelle Curtis Chris Wood Katrina Poppe Acknowledgements Special thanks to: Jim Boutillier Michael Kaiser Jon Schnute Buzz Holling Funding: International Governance Strategy Sciencedaily.com Nationalgeographic.com Sciencedaily.com
  • 22.
  • 23.

Editor's Notes

  1. Hello and thank you for coming. I am Devon Warawa, a recent Bachelor of Science graduate from The University of Victoria. This project is a collaboration of myself and research scientists from the Department of Fisheries and Oceans Canada Pacific Biological Station an a fellow student from The University of Victoria. My take home message for this talk is that as an immediate response to fishing disturbance in temperate ecosystems there is an overall decline in species diversity, richness, and, species abundance. More importantly, ecosystem recovery appears to take more than two years time. The exact recovery time is important to determine in order to fulfill our international commitments to protecting vulnerable marine ecosystems.
  2. This photo is taken from the North East Atlantic before and after bottom trawling disturbance. Temperate benthic marine ecosystems such as these can be diverse, productive, and contain many unique species. After trawling you can see that epifauna has been completely removed reducing habitat structure and complexity. Overall abundance is significantly reduced, and sediment composition has changed.
  3. These effects pose an international concern for several reasons: -The resulting indirect and cascading effects, such as changes in species interactions and biochemistry, are still poorly understood. -Other studies show fishing hascontributed to a reduction of global marine productivity and biodiversity. -Finally, the fishing footprint is expanding into previously unexploited ecosystems in deeper waters further offshore as resources are depleted (Watling and norse, 1998?). These ecosystems are typically subject to less frequent natural disturbances making them less resilient and more vulnerable to anthropogenic disturbances (Collie, 2000). Finally, Fishing is one of the most widespread and longterm anthropogenic disturbances to marine ecosystems (Kaiser et al., 2002; Watling and Norse, 1998).
  4. We have an international commitment to protect marine environments from fishing disturbances under several international AGREEMENTS: The United Nations General Assembly Resolution developed six years ago calls on states to identify whether bottom fishing activities cause significant adverse impacts and to protect vulnerable marine ecosystems from them. The Convention on biological diversity calls to identify significant and vulnerable ecosystems and to identify activities which are likely to have significant adverse impacts on them. The Food and Agriculture Organization suggests that significant adverse impacts are those that compromise ecosystem integrity over the long term, where ecosystem recovery takes longer than 20years. They also provide criteria to identify vulnerable marine ecosystems.
  5. Ecosystems may respond and recover to disturbances in different ways depending on a combination of factors such as species life histories, disturbance intensity, and natural disturbance regimes. The dotted line here represents no observed change in the ecosystem indicator, such as species richness, after the disturbance at time zero. You can have a situation where the indicator decreases or increases immediately after disturbance but returns to a pre-disturbed state within 5-10 years. Or the indicator may decline and reach an alternative stable state. In this case recovery is not seen within 20 years indicating a significant adverse impact. Unfortunately information about ecological recovery is often incomplete (Palumbi, 2008), making it hard to determine which activities on which ecosystems leads to undesirable effects.
  6. Our objective was to assess current information about response and recovery to anthropogenic activities on benthic marine ecosystems and to identify specific factors that affect recovery time such as physical habitat types, species life history characteristics, and disturbance intensity. We focused on: -fishing disturbances to address the international commitments discussed. -Temperate and polar areas, as most other reviews have focused on tropical fishing disturbances and it is thought that temperate ecosystem may more sensitive and slower to recover from disturbance. -And subtidal benthic ecosystems as natural disturbance regimes tend to decrease in intensity and frequency further from the coast, making ecosystems less resillient to fishing.
  7. We conducted a systematic literature review to obtain empirical data using repeatable search. We used this key word search in Scopus and Web of Science databases to gather empirical data from the last 10 years relevant to fishing disturbances. The literature available was largely conceptual pieces and comparative empirical studies. Only 5% were other meta-analysis. Only empirical studies provided quantitative datasets suitable for our meta-analysis. In particular we required an empirical measures of species response and means and standard deviations and a temporal or spatial reference comparison. Our initial search produced 674 studies, of which 24 met our criteria.
  8. We used species diversity, richness, and abundance as ecosystem indicators, as these were the most consistently reported indicators across studies. We collected information about the nature and extent of disturbance activity including duration and gear type, physical habitat such as depth and substrate type, and life histories of organisms including taxonomic groups, habitat, feeding, mobility, and lifespan.
  9. What is meta-analysis and what are some advantages?: A meta-analysis have many advantages over both individual studies and classical narrative reviews: -reveal larger scale patterns -using higher statistical power from increases sample sizes and -provide less biased repeatable results. We used a mixed effects model and I’ll run through an example to explain it. What is the effect of sediment type on change in abundance? We test for homogeneity of variance between classes to determine if the response in abundance significantly differs between substrate types. You can see this calculation takes into consideration a weighted effect size for each comparison. In this example the test statistic is significant. So this tells us that ecosystems of different substrate types respond differently, and we can see how they differ by examining the effect sizes. A negative effect size indicates a decrease in abundance following fishing. The 95% confidence interval for sand is the only class that does not overlap zero. Therefore, we can say that there is a significant negative response of abundance following fishing in sandy habitats. Because meta-analysis are subject to publication bias we apply what is called the “fail-safe” test to help determine the likeliness this analysis is influenced by publication bias. In this case our fail safe number is quite large, indicating there we are not prone to publication bias. We would need 664 more studies to change the effect.
  10. Our measure of reponse includes data observed within one year after disturbance. The error bars represent 95% confident intervals of the effect size. You can see that Diversity has a high variability where individually, some studies find strong negative and some positive responses. The confidence interval for diversity overlaps with zero, therefore we can see that overall effect is insignificant. Species richness and abundance show a significant response and we will focus the results on these indicators.
  11. When species richness is broken into categories only the type of gear appears to have a significant effect on species richness according to our test.
  12. Beam trawls, clam dredges, and box dredges in particular caused a significant decrease in species richness, compared to other gear types.
  13. When species abundance is broken into categories we see significant effects associated with substrate, depth, gear, taxanomic class, and feeding strategy.
  14. Of types of gear; Otter trawls (which are the most common type of towed gear), whiting nets and box dredges seem to cause a significant decrease in abundance, compared to other gear types.
  15. A significant decrease in abundance occurs in sandy habitats. -This is consistent with other studies suggesting sandy communities are more delicate and vulnerable to disturbance (Currie and Parry, 1996; Watling and Norse, 1998). -This is an important observation as about 70% of the sea floor is composed of sandy sediments (Thrush and Dayton, 2002).
  16. A significant decrease in abundance is also seen in ecosystems at depths between 20 and 80m. However, we expected deeper ecosystems would be the most negatively effected because they experience less frequent natural disturbances.
  17. Of the 21 classes we tested abundance was significantly reduced in Echinodea (mainly), Malacostraca (such as shrimp and hermit crabs), Polychaeta (such as these tube worms), and Rhodophyceae (red algae). Generally, species that are more exposed to gear, such as epifauna will have a more negative response.
  18. Species that are photosynthesising and scavenger feeding are significantly reduced. -Many other studies note an increase in scavenger in recently trawled areas, so our result was unexpected. (Collie et al., 2000b, de Juan et al., 2007, Tillin et al., 2006; but see Bremner, 2008).
  19. Much less data was available to assess recovery beyond one year post disturbance. Here we show a time series for recovery indicated by species diversity, richness, and abundance. From this data it is clear that there are no signs of recovery up to two year after fishing disturbance. So, if recovery is happening in these ecosystems, it takes longer than 2 years; but how much longer is not known without longer term monitoring.
  20. Gear type: We saw that the type of fishing gear is an important predictor of both species richness and abundance. With this information we can select types of gear that have a lighter impact on ecosystems. Change in abundance could also be predicted by physical habitat and life history characteristics, and we could further reduce adverse effects by avoiding these ecosystems. Recovery data: It has been 5 years since the UNGA resolution was implemented to determine weather bottom fishing caused significant adverse impacts and to protect ecosystems from those destructive fishing practices. We still have insufficient information to determine if recovery exceeds 20 years or not. Longer term data could be obtained more quickly by revisiting sites that have been previously monitored (for say 5-10 years) assuming disturbance regimes remain the same. Ecosystem indicators: Ecosystem indicators are needed that represent the whole ecosystem state and functionality aside from species specific indicators such as diversity, abundance, and richness, that are most commonly measured. Interim measure to protect VMEs: While research works at obtaining rigorous data to identify and understand vulnerable marine ecosystems and their recovery potential, interim measures should be taken to identify and protect them from current fishing disturbances.
  21. Thank you for your attention. I would like to welcome any questions.
  22. Basically, if the fail-safe number is large, the results of the test are robust against publication bias. If the failsafe number is small it does not mean there IS publication bias just that there MIGHT BE publication bias.