
Recommended
Recommended
More Related Content
Similar to KOM Slides_02D_Velocity and 03C_Acceleration Analysis.pdf
Similar to KOM Slides_02D_Velocity and 03C_Acceleration Analysis.pdf (20)
More from happycocoman
More from happycocoman (20)
Recently uploaded
Recently uploaded (20)
KOM Slides_02D_Velocity and 03C_Acceleration Analysis.pdf
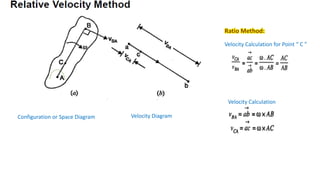
- 1. Configuration or Space Diagram Velocity Diagram Velocity Calculation Velocity Calculation for Point “ C ” Ratio Method:
- 2. Configuration or Space Diagram Velocity Diagram Problem No. 1 Scale Factor : 1: 2 a, d b c 𝜐𝑏𝑎 𝜐𝑐𝑏 𝜐𝑐𝑑 Velocity Diagram Scale Factor : 1 cm = 10 cm/s
- 3. Links Velocity Symbol Velocity (cm/s) Angular Velocity Symbol Angular Velocity (rad/s) AB 𝜐𝑏𝑎 50.24 ω𝑏𝑎 12.56 BC 𝜐𝑐𝑏 15.38 CD 𝜐𝑐𝑑 38.23 ω𝑐𝑑 4.77 TABLE Configuration or Space Diagram Velocity Diagram Problem No. 1
- 4. Problem No. 2 Configuration or Space Diagram E Velocity Diagram Scale Factor : 1cm = 100 cm/s a, e b c 𝜐𝑏𝑎 𝜐𝑐𝑏 𝜐𝑐𝑒 𝜐𝑑𝑎 d 𝜐𝑑𝑏 𝜐𝑑𝑐 Velocity Diagram
- 5. Problem No. 2 Configuration or Space Diagram Links Velocity Symbol Velocity (cm/s) Angular Velocity Symbol Angular Velocity (rad/s) BA 𝜐𝑏𝑎 471.30 ω𝑏𝑎 31.42 CB 𝜐𝑐𝑏 340 ω𝑐𝑏 5.67 DB 𝜐𝑑𝑏 170 CE 𝜐𝑐𝑒 400 Point D 𝜐𝑑𝑎 or 𝜐𝑑𝑒 410 E Scale Factor : 1cm = 100 cm/s a, e b c 𝜐𝑏𝑎 𝜐𝑐𝑏 𝜐𝑐𝑒 𝜐𝑑𝑎 d 𝜐𝑑𝑏 𝜐𝑑𝑐 Velocity Diagram TABLE
- 6. Problem No. 3 Configuration or Space Diagram Scale Factor : 1:2 O,02, O1 𝜐𝑎𝑜 Velocity Diagram 𝑂1 𝑂2 Scale Factor : 1cm = 100 mm/s a d 𝜐𝑑𝑎 𝜐𝑑02 b c 𝜐𝑐𝑏 𝜐𝑐𝑜1 𝜐𝑏𝑎 𝜐𝑑𝑏 Links Velocity Symbol Velocity (mm/s) Angular Velocity Symbol Angular Velocity (rad/s) OA 𝜐𝑎𝑜 867.64 ω𝑎𝑜 18.84 DA 𝜐𝑑𝑎 280 ω𝑑𝑎 1.84 BA 𝜐𝑏𝑎 180 ω𝑏𝑎 1.97 CB 𝜐𝑐𝑏 810 ω𝑐𝑏 8.90 Velocity at P 𝜐𝑑𝑜2 960 Velocity at C 𝜐𝑐𝑜1 170 V = 867.079 mm/sec o a b d c 172.682 965.953 a Velocity Diagram
- 7. Problem No. 3 Scale Factor : 1cm = 100 cm/s 𝑂1 𝑂2
- 8. Problem No. 4 Configuration or Space Diagram Scale Factor : 1 : 2 b 𝜐𝑎𝑜2 = Velocity Diagram ω𝑎𝑜2 × AO2 Scale Factor : 1 cm = 1m/sec O2, a O4, 𝜐𝑏𝑎 𝜐𝑏𝑜4 p 𝜐𝑝𝑎 𝜐𝑝 𝜐𝑎𝑜2 Links Velocity Symbol Velocity (mm/s) Angular Velocity Symbol Angular Velocity (rad/s) AO2 𝜐𝑎𝑜2 4500 ω𝑎𝑜2 45.00 BA 𝜐𝑏𝑎 4490 ω𝑏𝑎 44.90 BO4 𝜐𝑏𝑜4 6510 ω𝑏𝑜4 73.97 PA 𝜐𝑝𝑎 4490 Velocity at P 𝜐𝑝𝑜2 6200
- 11. Instantaneous Centre Method Types of Instantaneous Centres 1. Fixed Instantaneous Centres 2. Permanent Instantaneous Centres 3. Neither Fixed nor Permanent Instantaneous Centres
- 12. Instantaneous Centre Method Location of Instantaneous Centres
- 13. Instantaneous Centre Method Problem No. 1 𝜐𝑏𝑎 = ω𝑏𝑎 × BA 1 2 3 4 1 2 3 4 𝐼13 𝜐𝑏𝑎 𝑜𝑟 𝜐𝑏 = ω𝑏𝑎 × BA 𝜐𝑏 𝐵𝐼13 = 𝜐𝑐 𝐶𝐼13 ω𝑐𝑏 =
- 14. Instantaneous Centre Method Problem No. 1 𝜐𝑏𝑎 = ω𝑏𝑎 × BA 3. Fig. shows a pin Joined four bar linkage having the following dimensions : Fixed link AD = 4 m ; Driving link AB = 1.5 m, Driven link CD = 2.5 m ; Connecting link BC = 3 m Angle BAD = 60°. Link AB revolves at 25 rpm. Determine: (i) Angular velocity of link CD and (ii) Angular velocity of link BC. 1 2 3 4
- 15. Instantaneous Centre Method Problem No. 1 𝜐𝑏𝑎 𝑜𝑟 𝜐𝑏 = ω𝑏𝑎 × BA 𝜐𝑏 𝐵𝐼13 = 𝜐𝑐 𝐶𝐼13 ω𝑐𝑏 =
- 16. Instantaneous Centre Method Problem No. 2 𝐼13 1 2 3 4 𝐼24 𝜐𝑎 = 𝜐𝑏 𝐵𝐼13 ω𝑏𝑎 = 𝐴𝐼13
- 17. Instantaneous Centre Method Problem No. 3 𝜐𝑎 = 𝜐𝑏 𝐵𝐼13 𝐴𝐼13 1 2 3 4 5 6 12 23 34 45 56 13 24 35 46 14 25 36 15 26 16 1 𝜐𝑎𝑜 𝑜𝑟 𝜐𝑎 = ω𝑎𝑜 × AO 𝐼34 𝐼45 𝐼14 𝐼56 𝐼16 at infinity 𝐼23 2 3 4 5 6 1 6 1 𝐼15 𝜐𝑏 = 𝜐𝑑 𝐷𝐼14 𝐵𝐼14 𝜐𝑑 = 𝜐𝑒 𝐸𝐼15 𝐷𝐼15
- 18. Instantaneous Centre Method Problem No. 4 1 2 3 4 5 6 1 2 3 4 5 6 12 23 34 45 56 13 24 35 46 14 25 36 15 26 16 1 2 3 4 5 6 1 1 𝐼12 𝐼23 𝐼34 𝐼14 𝐼35 𝐼16 𝐼56 𝐼13 𝐼15 𝜐𝑝𝑜1 𝑜𝑟 𝜐𝑝 = ω𝑝𝑜1 × PO1 𝜐𝑝 = 𝜐𝑞 𝑄𝐼13 𝑃𝐼13 𝜐𝑞 = 𝜐𝑠 𝑆𝐼15 𝑄𝐼15 𝜐𝑠 = 𝜐𝑇 𝑇𝐼16 S𝐼16 𝐼24
- 19. Instantaneous Centre Method Arnold Kennedy Theorem
- 20. Relative Acceleration Method Tangential Component Radial Component a’ m b’
- 23. Relative Acceleration Method For a Slider : When the slider (point) moves along a straight line, then its radial acceleration will be zero
- 24. Relative Acceleration Method Problem No. 1 ω α Space Diagram 𝑝1 ′ x Scale : 1cm = 10 m/s2 𝑓𝑎𝑝1 𝑟 a’ 𝑓𝑎𝑝1 𝑡 𝑓𝑎𝑝1 y 𝑓𝑏𝑎 𝑟 𝑓𝑏𝑎 𝑡 𝑝2 ′ z 𝑓𝑏𝑝2 𝑟 𝑓𝑏𝑝2 𝑡 b’ 𝑓𝑏𝑝2 𝑓𝑏𝑎
- 25. Relative Acceleration Method Problem No. 1 Links Velocity Symbol Velocity (m/s) Angular Velocity Symbol Angular Velocity (rad/s) Acc. Symbol Radial Comp. Acc. Radial Comp. (m/s2) Acc. Symbol Tangential Comp. Acc. Tangential Comp. (m/s2) Angular Acc. Symbol and Value (rad/s2) TOTAL Acceleration Symbol & Value (m/s2) AP1 𝜐𝑎𝑝1 03 ω𝑎𝑝1 10 𝑓𝑎𝑝1 𝑟 30 𝑓𝑎𝑝1 𝑡 09 α𝑎𝑝1 = 30 𝑓𝑎𝑝1 = 31.6 BA 𝜐𝑏𝑎 2.1 ω𝑏𝑎 5.86 𝑓𝑏𝑎 𝑟 11.67 𝑓𝑏𝑎 𝑡 13.6 α𝑏𝑎 = 37.78 𝑓𝑏𝑎 = 18 BP2 𝜐𝑏𝑝2 2.25 ω𝑏𝑝2 6.13 𝑓𝑏𝑝2 𝑟 14.06 𝑓𝑏𝑝2 𝑡 28 α𝑏𝑝2 = 77.78 𝑓𝑏𝑝2 = 31.33 TABLE
- 26. Relative Acceleration Method Problem No. 2 Space Diagram 𝑜2 ′ x y z 𝑜4 ′ a’ b’ p’ 𝑓𝑎𝑜2 𝑟 𝑓𝑏𝑎 𝑟 𝑓𝑏𝑜4 𝑟 Scale : 1cm = 50 m/s2 𝑓𝑎𝑜2 𝑡 𝑓𝑎𝑜2 𝑓𝑏𝑜4 𝑡 𝑓𝑏𝑎 𝑡 𝑓𝑝𝑎 𝑓𝑏𝑜4 𝑓𝑝𝑜2 𝑓𝑏𝑎
- 27. Relative Acceleration Method Problem No. 2 Links Velocity Symbol Velocity (m/s) Angular Velocity Symbol Angular Velocity (rad/s) Acc. Symbol Radial Comp. Acc. Radial Comp. (m/s2) Acc. Symbol Tangential Comp. Acc. Tangential Comp. (m/s2) Angular Acc. Symbol and Value (rad/s2) TOTAL Acceleration Symbol & Value (m/s2) AO2 𝜐𝑎𝑜2 4.5 ω𝑎𝑜2 45 𝑓𝑎𝑜2 𝑟 202.5 𝑓𝑎𝑜2 𝑡 30 α𝑎𝑜2 = 300 𝑓𝑎𝑜2 = 204.71 BA 𝜐𝑏𝑎 4.49 ω𝑏𝑎 44.49 𝑓𝑏𝑎 𝑟 201.6 𝑓𝑏𝑎 𝑡 610 α𝑏𝑎 = 6100 𝑓𝑏𝑎 = 635 BO4 𝜐𝑏𝑜4 6.513 ω𝑏𝑜4 73.79 𝑓𝑏𝑜4 𝑟 482.03 𝑓𝑏𝑜4 𝑡 680 α𝑏𝑜4 = 7727.27 𝑓𝑏𝑜4 = 835 PA 𝜐𝑝𝑎 4.49 ω𝑝𝑎 44.49 𝑓𝑝𝑎 𝑟 201.6 𝑓𝑝𝑎 = 640 Velocity at P 𝜐𝑝𝑜2 6.20 𝑓𝑝𝑜2 = 490 TABLE
- 28. Relative Acceleration Method Problem No. 3 Space Diagram Scale : 1cm = 100 mm Length 𝜐𝑎𝑜 𝜐𝑐𝑎 𝜐𝑑𝑐 𝜐𝑐𝑞 𝜐𝑑𝑞 𝜐𝑏𝑑 𝜐𝑏𝑔 o, q, g a b c d Scale : 1cm = 0.25 m/s
- 29. Relative Acceleration Method Problem No. 3 Space Diagram Scale : 1cm = 100 mm Length Acceleration Diagram Scale : 1cm = 2 m/s2 o’ a’ 𝑓𝑎𝑜 𝑟 = 𝑓𝑎𝑜 x 𝑓𝑐𝑎 𝑟 𝑓𝑐𝑎 𝑡 q’ 𝑓𝑐𝑞 𝑟 y c’ 𝑓𝑐𝑞 𝑓𝑐𝑎 𝑓𝑑𝑞 𝑟 z 𝑓𝑑𝑞 𝑡 d’ 𝑓𝑑𝑐 𝑟 m 𝑓𝑑𝑐 𝑡 𝑓𝑑𝑐 𝑓𝑑𝑞 𝑓𝑏𝑑 𝑟 n 𝑓𝑏𝑑 𝑡 g’ b’ 𝑓𝑏𝑔 𝑡 = 𝑓𝑏𝑔 𝑓𝑏𝑑 𝑓𝑐𝑞 𝑡
- 30. Problem No. 3 Links Velocity Symbol Velocity (m/s) Angular Velocity Symbol Angular Velocity (rad/s) Acc. Symbol Radial Comp. Acc. Radial Comp. (m/s2) Acc. Symbol Tangential Comp. Acc. Tangential Comp. (m/s2) Angular Acc. Symbol and Value (rad/s2) TOTAL Acceleration Symbol & Value (m/s2) AO 𝜐𝑎𝑜 0.94 ω𝑎𝑜 6.28 𝑓𝑎𝑜 𝑟 5.89 𝑓𝑎𝑜 𝑡 0 α𝑎𝑜= 0 𝑓𝑎𝑜 = 5.89 CA 𝜐𝑐𝑎 1.00 ω𝑐𝑎 1.67 𝑓𝑐𝑎 𝑟 1.67 𝑓𝑐𝑎 𝑡 15 α𝑐𝑎 = 25 𝑓𝑐𝑎 = 15.1 CQ 𝜐𝑐𝑞 1.14 ω𝑐𝑞 7.86 𝑓𝑐𝑞 𝑟 8.96 𝑓𝑐𝑞 𝑡 3.6 α𝑐𝑞 = 24.83 𝑓𝑐𝑞 = 9.65 DC 𝜐𝑑𝑐 1.08 ω𝑑𝑐 8.64 𝑓𝑑𝑐 𝑟 9.33 𝑓𝑑𝑐 𝑡 5 α𝑑𝑐 = 40 𝑓𝑑𝑐 =10.58 DQ 𝜐𝑑𝑞 1.14 ω𝑑𝑞 7.86 𝑓𝑑𝑞 𝑟 8.96 𝑓𝑑𝑞 𝑡 3.6 α𝑑𝑞 = 24.83 𝑓𝑑𝑞 = 9.65 BD 𝜐𝑏𝑑 0.45 ω𝑏𝑑 0.90 𝑓𝑏𝑑 𝑟 0.405 𝑓𝑏𝑑 𝑡 7.21 α𝑏𝑑 = 14.44 𝑓𝑏𝑑 = 7.22 BG 𝜐𝑏𝑔 0.88 *** 𝑓𝑏𝑔 𝑟 0 𝑓𝑏𝑔 𝑡 8.4 α𝑏𝑞 = 21 𝑓𝑏𝑔 = 8.4 TABLE
- 31. Klein’s Construction (only for Slider Crank Mechanism) Problem No. 4 Space Diagram N
- 32. Klein’s Construction (only for Slider Crank Mechanism) Problem No. 4 Space Diagram Scale : 1cm = 1m/s Acceleration Diagram Using Relative Acc. Method for comparing with Klein’s method 𝜐𝑏𝑛 𝜐𝑎𝑜 𝜐𝑏𝑎 o, n b a N Velocity diagram Using Relative Velocity Method for comparing with Klein’s method o’, n’ a’ 𝑓𝑎𝑜 𝑟 =𝑓𝑎𝑜 𝑓𝑏𝑎 𝑟 x 𝑓𝑏𝑎 𝑡 b’ 𝑓𝑏𝑛 𝑡 =𝑓𝑏𝑛 𝑓𝑏𝑎 Scale : 1cm = 50 m/s2 Scale : 1cm = 100 length
- 33. Klein’s Construction (only for Slider Crank Mechanism) Problem No. 4 Velocity Diagram (Region OAC) C N X M P F H Acceleration Diagram (Region OAHFO) 𝜐𝑎𝑜 𝑜𝑟 𝜐𝑎 = ω𝑎𝑜 × AO x scale factor 𝜐𝑏𝑎 = ω𝑎𝑜 × AC x scale factor 𝜐𝑏𝑛 = ω𝑎𝑜 × OC x scale factor 𝑓𝑏𝑎 = 𝑓𝑎𝑜 𝑟 ω𝑎𝑜 2 × AO x Scale factor = 𝑓𝑏𝑎 𝑟 ω𝑎𝑜 2 × AH x Scale factor = 𝑓𝑏𝑎 𝑡 ω𝑎𝑜 2 × HF x Scale factor = 𝑓𝑏𝑛 𝑡 ω𝑎𝑜 2 × OF x Scale factor = ω𝑎𝑜 2 × AF x Scale factor
- 34. Problem No. 4 Links Velocity Symbol Velocity (m/s) Angular Velocity Symbol Angular Velocity (rad/s) Acc. Symbol Radial Comp. Acc. Radial Comp. (m/s2) Acc. Symbol Tangential Comp. Acc. Tangential Comp. (m/s2) Angular Acc. Symbol and Value (rad/s2) TOTAL Acceleration Symbol & Value (m/s2) AO 𝜐𝑎𝑜 4.189 ω𝑎𝑜 41.89 𝑓𝑎𝑜 𝑟 175.75 𝑓𝑎𝑜 𝑡 0 α𝑎𝑜= 0 𝑓𝑎𝑜 =175.75 BA 𝜐𝑏𝑎 2.80 ω𝑏𝑎 5.61 𝑓𝑏𝑎 𝑟 15.68 𝑓𝑏𝑎 𝑡 95 α𝑏𝑎 = 190 𝑓𝑏𝑎 = 96.28 BN 𝜐𝑏𝑛 3.10 **** **** 𝑓𝑏𝑛 𝑟 0 𝑓𝑏𝑛 𝑡 165 ∗∗∗∗ 𝑓𝑏𝑛 = 165 TABLE
- 35. Klein’s Construction (only for Slider Crank Mechanism) Problem No. 4 Y Y1
- 36. Klein’s Construction (only for Slider Crank Mechanism) Problem No. 4