2. CONTENTS
• WHAT IS PCA
• HOW IT WORKS
• HISTORY OF PCA
• PCA IMPLEMENTATION
• USES of PCA
• LIMITATION OF PCA
2/28
3. WHAT IS PCA
PCA takes a dataset with a
lots of dimension (i.e. Lots
of Cells) and flattens it to
2 or 3 dimensions so we
can look on it.
3/28
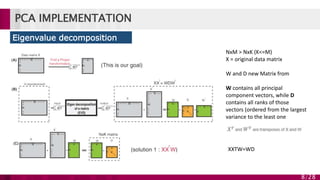
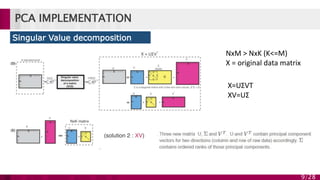
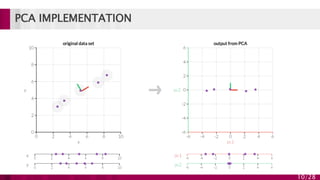
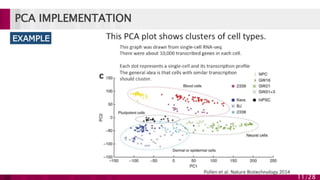
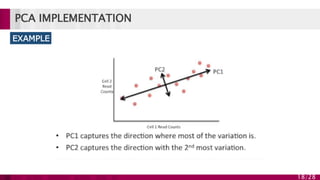
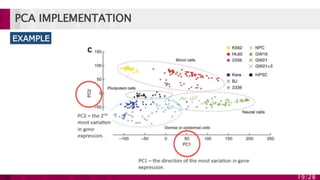
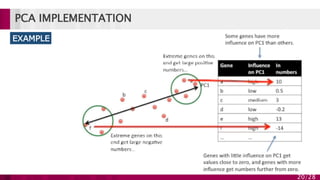
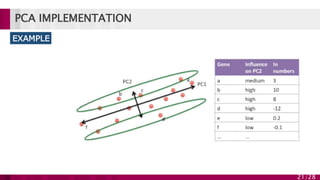
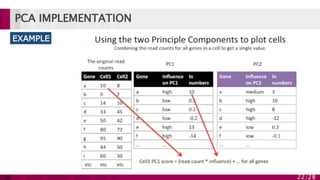
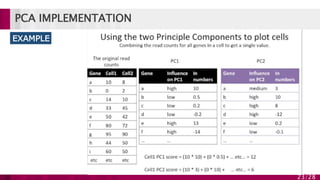
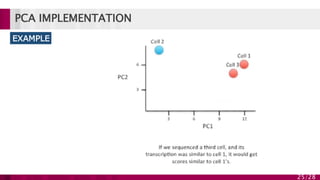
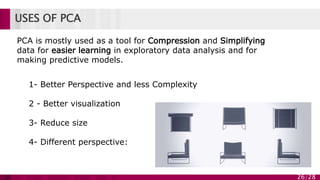
Principal component analysis (PCA) is a technique used to
emphasize variation and bring out strong patterns in a dataset.
It's often used to make data easy to explore and visualize.
4. HOW IT WORKS
4/28
Eating in the UK (a 17D example) Here's the plot of the data along the first
principal component. Already we can see
something is different about Northern
Ireland.
Northern Irish eat way more grams of fresh
potatoes and way fewer of fresh fruits, cheese,
fish and alcoholic drinks
5. HISTORY OF PCA
• PCA was invented in 1901
by Karl Pearson
• as an analogue of the principal
axis theorem in mechanics
5/28
src: https://commons.wikimedia.org/wiki/File:GaussianScatterPCA.svg
6. HISTORY OF PCA
Depending on the field of application, it is also
named:
6/28
• discrete Kosambi-Karhunen–Loève transform (KLT) in signal
processing,
• the Hotelling transform in multivariate quality control,
• proper orthogonal decomposition (POD) in mechanical engineering,
• singular value decomposition (SVD) of X (Golub and Van Loan, 1983),
• eigenvalue decomposition (EVD) of XTX in linear algebra,
• Eckart–Young theorem (Harman, 1960), or Schmidt–Mirsky theorem in
psychometrics,
• empirical orthogonal functions (EOF) in meteorological science,
• empirical eigenfunction decomposition (Sirovich, 1987) etc
7. PCA IMPLEMENTATION
PCA could have different implementations.
But most popular ones are
• eigenvalue decomposition (EVD) and
• singular value decomposition (SVD).
7/28
8. PCA IMPLEMENTATION
Eigenvalue decomposition
(EVD)
8/28
NxM > NxK (K<=M)
X = original data matrix
W and D new Matrix from
W contains all principal
component vectors, while D
contains all ranks of those
vectors (ordered from the largest
variance to the least one
XXTW=WD
15. PCA IMPLEMENTATION
15/28
EXAMPLE
Dot are spread out along a
diagonal line and maximum
variation of data is between the
two end points of line
Dots are also spread out a little above
and below the first line and 2nd largest
amount of variation is at the endpoints
of the new line
26. USES OF PCA
26/28
PCA is mostly used as a tool for Compression and Simplifying
data for easier learning in exploratory data analysis and for
making predictive models.
1- Better Perspective and less Complexity
2 - Better visualization
3- Reduce size
4- Different perspective:
27. LIMITATION OF PCA
27/28
If the data does not
follow a
multidimensional
normal (Gaussian)
distribution, PCA
may not give the
best principal
components