Download to read offline
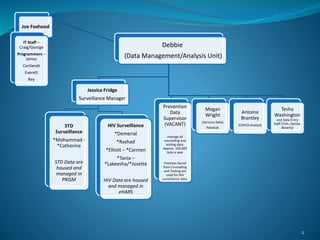
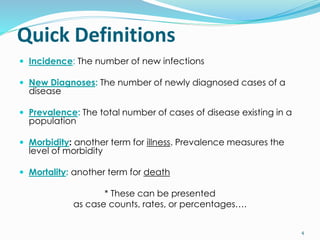
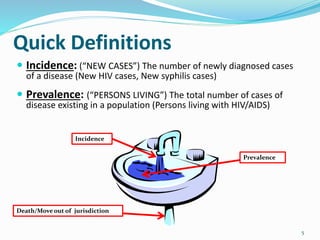
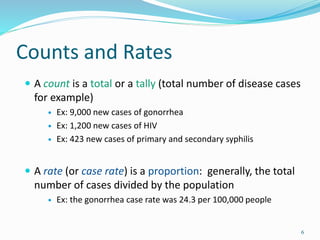
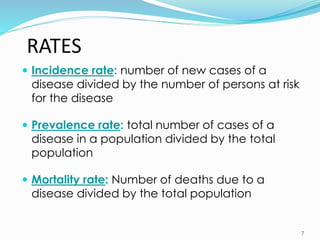
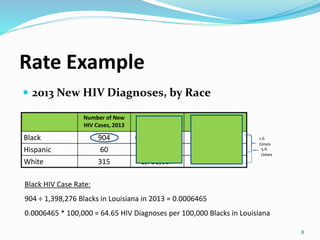


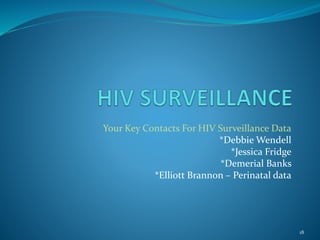


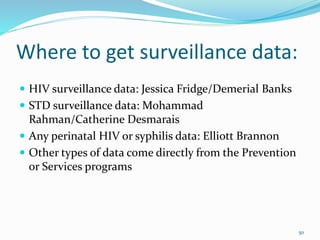
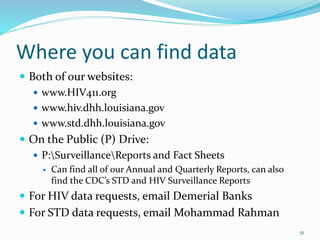

This document provides an organizational chart and descriptions of the STD/HIV surveillance program in Louisiana. It shows the data management and analysis units for STD and HIV data housed in different systems. It also lists contacts for HIV surveillance data and describes how prevention and counseling data are managed. Quick definitions of epidemiological terms and examples of rates and counts are provided.