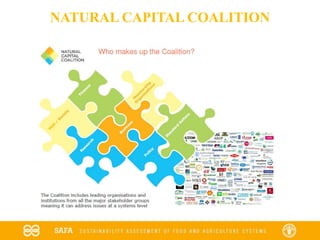
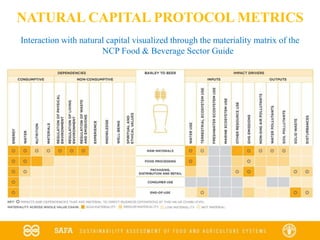
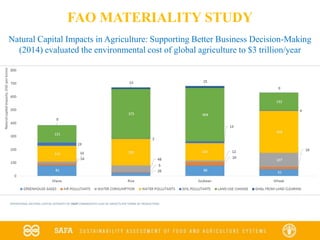
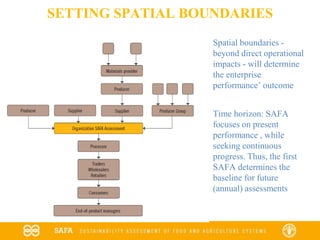
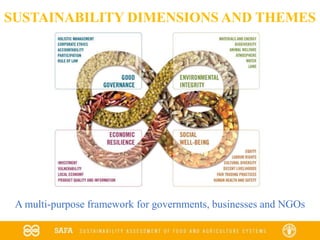
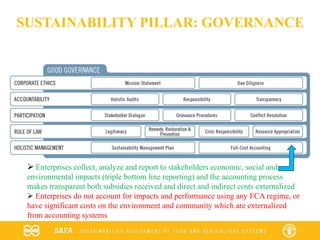
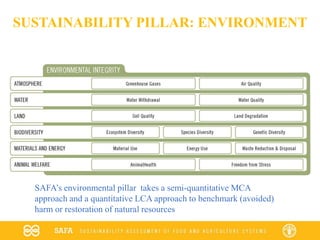
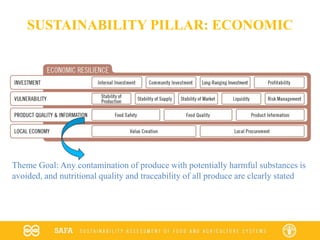
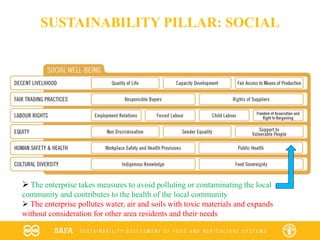
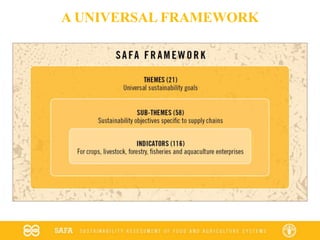
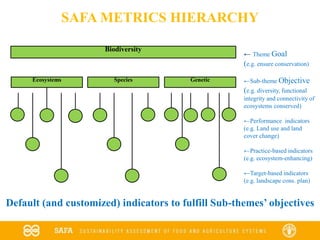
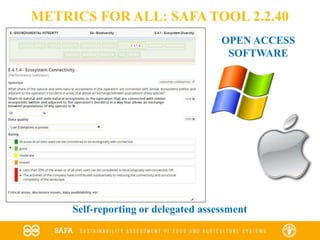
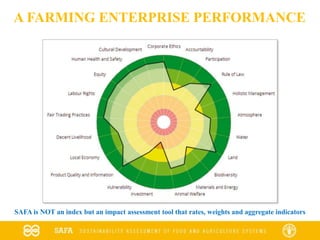
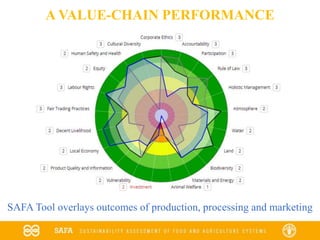
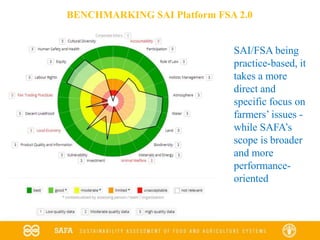
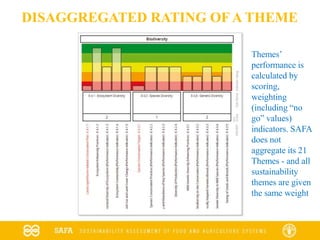
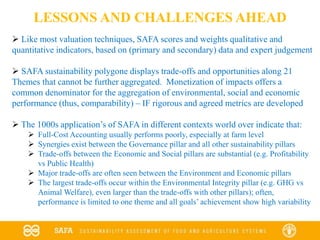
The True Cost of American Food, San Francisco, USA, 16 April 2016
SUSTAINABILITY METHODS AND METRICS
NADIA EL-HAGE SCIALABBA
Senior Natural Resources Officer, FAO Climate and Environment Division
COMMENTS ON THE EBBRAT MODEL
(Ecosystem-based business risk analysis tool)
 Taking ecosystem services as the focus for determining reliance on all natural
resources (including atmosphere, land, water and biodiversity) is brilliant for
environmental assessment – but social wellbeing aspects may be understated
 EBBRAT assesses qualitatively and quantitatively but also monetize risks and
opportunities: this allows identifying individual hotspots, trade-offs and
synergies and different performances could be aggregated into a single index –
but it is unclear how the results would be displayed to ease decision-making
 Performance evaluation of enterprises is subjective, as short-term perceived
impacts are chosen over longer-term and objective assessments – the problem is
not the self-reporting process but the absence of a template (or check list) to
follow, with clear criteria for variations
 Qualitative assessments address conflicts between sustainability pillars while
trade-offs are mainly observed within single dimension, namely environmental
COMMENTS ON THE EBBRAT MODEL (2)
(Ecosystem-based business risk analysis tool)
 The overall approach to monetizing ecosystem service categories is sound:
 Provisioning services: direct market value
 Regulating services: replacement costs (and production function?)
 Supporting services: avoided costs
 Cultural services: benefit transfer (but employment to be further stressed)
 However:
 Are there templates for farm questionnaires with default indicators?
 Use of “available” biophysical data may be insufficient
 Indicators could be improved by including more comparable variables,
such as: crop erosion potential (for soil replacement costs); water scarcity
(for consumptive use); renewable energy ratio (for energy budget)
 Monetary units could be debatable (e.g. Carbon price)
VALUATION APPROACHES
Direct market value Replacement costs Hedonic pricing (WTP)
& Production function & Damage cost avoided & Travel Costs (recreational areas)
Monetary valuation based on market data is defensible, but monetization remains an
inaccurate proxy for societal values:
Carbon price may be lower than true economic value: market price of carbon
depends on trade carbon emissions, which depend on volatile markets (from $45/t a
few years ago to $5/t today); Carbon taxes and fines, defined by governments, reflect
political reality (EU/ETS Euro 100/t) but not damage costs; Social Cost of Carbon
has a wide range of variation ($ 8-112/t) depending on coverage and key parameters
choice (i.e. discount rate, time-horizon, risk aversion and climate sensitivity)
Soil erosion rate values have a large cost spectrum (varying by a factor of 2 to 50)
for both on-site damage (e.g. yield losses, drop in land value) and off-site (e.g.
flooding, sedimentation, health)
Biodiversity (of species and ecosystems) is most difficult to monetize as:
biodiversity is not always marketed nor has observable prices, while presenting
double counting challenges with Carbon, land and water valuations
MONETIZATION CHALLENGES
MONETIZATION CHALLENGES (2)
Water use cost do not reflect contribution to water scarcity ($ 2.02 to 18.8/m3):
most direct use (irrigation) water costs are already reflected in producer prices; no
agreement on accounting for extraction or consumption volumes; infrastructure and
provisioning costs often not included in consumptive use. Water quality is relatively
easy to value through clean-up expenditures for pesticides removal (30% in USA)
and nitrates from drinking water, as well as mitigation of eutrophication (N and P)
Other challenges of market valuation:
 market prices may be distorted by policy failures (e.g. water price)
 replacement costs may under-estimate the bundle of all ecosystem services
 damage costs avoided can be complex, as values involve annual average damages
associated with different return periods (e.g. 5, 30, 50, 100 years)
 benefit transfer to ecosystem services is difficult to apply (recreation indirect use)
 the quality of an asset refers to a given point in time: pristine biomes?
Most valuation techniques involve selecting a range of parameters and giving them a
value through scoring and weighting, based on data and expert judgement
NATURAL CAPITAL COALITION
Source: Natural Capital Coalition Food and Beverage Sector Guide: Materiality Matrix for the value chain of barley used to produce beer
NATURAL CAPITAL PROTOCOL
 The Natural Capital Coalition (~ 200 members) is currently developing a
standardized framework that outlines why, what and how businesses can identify
their impacts and dependencies on natural capital
 The Natural Capital Protocol has two sector guides, one of which is for food and
beverages , developed by an IUCN-led consortium to which FAO participates
 The Draft Food & Beverage Sector Guide was piloted and publicly commented
till end of February 2016; the final text is to be launched on 13 July 2016
 The Protocol (so far) consists of 10 steps including: scoping; measuring and
valuing; and applying and embedding results in business’ strategies and operations
NCP helps connecting different non-financial work streams in business (e.g.
energy, water, waste) in a coherent way, as well as providing guidance on
qualitative, quantitative and monetary valuation of impacts and/or dependencies for
particular business contexts and applications (but no rule of best practice)
Interaction with natural capital visualized through the materiality matrix of the
NCP Food & Beverage Sector Guide
Source: Natural Capital Coalition Food and Beverage Sector Guide: Materiality Matrix for the value chain of barley used to produce beer
NATURAL CAPITAL PROTOCOL METRICS
OPERATIONAL NATURAL CAPITAL INTENSITY OF CROP COMMODITIES (USD OF IMPACTS PER TONNE OF PRODUCTION)
Natural Capital Impacts in Agriculture: Supporting Better Business Decision-Making
(2014) evaluated the environmental cost of global agriculture to $3 trillion/year
FAO MATERIALITY STUDY
SETTING SPATIAL BOUNDARIES
Spatial boundaries -
beyond direct operational
impacts - will determine
the enterprise
performance’ outcome
Time horizon: SAFA
focuses on present
performance , while
seeking continuous
progress. Thus, the first
SAFA determines the
baseline for future
(annual) assessments
SUSTAINABILITY DIMENSIONS AND THEMES
A multi-purpose framework for governments, businesses and NGOs
SUSTAINABILITY PILLAR: GOVERNANCE
 Enterprises collect, analyze and report to stakeholders economic, social and
environmental impacts (triple bottom line reporting) and the accounting process
makes transparent both subsidies received and direct and indirect costs externalized
 Enterprises do not account for impacts and performance using any FCA regime, or
have significant costs on the environment and community which are externalized
from accounting systems
SUSTAINABILITY PILLAR: ENVIRONMENT
SAFA’s environmental pillar takes a semi-quantitative MCA
approach and a quantitative LCA approach to benchmark (avoided)
harm or restoration of natural resources
SUSTAINABILITY PILLAR: ECONOMIC
Theme Goal: Any contamination of produce with potentially harmful substances is
avoided, and nutritional quality and traceability of all produce are clearly stated
SUSTAINABILITY PILLAR: SOCIAL
 The enterprise takes measures to avoid polluting or contaminating the local
community and contributes to the health of the local community
 The enterprise pollutes water, air and soils with toxic materials and expands
without consideration for other area residents and their needs
A UNIVERSAL FRAMEWORK
Performance
Biodiversity Goal
Ecosystems Species Genetic
Practice
Target
← Theme Goal
(e.g. ensure conservation)
←Sub-theme Objective
(e.g. diversity, functional
integrity and connectivity of
ecosystems conserved)
←Performance indicators
(e.g. Land use and land
cover change)
←Practice-based indicators
(e.g. ecosystem-enhancing)
←Target-based indicators
(e.g. landscape cons. plan)
SAFA METRICS HIERARCHY
Default (and customized) indicators to fulfill Sub-themes’ objectives
METRICS FOR ALL: SAFA TOOL 2.2.40
OPEN ACCESS
SOFTWARE
Self-reporting or delegated assessment
A FARMING ENTERPRISE PERFORMANCE
SAFA is NOT an index but an impact assessment tool that rates, weights and aggregate indicators
A VALUE-CHAIN PERFORMANCE
SAFA Tool overlays outcomes of production, processing and marketing
BENCHMARKING SAI Platform FSA 2.0
SAI/FSA being
practice-based, it
takes a more
direct and
specific focus on
farmers’ issues -
while SAFA’s
scope is broader
and more
performance-
oriented
DISAGGREGATED RATING OF A THEME
Themes’
performance is
calculated by
scoring,
weighting
(including “no
go” values)
indicators. SAFA
does not
aggregate its 21
Themes - and all
sustainability
themes are given
the same weight
LESSONS AND CHALLENGES AHEAD
 Like most valuation techniques, SAFA scores and weights qualitative and
quantitative indicators, based on (primary and secondary) data and expert judgement
 SAFA sustainability polygone displays trade-offs and opportunities along 21
Themes that cannot be further aggregated. Monetization of impacts offers a
common denominator for the aggregation of environmental, social and economic
performance (thus, comparability) – IF rigorous and agreed metrics are developed
 The 1000s application’s of SAFA in different contexts world over indicate that:
 Full-Cost Accounting usually performs poorly, especially at farm level
 Synergies exist between the Governance pillar and all other sustainability pillars
 Trade-offs between the Economic and Social pillars are substantial (e.g. Profitability
vs Public Health)
 Major trade-offs are often seen between the Environment and Economic pillars
 The largest trade-offs occur within the Environmental Integrity pillar (e.g. GHG vs
Animal Welfare), even larger than the trade-offs with other pillars); often,
performance is limited to one theme and all goals’ achievement show high variability
www.fao.org/nr/sustainability

Nadia Scialabba - Methods and metrics

  • 1.
    The True Costof American Food, San Francisco, USA, 16 April 2016 SUSTAINABILITY METHODS AND METRICS NADIA EL-HAGE SCIALABBA Senior Natural Resources Officer, FAO Climate and Environment Division
  • 2.
    COMMENTS ON THEEBBRAT MODEL (Ecosystem-based business risk analysis tool)  Taking ecosystem services as the focus for determining reliance on all natural resources (including atmosphere, land, water and biodiversity) is brilliant for environmental assessment – but social wellbeing aspects may be understated  EBBRAT assesses qualitatively and quantitatively but also monetize risks and opportunities: this allows identifying individual hotspots, trade-offs and synergies and different performances could be aggregated into a single index – but it is unclear how the results would be displayed to ease decision-making  Performance evaluation of enterprises is subjective, as short-term perceived impacts are chosen over longer-term and objective assessments – the problem is not the self-reporting process but the absence of a template (or check list) to follow, with clear criteria for variations  Qualitative assessments address conflicts between sustainability pillars while trade-offs are mainly observed within single dimension, namely environmental
  • 3.
    COMMENTS ON THEEBBRAT MODEL (2) (Ecosystem-based business risk analysis tool)  The overall approach to monetizing ecosystem service categories is sound:  Provisioning services: direct market value  Regulating services: replacement costs (and production function?)  Supporting services: avoided costs  Cultural services: benefit transfer (but employment to be further stressed)  However:  Are there templates for farm questionnaires with default indicators?  Use of “available” biophysical data may be insufficient  Indicators could be improved by including more comparable variables, such as: crop erosion potential (for soil replacement costs); water scarcity (for consumptive use); renewable energy ratio (for energy budget)  Monetary units could be debatable (e.g. Carbon price)
  • 4.
    VALUATION APPROACHES Direct marketvalue Replacement costs Hedonic pricing (WTP) & Production function & Damage cost avoided & Travel Costs (recreational areas)
  • 5.
    Monetary valuation basedon market data is defensible, but monetization remains an inaccurate proxy for societal values: Carbon price may be lower than true economic value: market price of carbon depends on trade carbon emissions, which depend on volatile markets (from $45/t a few years ago to $5/t today); Carbon taxes and fines, defined by governments, reflect political reality (EU/ETS Euro 100/t) but not damage costs; Social Cost of Carbon has a wide range of variation ($ 8-112/t) depending on coverage and key parameters choice (i.e. discount rate, time-horizon, risk aversion and climate sensitivity) Soil erosion rate values have a large cost spectrum (varying by a factor of 2 to 50) for both on-site damage (e.g. yield losses, drop in land value) and off-site (e.g. flooding, sedimentation, health) Biodiversity (of species and ecosystems) is most difficult to monetize as: biodiversity is not always marketed nor has observable prices, while presenting double counting challenges with Carbon, land and water valuations MONETIZATION CHALLENGES
  • 6.
    MONETIZATION CHALLENGES (2) Wateruse cost do not reflect contribution to water scarcity ($ 2.02 to 18.8/m3): most direct use (irrigation) water costs are already reflected in producer prices; no agreement on accounting for extraction or consumption volumes; infrastructure and provisioning costs often not included in consumptive use. Water quality is relatively easy to value through clean-up expenditures for pesticides removal (30% in USA) and nitrates from drinking water, as well as mitigation of eutrophication (N and P) Other challenges of market valuation:  market prices may be distorted by policy failures (e.g. water price)  replacement costs may under-estimate the bundle of all ecosystem services  damage costs avoided can be complex, as values involve annual average damages associated with different return periods (e.g. 5, 30, 50, 100 years)  benefit transfer to ecosystem services is difficult to apply (recreation indirect use)  the quality of an asset refers to a given point in time: pristine biomes? Most valuation techniques involve selecting a range of parameters and giving them a value through scoring and weighting, based on data and expert judgement
  • 7.
  • 8.
    Source: Natural CapitalCoalition Food and Beverage Sector Guide: Materiality Matrix for the value chain of barley used to produce beer NATURAL CAPITAL PROTOCOL  The Natural Capital Coalition (~ 200 members) is currently developing a standardized framework that outlines why, what and how businesses can identify their impacts and dependencies on natural capital  The Natural Capital Protocol has two sector guides, one of which is for food and beverages , developed by an IUCN-led consortium to which FAO participates  The Draft Food & Beverage Sector Guide was piloted and publicly commented till end of February 2016; the final text is to be launched on 13 July 2016  The Protocol (so far) consists of 10 steps including: scoping; measuring and valuing; and applying and embedding results in business’ strategies and operations NCP helps connecting different non-financial work streams in business (e.g. energy, water, waste) in a coherent way, as well as providing guidance on qualitative, quantitative and monetary valuation of impacts and/or dependencies for particular business contexts and applications (but no rule of best practice)
  • 9.
    Interaction with naturalcapital visualized through the materiality matrix of the NCP Food & Beverage Sector Guide Source: Natural Capital Coalition Food and Beverage Sector Guide: Materiality Matrix for the value chain of barley used to produce beer NATURAL CAPITAL PROTOCOL METRICS
  • 10.
    OPERATIONAL NATURAL CAPITALINTENSITY OF CROP COMMODITIES (USD OF IMPACTS PER TONNE OF PRODUCTION) Natural Capital Impacts in Agriculture: Supporting Better Business Decision-Making (2014) evaluated the environmental cost of global agriculture to $3 trillion/year FAO MATERIALITY STUDY
  • 12.
    SETTING SPATIAL BOUNDARIES Spatialboundaries - beyond direct operational impacts - will determine the enterprise performance’ outcome Time horizon: SAFA focuses on present performance , while seeking continuous progress. Thus, the first SAFA determines the baseline for future (annual) assessments
  • 13.
    SUSTAINABILITY DIMENSIONS ANDTHEMES A multi-purpose framework for governments, businesses and NGOs
  • 14.
    SUSTAINABILITY PILLAR: GOVERNANCE Enterprises collect, analyze and report to stakeholders economic, social and environmental impacts (triple bottom line reporting) and the accounting process makes transparent both subsidies received and direct and indirect costs externalized  Enterprises do not account for impacts and performance using any FCA regime, or have significant costs on the environment and community which are externalized from accounting systems
  • 15.
    SUSTAINABILITY PILLAR: ENVIRONMENT SAFA’senvironmental pillar takes a semi-quantitative MCA approach and a quantitative LCA approach to benchmark (avoided) harm or restoration of natural resources
  • 16.
    SUSTAINABILITY PILLAR: ECONOMIC ThemeGoal: Any contamination of produce with potentially harmful substances is avoided, and nutritional quality and traceability of all produce are clearly stated
  • 17.
    SUSTAINABILITY PILLAR: SOCIAL The enterprise takes measures to avoid polluting or contaminating the local community and contributes to the health of the local community  The enterprise pollutes water, air and soils with toxic materials and expands without consideration for other area residents and their needs
  • 18.
  • 19.
    Performance Biodiversity Goal Ecosystems SpeciesGenetic Practice Target ← Theme Goal (e.g. ensure conservation) ←Sub-theme Objective (e.g. diversity, functional integrity and connectivity of ecosystems conserved) ←Performance indicators (e.g. Land use and land cover change) ←Practice-based indicators (e.g. ecosystem-enhancing) ←Target-based indicators (e.g. landscape cons. plan) SAFA METRICS HIERARCHY Default (and customized) indicators to fulfill Sub-themes’ objectives
  • 20.
    METRICS FOR ALL:SAFA TOOL 2.2.40 OPEN ACCESS SOFTWARE Self-reporting or delegated assessment
  • 21.
    A FARMING ENTERPRISEPERFORMANCE SAFA is NOT an index but an impact assessment tool that rates, weights and aggregate indicators
  • 22.
    A VALUE-CHAIN PERFORMANCE SAFATool overlays outcomes of production, processing and marketing
  • 23.
    BENCHMARKING SAI PlatformFSA 2.0 SAI/FSA being practice-based, it takes a more direct and specific focus on farmers’ issues - while SAFA’s scope is broader and more performance- oriented
  • 24.
    DISAGGREGATED RATING OFA THEME Themes’ performance is calculated by scoring, weighting (including “no go” values) indicators. SAFA does not aggregate its 21 Themes - and all sustainability themes are given the same weight
  • 25.
    LESSONS AND CHALLENGESAHEAD  Like most valuation techniques, SAFA scores and weights qualitative and quantitative indicators, based on (primary and secondary) data and expert judgement  SAFA sustainability polygone displays trade-offs and opportunities along 21 Themes that cannot be further aggregated. Monetization of impacts offers a common denominator for the aggregation of environmental, social and economic performance (thus, comparability) – IF rigorous and agreed metrics are developed  The 1000s application’s of SAFA in different contexts world over indicate that:  Full-Cost Accounting usually performs poorly, especially at farm level  Synergies exist between the Governance pillar and all other sustainability pillars  Trade-offs between the Economic and Social pillars are substantial (e.g. Profitability vs Public Health)  Major trade-offs are often seen between the Environment and Economic pillars  The largest trade-offs occur within the Environmental Integrity pillar (e.g. GHG vs Animal Welfare), even larger than the trade-offs with other pillars); often, performance is limited to one theme and all goals’ achievement show high variability
  • 26.