Download as PDF, PPTX
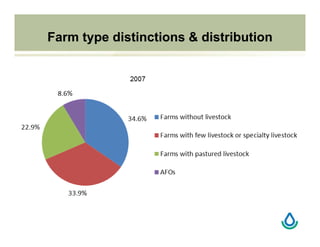
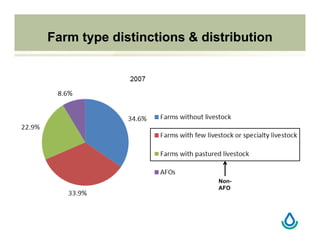
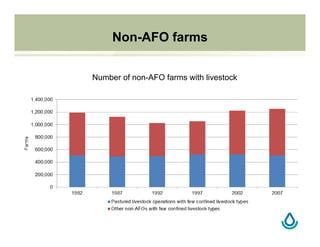
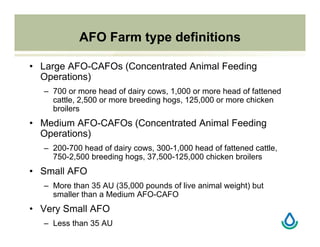
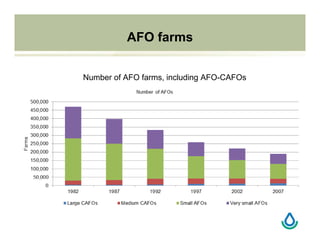
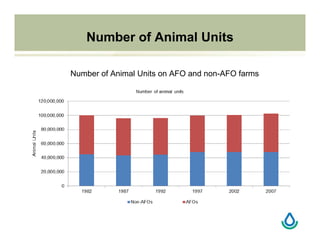
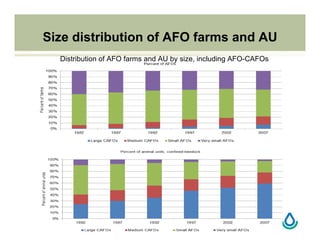
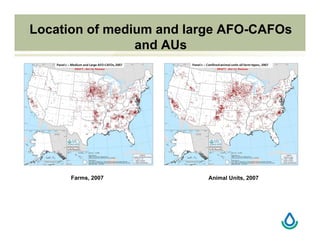
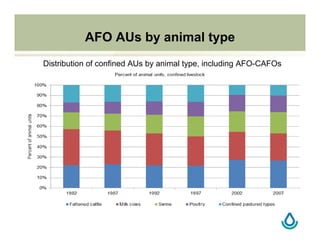

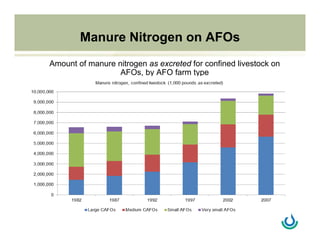
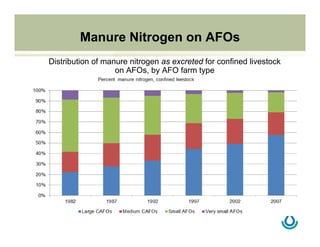
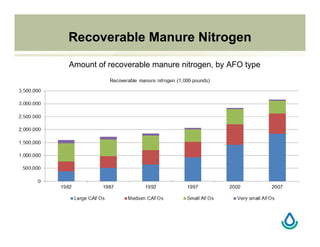
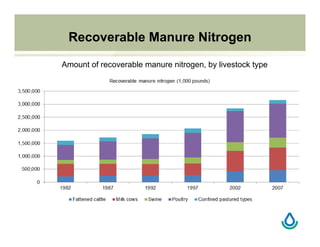
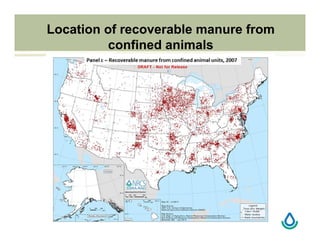
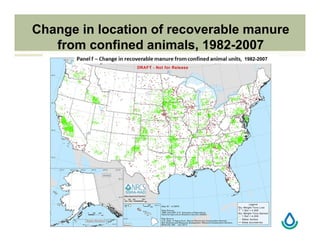
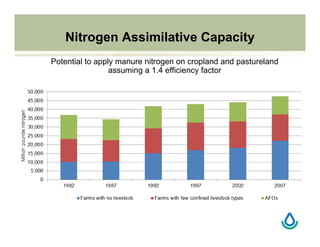
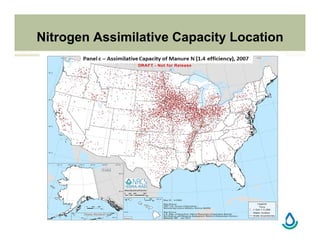
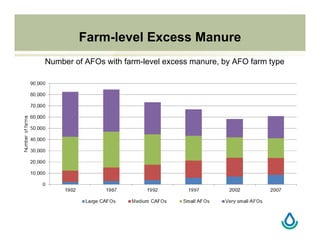
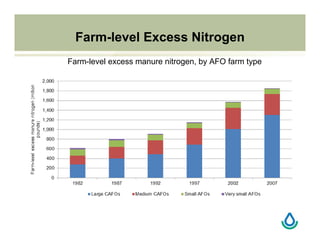
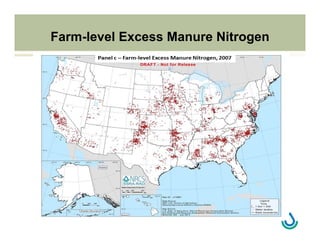
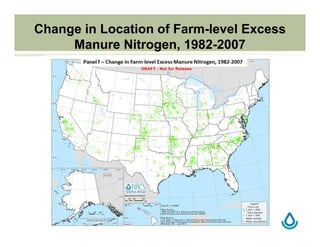
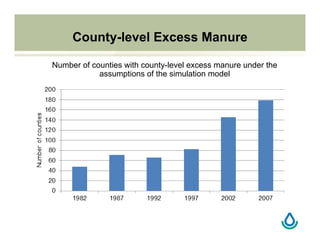
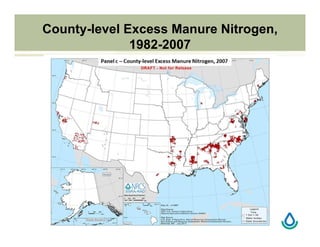
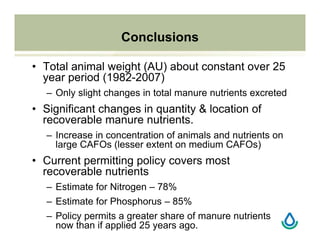
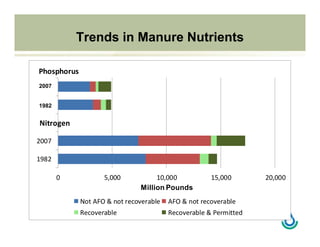
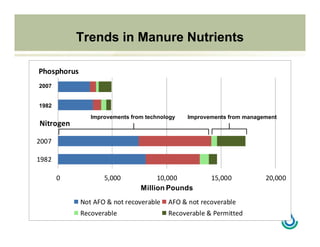
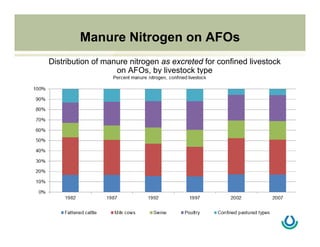
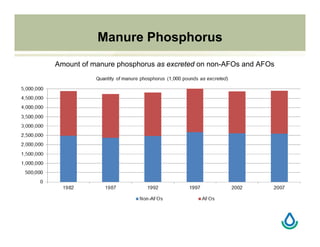
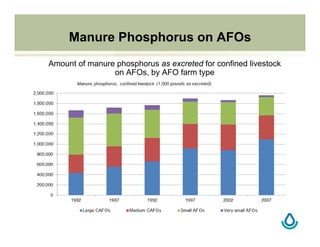
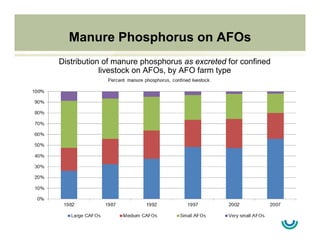
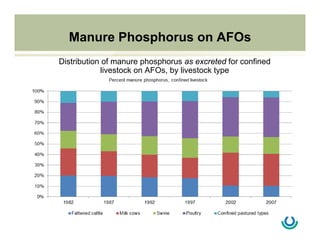
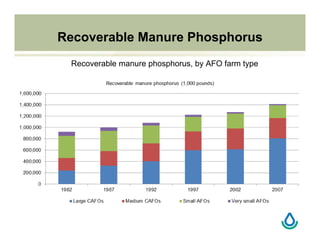
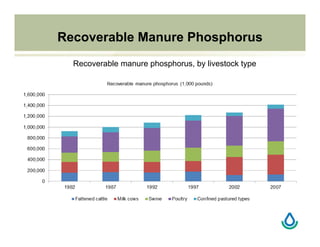
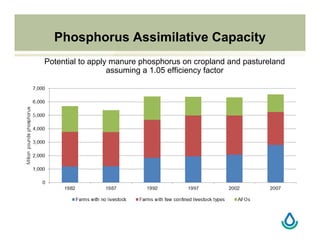

The document presents trends in recoverable manure nutrients and livestock production across the U.S. from 1982 to 2007, focusing on manure management's impact on agricultural water quality. It highlights the increasing concentration of animals in large concentrated animal feeding operations (CAFOs) and how current permitting policies have improved nutrient management over time. The presentation culminates in findings about the distribution and potential recoverable nitrogen and phosphorus from manure at various levels, including farm and county.


