Global Medical Cures™ | Kidney Disease Statistics for USA
•
1 like•967 views

Global Medical Cures™ | Kidney Disease Statistics for USA DISCLAIMER- Global Medical Cures™ does not offer any medical advice, diagnosis, treatment or recommendations. Only your healthcare provider/physician can offer you information and recommendations for you to decide about your healthcare choices.

Recommended
Recommended
More Related Content
What's hot
What's hot (20)
Viewers also liked
Viewers also liked (15)
Similar to Global Medical Cures™ | Kidney Disease Statistics for USA
Similar to Global Medical Cures™ | Kidney Disease Statistics for USA (20)
More from Global Medical Cures™
More from Global Medical Cures™ (20)
Recently uploaded
Recently uploaded (20)
Global Medical Cures™ | Kidney Disease Statistics for USA
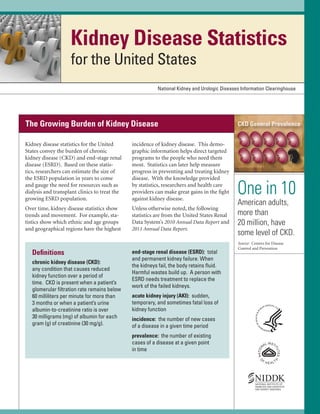
- 1. Kidney Disease Statistics for the United States National Kidney and Urologic Diseases Information Clearinghouse The Growing Burden of Kidney Disease Kidney disease statistics for the United States convey the burden of chronic kidney disease (CKD) and end-stage renal disease (ESRD). Based on these statis tics, researchers can estimate the size of the ESRD population in years to come and gauge the need for resources such as dialysis and transplant clinics to treat the growing ESRD population. incidence of kidney disease. This demo graphic information helps direct targeted programs to the people who need them most. Statistics can later help measure progress in preventing and treating kidney disease. With the knowledge provided by statistics, researchers and health care providers can make great gains in the fight against kidney disease. Over time, kidney disease statistics show trends and movement. For example, sta tistics show which ethnic and age groups and geographical regions have the highest Unless otherwise noted, the following statistics are from the United States Renal Data System’s 2010 Annual Data Report and 2011 Annual Data Report. Definitions chronic kidney disease (CKD): any condition that causes reduced kidney function over a period of time. CKD is present when a patient’s glomerular filtration rate remains below 60 milliliters per minute for more than 3 months or when a patient’s urine albumin-to-creatinine ratio is over 30 milligrams (mg) of albumin for each gram (g) of creatinine (30 mg/g). end-stage renal disease (ESRD): total and permanent kidney failure. When the kidneys fail, the body retains fluid. Harmful wastes build up. A person with ESRD needs treatment to replace the work of the failed kidneys. acute kidney injury (AKI): sudden, temporary, and sometimes fatal loss of kidney function incidence: the number of new cases of a disease in a given time period prevalence: the number of existing cases of a disease at a given point in time CKD General Prevalence One in 10 American adults, more than 20 million, have some level of CKD. Source: Centers for Disease Control and Prevention
- 2. CKD Incidence ■ The incidence of CKD is increasing most rapidly in people ages 65 and older. ■ The incidence of recognized CKD in people ages 65 and older more than doubled between 2000 and 2008. ■ The incidence of recognized CKD among 20- to 64-year-olds is less than 0.5 percent. Percent of Population with New Cases of CKD, by Age Group 4.5 B 4.0 B J 3.5 Medicare ages 65+ MarketScan ages 20–64 3.0 Percent B B B 2.5 2.0 B B B B B 1.5 1.0 0.5 J J J J J J 2000 2001 2002 2003 2004 2005 0 J J 2007 2008 J 2006 Year *MarketScan represents data from employer group health plans. CKD Prevalence ■ ■ Percent of Population with Stage 3 CKD, by Age Group The prevalence of CKD is growing most rapidly in people ages 60 and older. 30 Between the 1988–1994 National Health and Nutrition Examination Survey (NHANES) study and the 2003–2006 NHANES study, the prevalence of CKD in people ages 60 and older jumped from 18.8 to 24.5 percent. During that same period, the prevalence of CKD in people between the ages of 20 and 39 stayed consistently below 0.5 percent. Ages 20–39 Ages 60+ 25 20 Percent ■ 26.0% 24.5% 24.2% 18.8% 15 10 5 0 0.1% 0.3% NHANES 1988–1994 NHANES NHANES NHANES 1999–2002 2003–2006 2001–2008 0.1% Years 2 | Kidney Disease Statistics for the United States 0.2%
- 3. ESRD Incident Rate After rising steadily from 1980 to 2001, the incident rate of ESRD leveled off. Adjusted Incident Rates of ESRD 400 350 Rate per Million 300 250 200 150 100 50 19 80 19 81 19 82 19 83 19 84 19 85 19 86 19 87 19 88 19 89 19 90 19 91 19 92 19 93 19 94 19 95 19 96 19 97 19 98 19 99 20 00 20 01 20 02 20 03 20 04 20 05 20 06 20 07 20 08 20 09 0 Year ESRD Incident Rates by Race ■ ESRD incident rates are more than three times higher for African Americans than for Caucasians. ■ After rising from 1980 to 2000, the incident rates for all races stabilized. ■ African American rates rose more quickly than rates for all other races. ■ In 2001, incident rates for American Indians started to decline. Adjusted Incident Rates of ESRD by Race 1,200 J B F 1,000 All American Indian Asian Caucasian 800 600 J J J J J FF FF J J J J JJ FFFFFF J JJJJJ JJJJJJ FFF FF FFF FFFF JJ JJ FF J FFF HH HHH HH H JJ HHHHH 200 F HHHH HHH FF HHHH HHHH HH 400 80 19 81 19 82 19 83 19 84 19 85 19 86 19 87 19 88 19 89 19 90 19 91 19 92 19 93 19 94 19 95 19 96 19 97 19 98 19 99 20 00 20 01 20 02 20 03 20 04 20 05 20 06 20 07 20 08 20 09 0 19 Rate per Million H African American Year Kidney Disease Statistics for the United States | 3
- 4. ESRD Prevalence and Prevalent Rate ■ At the end of 2009, more than 871,000 people were being treated for ESRD. ■ Between 1980 and 2009, the prevalent rate for ESRD increased nearly 600 percent, from 290 to 1,738 cases per million. Adjusted Prevalent Rates of ESRD 2,000 Rate per Million 1,500 1,000 500 19 80 19 81 19 82 19 83 19 84 19 85 19 86 19 87 19 88 19 89 19 90 19 91 19 92 19 93 19 94 19 95 19 96 19 97 19 98 19 99 20 00 20 01 20 02 20 03 20 04 20 05 20 06 20 07 20 08 20 09 0 Year 4 | Kidney Disease Statistics for the United States
- 5. AKI Incidence ■ The number of hospitalizations that included an AKI diagnosis rose from 3,942 in 1996 to 23,052 in 2008. ■ The percentage of AKI diagnoses that required dialysis declined from 13.39 in 1996 to 2.25 in 2008. Any AKI Diagnosis 25,000 B B 15,000 10,000 5,000 B B B 0 1996 1999 2002 2005 2008 Year AKI Diagnosis with Dialysis 14 J 12 J 10 Percent Number of Hospitalizations 20,000 8 J 6 J 4 J 2 0 1996 1999 2002 2005 2008 Year Kidney Disease Statistics for the United States | 5
- 6. CKD Co-morbidities ■ People with no CKD are more likely than people with stage 3 to 5 CKD to be alive 1 year after a heart attack. ■ The 1-year mortality for heart attack patients without identified CKD is 36 percent, compared with 51 percent for patients with stage 3 to 5 CKD. All-cause Survival in Patients with a First Diagnosis of Cardiovascular Disease, by CKD Stage, 2007–2008 1.0 B J 0.9 B 0.8 J Percent 0.7 B J 0.6 B J B B B B B J B B J B B J J J J J J J 0.5 0.4 0.3 B 0.2 J No CKD CKD Stage 3–5 0.1 0 0 1 2 3 4 5 6 Months 7 8 ESRD Treatment Modality ■ More than 10 times as many ESRD patients receive hemodialysis (HD) treatments at a clinic as those who do peritoneal dialysis (PD) and home HD combined. 10 12 400,000 350,000 300,000 Dialysis Patients Other or uncertain dialysis (1,262) Continuous cycler-assisted peritoneal dialysis (18,064) Continuous ambulatory peritoneal dialysis (9,458) Home HD (4,511) In-center HD (365,566) 250,000 200,000 150,000 100,000 50,000 0 Transplant Patients (172,553) 6 | Kidney Disease Statistics for the United States 11 Number of ESRD Patients by Treatment Modality At the end of 2009, 398,861 ESRD patients were being treated with some form of dialysis; 172,553 ESRD patients had a working trans planted kidney. Number of ESRD Patietns ■ 9 Dialysis Patients (398,861)
- 7. Kidney Transplantation After rising steadily from 1980 to 2006, the annual number of kidney transplants declined in 2007 and 2008. Annual Number of Kidney Transplants 20,000 10,000 J J 5,000 J J J J J J J J J J H H H H H H H H J H H H H J J J J J H H H H H H H H H H B Total Deceased Donor H Living Donor 09 08 20 20 06 07 20 05 03 04 20 20 20 20 01 02 20 00 20 99 20 98 19 97 96 19 19 95 94 19 19 19 92 91 93 19 19 90 89 19 19 19 88 0 19 Number 15,000 J J J J J Year Kidney Disease Statistics for the United States | 7
- 8. ESRD Mortality ■ Though the total number of ESRD patient deaths has continued to rise, the death rate has declined in recent years after peaking in 2001. ■ The number of deaths from ESRD rose from 10,478 in 1980 to 90,118 in 2009. Unadjusted Annual Mortality for ESRD Patients Mortality Rates for ESRD Patients Number of Deaths per 1,000 Patients, Years at Risk 200 150 100 50 0 1980 1985 1990 1995 2000 2005 2009 Year Total Patient Deaths for ESRD Patients 100,000 90,000 B B Number of Patient Deaths 80,000 B 70,000 60,000 B 50,000 40,000 B 30,000 B 20,000 10,000 B 0 1980 1985 1990 1995 Year 8 | Kidney Disease Statistics for the United States 2000 2005 2009
- 9. Mortality Rates for Dialysis Patients After rising from 1980 to 2001, mortality rates for dialysis patients started to fall every year. By 2008, they had returned to early 1980s levels. Death Rates for Patients on Dialysis Number of Deaths per 1,000 Patients, Years at Risk 250 200 150 100 50 09 20 08 20 20 07 06 20 20 05 04 20 20 03 02 20 01 20 00 20 95 19 90 19 85 19 19 80 0 Year General Graft Survival Rates 10-year General Graft Survival Rates The percentage of grafts transplanted in 1980 that survived to 1990 was 25.7. That percentage improved steadily in the following decades, with the survival rate from 1999 to 2009 rising to 44.9. 50 40 Percent 30 20 10 19 99 –2 0 09 08 07 19 98 –2 0 6 –2 0 00 19 97 –2 05 –2 0 96 19 95 00 19 –2 0 95 19 90 –1 9 85 19 19 80 –1 9 90 0 Years Kidney Disease Statistics for the United States | 9
- 10. Graft Survival Rates by Race While graft survival is lower in African Americans than in Caucasians, patient survival rates are about equal. Graft Survival Rates by Race 100 90 B J B J 80 B 60 Percent 70 J 50 B 40 30 J 20 B J African Americans Caucasians 10 1 99 0 ye 9– a 20 rs 09 ) (1 (2 (2 3 m 00 o 8– nth 20 s 09 ) (2 00 1 y 8– e 20 ar 09 ) 00 5 ye 4– a 20 rs 09 ) 0 Patient Survival Rates for Dialysis and Transplant Patients At 85.5 percent, the 5-year survival rate for transplant patients is more than twice the 35.8 percent survival rate for dialysis patients. Patient Survival Rates by Dialysis and Transplant 100 J J 90 80 J J B 70 B Percent 60 B 50 40 B 30 B Dialysis Patients 20 J Transplant Patients 10 0 1 year (2008–2009) 2 years (2007–2009) 10 | Kidney Disease Statistics for the United States 3 years (2006–2009) 4 years (2005–2009) No data available 5 years (2004–2009)
- 11. ESRD Costs Treating ESRD patients cost the United States over $40 billion in public and private funds in 2009. ESRD Costs in Billions $13.47 $12.04 Total: $16.74 1998 $10.68 $5.53 $4.70 $29.03 $21.31 $13.82 Total: $31.99 2005 Total: $19.35 2000 Non-Medicare Costs Total: $42.50 2009 Medicare Costs Costs per Patient ■ ESRD annual expenditures per patient have increased slightly in recent years. ■ From 2006 to 2007, transplant costs per patient decreased but increased again in 2008. ■ Yearly costs for treating a patient on HD are nearly triple the costs for treating a transplant patient. Annual ESRD Treatment Costs per Patient for HD, PD, Transplantation (Tx), and all ESRD $100,000 $90,000 $80,000 $70,000 Cost $60,000 $50,000 $40,000 $30,000 $20,000 $10,000 0 2006 2007 2008 Year 2009 HD PD Tx All ESRD Kidney Disease Statistics for the United States | 11
- 12. Definition vascular access: a general term to describe where blood is removed from and returned to the body during HD. A vascular access may be an arteriovenous (AV) fistula, an AV graft, or a catheter. An AV fistula is the preferred type of vascular access because it causes fewer problems with infection and clotting. Catheters have the most problems with infection. AV Fistula Use among Men and Women ■ AV fistula use increased from 27.9 to 55.0 percent between 1998 and 2007. ■ AV fistula use increased in both men and women. ■ AV fistula use rates among men were twice as high as among women in the late 1990s. ■ Women have begun to narrow the gap in AV fistula use. Percentage of Patients with an AV Fistula 70 B 60 Percent 50 40 30 20 B B H H J J B H J B H J B B H H J J H H H Male H H J J J J B 10 B B B All J Female 0 1998 1999 2000 2001 2002 2003 Year 12 | Kidney Disease Statistics for the United States 2004 2005 2006 2007
- 13. AV Graft Use among Men and Women ■ The decline in AV graft use mirrors the rise in AV fistula use. ■ AV graft use among women is higher than among men. ■ The gap in AV graft use among men and women narrowed gradually between 1998 and 2007. Percent of Patients with an AV Graft 70 J 60 H Percent 50 B J H B J H B 40 J H B J J H H B B 30 J J H B J H H B B 20 B 10 Male H All J J H B Female 0 1998 1999 2000 2001 2002 2003 2004 2005 2006 2007 Year Kidney Disease Statistics for the United States | 13
- 14. Catheter Use for Vascular Access Around 18 percent of dialysis patients use a catheter for their vascular access. Percent of All Patients with a Catheter 20 Percent 15 10 5 0 1998 1999 2000 2001 2002 2003 Year 14 | Kidney Disease Statistics for the United States 2004 2005 2006 2007
- 15. Acknowledgments Publications produced by the Clearinghouse are carefully reviewed by both NIDDK scientists and outside experts. National Kidney Disease Education Program 3 Kidney Information Way Bethesda, MD 20892 Phone: 1–866–4–KIDNEY (1–866–454–3639) TTY: 1–866–569–1162 Fax: 301–402–8182 Email: nkdep@info.niddk.nih.gov Internet: www.nkdep.nih.gov The National Kidney Disease Education Pro gram (NKDEP) is an initiative of the National Institute of Diabetes and Digestive and Kidney Diseases, National Institutes of Health, U.S. Department of Health and Human Services. The NKDEP aims to raise awareness of the seriousness of kidney disease, the importance of testing those at high risk, and the availability of treatment to prevent or slow kidney disease. Kidney Disease Statistics for the United States | 15
- 16. National Kidney and Urologic Diseases Information Clearinghouse 3 Information Way Bethesda, MD 20892–3580 Phone: 1–800–891–5390 TTY: 1–866–569–1162 Fax: 703–738–4929 Email: nkudic@info.niddk.nih.gov Internet: www.kidney.niddk.nih.gov The National Kidney and Urologic Diseases Information Clearinghouse (NKUDIC) is a service of the National Institute of Diabetes and Digestive and Kidney Diseases (NIDDK). The NIDDK is part of the National Institutes of Health of the U.S. Department of Health and Human Services. Established in 1987, the Clearinghouse provides information about diseases of the kidneys and urologic system to people with kidney and urologic disorders and to their families, health care professionals, and the public. The NKUDIC answers inquiries, develops and distributes publications, and works closely with professional and patient organizations and Government agencies to coordinate resources about kidney and urologic diseases. This publication is not copyrighted. The Clearinghouse encourages users of this publication to duplicate and distribute as many copies as desired. This publication is available at www.kidney.niddk.nih.gov. U.S. DEPARTMENT OF HEALTH AND HUMAN SERVICES National Institutes of Health NIH Publication No. 12–3895 June 2012 The NIDDK prints on recycled paper with bio-based ink.