Download to read offline


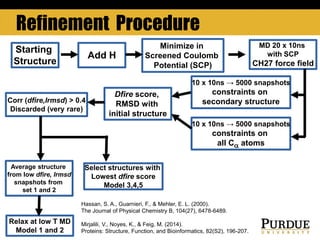
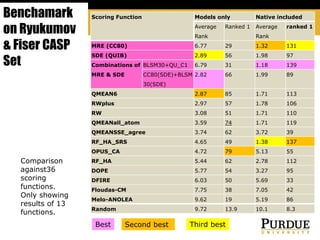
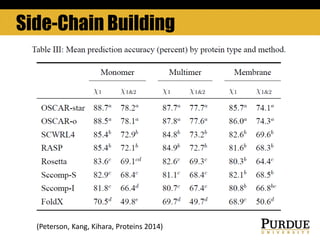
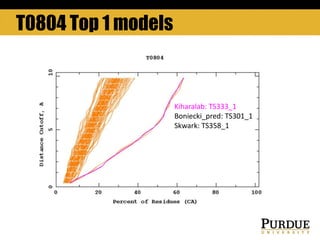
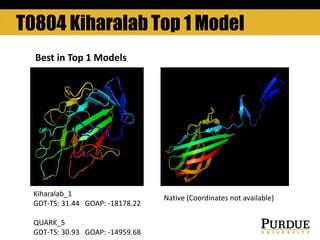
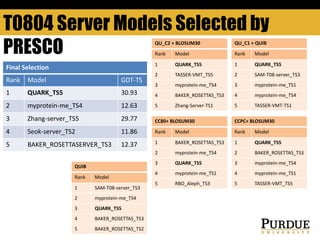

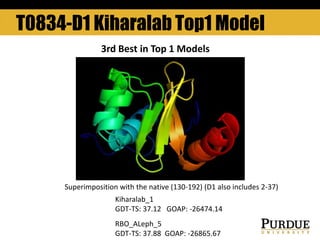


The document outlines methods and results for protein structure prediction and refinement using various scoring functions and models. It details procedures for evaluating and selecting models based on contact potentials, amino acid similarity matrices, and simulations, along with a compilation of top-ranked models in different categories. The authors acknowledge contributions from various researchers in the field and reference several studies that support their methods.


